
Repetitive transcranial magnetic stimulation promotes neurological functional recovery in rats with traumatic brain injury by upregulating synaptic plasticity-related proteins
2022-06-29 08:14FangFangQianYouHuaHeXiaoHuiDuHuaXiangLuRenHongHeJianZhongFan
中国神经再生研究(英文版) 2023年2期
Fang-Fang Qian , You-Hua He , Xiao-Hui Du Hua-Xiang Lu Ren-Hong He , Jian-Zhong Fan
Abstract Studies have shown that repetitive transcranial magnetic stimulation (rTMS) can enhance synaptic plasticity and improve neurological dysfunction. However, the mechanism through which rTMS can improve moderate traumatic brain injury remains poorly understood. In this study, we established rat models of moderate traumatic brain injury using Feeney’s weight-dropping method and treated them using rTMS. To help determine the mechanism of action, we measured levels of several important brain activity-related proteins and their mRNA. On the injured side of the brain, we found that rTMS increased the protein levels and mRNA expression of brain-derived neurotrophic factor, tropomyosin receptor kinase B, N-methyl-D-aspartic acid receptor 1, and phosphorylated cAMP response element binding protein, which are closely associated with the occurrence of long-term potentiation. rTMS also partially reversed the loss of synaptophysin after injury and promoted the remodeling of synaptic ultrastructure. These findings suggest that upregulation of synaptic plasticity-related protein expression is the mechanism through which rTMS promotes neurological function recovery after moderate traumatic brain injury.
Key Words: brain-derived neurotrophic factor; moderate traumatic brain injury; neurological dysfunction; neurological improvement; N-methyl-D-aspartic acid receptor; repetitive transcranial magnetic stimulation; synaptic plasticity; synaptophysin; traumatic brain injury; TrkB
Introduction 368 Methods 369 Results 370 Discussion 371
Graphical Abstract
Repetitive transcranial magnetic stimulation induces synaptic plasticity after TBI

Introduction
Traumatic brain injury (TBI) refers to neuropathologic damage and dysfunction caused by blunt force to the head (McKee and Daneshvar, 2015). Patients with TBI typically show motor dysfunction, cognitive impairment, and behavioral abnormalities after regaining consciousness. Although neurological dysfunction usually returns to normal within 1 year in patients with mild TBI, long-term deficits can persist in 10–15% of cases. Further, long-term deficits occur in 50% of moderate injuries and an even greater proportion of severe injuries (Hoskison et al., 2009). At present, rehabilitation therapy is the best way to treat neurological deficits after TBI, including motor rehabilitative training, hyperbaric oxygen therapy, and electro-acupuncture (Lu et al., 2021). However, as neurological impairment still exists in most survivors of TBI even after rehabilitation therapy, there is an urgent need for new rehabilitation methods.
Repetitive transcranial magnetic stimulation (rTMS) is an efficient and painless brain-stimulation technology that generates a super-threshold current in the brain via electromagnetic induction (Seewoo et al., 2018; Xie et al., 2021; Shan et al., 2022). This method was originally used to explore cortical function in healthy participants (Latorre et al., 2019), but has been subsequently used to treat various neurological and psychiatric disorders. Recent research has shown that rTMS has the potential to treat TBI (Pape et al., 2006; Dhaliwal et al., 2015; Nardone et al., 2020). rTMS has been reported to significantly reduce neuronal death and glial activation in remote regions, and improve functional recovery in hemi-cerebellectomized rats (Sasso et al., 2016). Other research has indicated that high-frequency rTMS promotes cell proliferation and neurogenesis in the dorsolateral subependymal ventricular zone, as well as decreased loss of mature neurons and reduced apoptosis in the perilesional zone of rat models of TBI (Sasso et al., 2016). A recent study (Shin et al., 2018) revealed that cortical excitability and reorganization are a possible mechanism through which rTMS therapy combined with environmental enrichment leads to functional improvement after TBI. Several studies have reported that rTMS can promote histologic recovery (Verdugo-Diaz et al., 2017) and enhance brain activity (Yoon et al., 2015) in rat models of TBI. However, in fact, rTMS plays a neuroprotective role in many brain diseases, such as depression (Feng et al., 2012), schizophrenia (Eastwood, 2004), Parkinson’s disease (Cacace et al., 2017), vascular dementia (Yang et al., 2015) and stroke (Hong et al., 2021) through changes in synaptic plasticity, particularly long-term depression (LTD) and long-term potentiation (LTP) of synaptic connections.
TBI has been shown to lead to neuronal cell necrosis, extensive axonal lesions, and physiological and biochemical disorders, all of which result in anatomical and functional changes in synaptic transmission (Algattas and Huang, 2013; Ng and Lee, 2019). Some researchers have suggested that rTMS may promote functional recovery of damaged nerve tissue after TBI by enhancing synaptic plasticity between cortical neurons (Bolognini et al., 2009; Villamar et al., 2012; Nardone et al., 2020). At present, the underlying mechanism is still not completely understood. One possible mechanism through which high-frequency rTMS promotes neural functional recovery after TBI is an increase in the expression of synaptic plasticity-related proteins. Specifically, N-methyl-D-aspartic acid receptor 1 (NMDAR1) (Volianskis et al., 2015) and cAMP response element binding protein (CREB) (Todorovski et al., 2015) have been shown to play a key role in synaptic plasticity. Moreover, brainderived neurotrophic factor (BDNF) (Miranda et al., 2019) is known as an important upstream regulator of LTP. The BDNF-tropomyosin receptor kinase B (TrkB) pathway plays an important role in neural development, maturation, neurogenesis, and survival (Wurzelmann et al., 2017). Additionally, synaptophysin (SYN) is stored in presynaptic vesicles after neuronal synthesis and reflects the number, density, and distribution of synapses (Yu et al., 2018). We hypothesized that production of these five proteins involved in synaptic plasticity is facilitated with nerve repair and functional recovery following TBI, and tested this hypothesis in a rat model of TBI.
Methods
Animals
Forty-five male Sprague-Dawley rats (250–300 g, 8 weeks old) were used in this study. Male rats were used because TBI is more common in men than women (Gupte et al., 2019). The rats were purchased from the Experimental Animal Center of Southern Medical University (license No. SCXK [Yue] 2021-0041) and housed in a room with a 12-hour light/dark cycle, maintained at 15–25°C. Food and water were availablead libitum
. All animal procedures conformed to the guidelines issued by the Committee on Animal Research of Nanfang Hospital (Guangzhou, China) and guidelines for the Care and Use of Laboratory Animals from the National Institute of Health (8, 2021). The study was approved by the Institutional Ethics Committee of Nanfang Hospital (application No. NFYY-2020-0317) on March 20, 2020.TBI model establishment
The rat model of moderate TBI was established using Feeney’s weightdropping method, as previously described (Feeney et al., 1981). After anesthesia with 1% pentobarbital (40 mg/kg; Experimental Animal Center of Southern Medical University, Guangzhou, China) via intraperitoneal injection, shaving, and disinfection, an incision at the middle of the sagittal plane was made in the scalp. A lesion was generated in the right hemisphere 1.5 mm posterior and 2.5 mm lateral to the bregma (Feeney et al., 1981), and a 5-mm diameter round piece of skull was removed, while the dura mater was kept intact. Then, a footplate (4.5 mm in diameter) was directly attached to the dura, and a weight was dropped onto it with a force of impact to the right hemisphere cortex of 20 g × 30 cm. According to a previous study (Gao et al., 2004), this method causes moderate TBI. Next, we closed the bone window with bone wax and sutured the scalp. After recovery from anesthesia, the animals were put back into their cages and provided with water and food. All animal models were made by experienced researchers within 2 days. In the sham group (n
= 15), only a 5-mm diameter bone window was opened to ensure integrity of the brain parenchyma. The complete experimental process is shown inFigure 1
.
Figure 1|Experimental flow chart.rTMS: Repetitive transcranial magnetic stimulation; RT-PCR: reverse transcriptionpolymerase chain reaction; TBI: traumatic brain injury.
Magnetic resonance imaging examination and behavioral evaluation
All rats were anesthetized with 1% pentobarbital (40 mg/kg) via intraperitoneal injection 3 days after TBI and scanned with a magnetic resonance imaging (MRI) machine (Bruker Biospec 7.0T, Bruker Medical Systems, Karlsruhe, Germany). Animals were fixed in the prone position and coronal T2-weighted images were taken with the following parameters: slice thickness = 0.7 mm, spacing = 0 mm, repetition time (TR) = 3156.9 ms, echo time (TE) = 33 ms, field of view (FOV) = 4 cm × 4 cm, and matrix = 128 × 128. ImageJ software (version 1.6; National Institutes of Health, Bethesda, MD, USA) (Schneider et al., 2012) was used to calculate the area of brain tissue on the injured and uninjured sides. Behavior was assessed using the modified neurological severity score (mNSS) at 3, 9, and 16 days after TBI, which was consistent with the time window selected in previous studies (Sasso et al., 2016; Lu et al., 2017). mNSS comprises motor, sensory, balance, and reflex tests and is scored as follows: mild neurological injury, 1–6; moderate neurological injury, 7–12; and severe neurological dysfunction, 13–18 (Lee et al., 2013). Each rat was scored separately by two experimenters. Rats with scores in the 7–12 range (moderate injury) 3 days after TBI were selected for subsequent experiments.
rTMS treatment
Rats with TBI were randomly divided into TBI (TBI alone,n
= 15) and rTMS (TBI with rTMS,n
= 15) groups. Each day, rats in the rTMS group received 40 trains of rTMS at 20 Hz for 1 second, with 15-second intervals between trains (Luo et al., 2017). Stimulation intensity was set to 30% of the relaxed motor threshold. Rats were awake during stimulation and fixed in a plastic fixator with their heads exposed. The coil was placed above the brain injured site, close to the scalp. Meanwhile, rats in the sham and TBI groups were also placed close to the instrument so that they could hear the rhythmic sound produced by the coil. Starting 4 days after TBI, rTMS was performed once daily, five times per week.Two weeks after rTMS treatment, six rats in each group were perfused with normal saline into the heart after anesthesia with 1% pentobarbital (40 mg/kg) via intraperitoneal injection until a colorless fluid flowed from the mouth and nose. The brain tissue used for electron microscope sections was dissected from the location near the injured area and stored with 4% glutaraldehyde for 4 hours. Then, the remaining brain tissue was removed and paraffin sections were made for immunohistochemical staining. Another six rats in each group were sacrificed using the same procedure and used for western blot and real-time polymerase chain reaction (RT-PCR) analyses. The remaining three rats in each group were not used.
Transmission electron microscopy
To observe synaptic ultrastructure, the dissected brain tissue was trimmed to approximately 1 mm, fixed with 1% osmic acid (Google Biotechnology, Wuhan, China) for 2 hours, dehydrated in acetone, and embedded in epoxy resin Epon-812 (SPI, Guangzhou, China). Sections with a thickness of approximately 80 nm were prepared using a UC7 ultra-thin slicer (Leica, Weztlar, Germany). The sections were double-stained with 2% uranium acetate and lead citrate. Images were observed and recorded using a Hitachi 7700 transmission electron microscope (Electron microscope Experimental Center of Southern Medical University, Guangzhou, China). Fifty synapses were randomly selected from each group, and the average thickness of the postsynaptic density (PSD), the width of the synaptic cleft, and the length of the synaptic active zone (AZ) were quantified and analyzed with NIS-Elements BR software (version 4.2.0; Nikon, Tokyo, Japan).
Immunohistochemistry
To evaluate immunopositivity for BDNF, TrkB, NMDAR1, phosphorylated (p)-CREB and SYN around the injured area, the paraffin sections reserved for immunohistochemistry were fixed in 4% paraformaldehyde for 24 hours, then dehydrated with alcohol and embedded in paraffin wax. Five sections (3 µm thick) were taken from the injured site, and baked in a 60°C oven for 2 hours for later use. After this deparaffinization, the sections were then incubated overnight at 4°C with BDNF (rabbit, 1:2000, Abcam, Cat# ab108319, RRID:AB_10862052), TrkB (rabbit, 1:250, Abcam, Cat# ab187041, RRID: AB_2892613), NMDAR1 (rabbit, 1:200, Abcam, Cat# ab68144, RRID: AB_1141847), P-CREB (rabbit, 1:100, Abcam, Cat# ab32096, RRID: AB_731734), and SYN (rabbit, 1:2000, Abcam, Cat# ab32127, RRID: AB_2286949). Next, the sections were rinsed in Tris buffered saline-Tween three times, each time lasting 5 minutes. The sections were then incubated with secondary antibody (goat anti-rabbit, 1:2000, Abcam, Cat# ab205718, RRID: AB_2819160) at 37°C for 45 minutes and 50 µL diaminobenzidine was added. After re-dying with hematoxylin, the sections were dehydrated and sealed. Immunopositivity was observed under an optical microscope (CX31, Olympus, Tokyo, Japan) at 400× magnification. Image Pro Plus 6.0 (Media Cybernetics, MD, USA) was used to calculate the positive cell number/total cell number for each of the five proteins of interest (BDNF, TrkB, NMDAR1, SYN, and P-CREB).
Western blot assay
To assess the protein levels for BDNF, TrkB, NMDAR1, P-CREB and SYN, some of the tissue from the injured cortex was selected for western blot assay, and the remaining tissues was used for RT-PCR detection. The tissue was homogenized in radio-immunoprecipitation assay lysis buffer and protein concentrations were measured using the bicinchoninic acid method. Samples were separated by sodium dodecyl sulfate-polyacrylamide gel electrophoresis and transferred to polyvinylidene fluoride membranes. The blots were blocked with 5% skimmed milk for 1 hour at 37°C, followed by incubation with the following primary antibodies: anti-BDNF (rabbit, 1:1000, Abcam, Cat# ab108319, RRID: AB_10862052), TrkB (rabbit, 1:1000, Abcam, Cat# ab187041, RRID: AB_2892613), NMDAR1 (rabbit, 1:10,000, Abcam, Cat# ab68144, RRID: AB_1141847), P-CREB (rabbit, 1:10,000, Abcam, Cat# ab32096, RRID: AB_731734), and SYN (rabbit, 1:80,000, Abcam, Cat# ab32127, RRID: AB_2286949) at 4°C overnight. After washing with Tris buffered saline-Tween, the membranes were incubated with secondary antibody (goat anti-rabbit, 1:10,000, Sungenebiotech, Tianjin, China, Cat# LK2001) for 1 hour at room temperature. Next, they were put into the photo-chemiluminescence gel imaging system to determine the corresponding protein band strength. The bands were quantitated using ImageJ software. Glyceraldehyde-3-phosphate dehydrogenase was used as an internal reference to calculate the relative expression of each antibody.
qRT-PCR
To assess the mRNA expression levels for BDNF, TrkB, NMDAR1, P-CREB and SYN, total RNA was extracted from the injured cerebral hemisphere using Trizol reagent (Aidlab Biotechnology, Beijng, China). An equal amount of RNA was converted into complementary DNA using RevertAid reverse transcriptase (Thermo Fisher Scientific, Waltham, MA, USA). Using the glyceraldehyde-3-phosphate dehydrogenase gene as the internal reference, mRNA expression of the BDNF, TrkB, NMDAR1, P-CREB, and SYN genes was detected by PCR. For each gene, two specific PCR primers were used:BDNF
(forward: 5′-AGA ATG ACA AGG CAT AGG AAG GT-3′; reverse: 5′-CCA AGA GGT AAA GTG TAG AAG GGA-3′),Ntrk2
(forward: 5′-GGA TTT GGT GTA CCG AGC CT-3′; reverse: 5′-TTG ATG TGC CGC AGG TTG-3′),Grin1
(forward: 5′-CGT GGG CAA CAC CAA CAT C-3′; reverse: 5′-AGT CAC TCC GTC CGC ATA CTT-3′),CREB
(forward: 5′-GAC AAC CAG CAG AGT GGA GAT G-3′; reverse: 5′-TTA CAG TGG GAG CAG ATG ACG-3′),Syp1
(forward: 5′-TGG GGT TCA GGG ATG ATC TAA-3′; reverse: 5′-GAG TAC GCC CTC CTG CTT TTA-3′), and glyceraldehyde-3-phosphate dehydrogenase (forward: 5′-CGC TAA CAT CAA ATG GGG TG-3′; reverse: 5′-TTG CTG ACA ATC TTG AGG GAG-3′). RT-PCR reactions were performed in a 20-µL total volume with 5 µL cDNA diluted 10 times, 0.4 µL each for forward and reverse primers, 10 µL AceQ Universal SYBR qPCR Master Mix (2× mix), and 4.2 µL ddHO. The amplification protocol consisted of one cycle at 95°C for 5 minutes followed by 40 cycles at 95°C for 10 seconds and 60°C for 10 seconds. The formula 2was used to indicate the relative expression level of each gene (Tabatabaeian and Hojati, 2013).Statistical analysis
No statistical methods were used to predetermine sample sizes; however, our sample sizes are similar to those reported in a previous publication (Zhou et al., 2022). No animals or data points were excluded from the analysis. The evaluators were blinded to the assignments. All data are reported as mean ± standard deviation (SD). Group differences were determined by Student’st
-test using SPSS 25.0 (IBM, Armonk, NY, USA). The level of statistical significance was set atP
< 0.05.Results
TBI model establishment
Magnetic resonance imaging results of rat brain tissue 3 days after TBI are shown inFigure 2A
. In the sham group, only the scalp was damaged and the brain tissue was intact. There was no significant difference in the ratio between the area of the injury and the area of the uninjuerd hemisphere between the TBI and rTMS groups (Figure 2B
). Moreover, there were no differences in body weight (Figure 3A
) or mNSS values (Figure 3B
) among the three groups. These data support the conclusion that the TBI model was stable.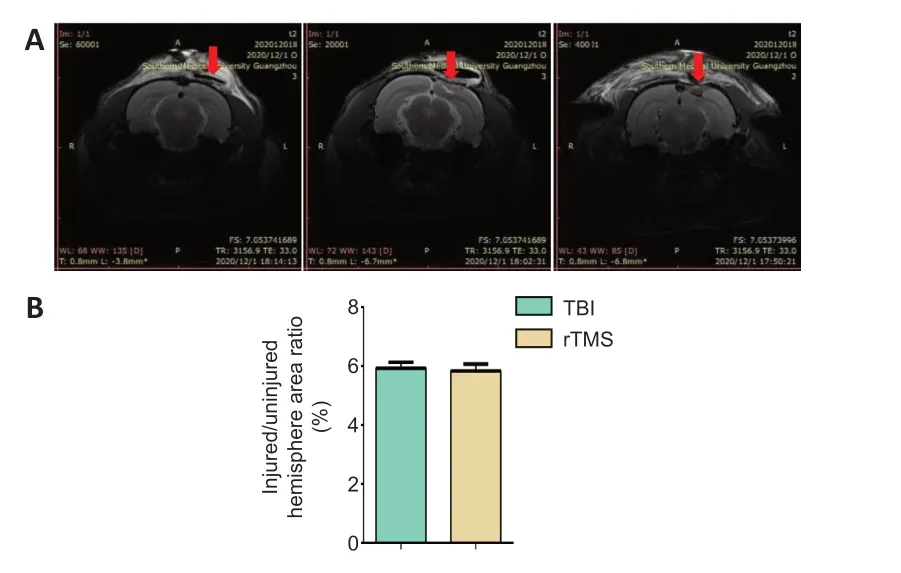
Figure 2|Stability of the TBI model.(A) Magnetic resonance imaging indicates no significant difference in the size of parenchymal injury between the TBI and rTMS groups. (B) Quantitative result for the ratio of injured area to ipsilateral area 3 days after TBI. Data are expressed as mean ± SD (n = 15/group), and were analyzed by Student’s t-test. rTMS: Repetitive transcranial magnetic stimulation; TBI: traumatic brain injury.

Figure 3|Body weight (A) and mNSS (B) for rats in each of the three groups 3 days after TBI.Data are expressed as mean ± SD (n = 15/group), and were analyzed by Student’s t-test. mNSS: Modified neurological severity score; rTMS: repetitive transcranial magnetic stimulation; TBI: traumatic brain injury.
rTMS improves neurological function in rats with TBI
The rTMS treatment procedure is shown inFigure 4A
. To evaluate whether rTMS can improve neurological dysfunction induced by TBI, mNSS was compared at 3, 9, and 16 days after TBI. We found that mNSS was significantly lower in the rTMS group than in the TBI group at 16 days (F
= 1.079,t
= –3.313, dt = 28;Figure 4B
).
Figure 4|TMS improve neurological functional recovery after TBI.(A) Experimental schedule. (B) Quantitative result for mNSS score. Data are expressed as mean ± SD (n = 15/group). *P < 0.05, rTMS vs. TBI (Student’s t-test). mNSS: Modified neurological severity score; rTMS: repetitive transcranial magnetic stimulation; TBI: traumatic brain injury.
rTMS improves the synaptic structure and plasticity-related protein expression in the brains of rats with TBI
PSD thickness, synaptic cleft width, and synaptic AZ length were observed under transmission electron microscopy. PSD thickness was thinner, synaptic cleft width was increased, and the synaptic AZ was shortened in the TBI group than in the sham group (P
< 0.01). rTMS treatment mitigated these structural changes (P
< 0.01,vs
. TBI group;Figure 5
).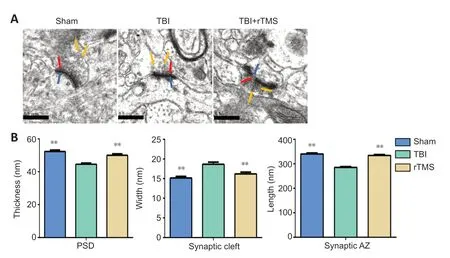
Figure 5|rTMS promotes the remodeling of synaptic structures after TBI.(A) After 20 Hz rTMS, synaptic ultrastructure was significantly improved compared with the TBI group (20,000× magnification; scale bars: 0.5 µm). The red arrow indicates the presynaptic membrane; the blue arrow indicates the postsynaptic membrane; the yellow arrow indicates the presynaptic vesicle. (B) Quantitative results for the thickness of the postsynaptic density, width of the synaptic cleft, and length of the synaptic active zone. Data are expressed as mean ± SD (n = 6/group). **P < 0.01, vs. TBI group (Student’s t-test). AZ: Active zone; PSD: postsynaptic density; rTMS: repetitive transcranial magnetic stimulation; TBI: traumatic brain injury.
SYN protein and mRNA levels were examined at 16 days after TBI using immunochemistry and western blot assay. Weak immunopositive SYN staining was observed in the TBI group but not in the sham group (F
= 1.198,t
= 8.204, dt = 10,P
< 0.01). After rTMS treatment, strong immunohistochemical staining for SYN was observed in the cytoplasm of cells around the injury site (F
= 0.683,t
= 2.321, dt = 10,P
= 0.043). SYN protein levels in the TBI group were significantly lower than those in the sham group, indicating loss of synapses (F
= 0.327,t
= 3.659, dt = 10,P
< 0.01). They were also significantly lower than in the rTMS group (F
= 0.768,t
= 2.928, dt = 10,P
= 0.015), indicating that rTMS led to an increase in synapses. Similarly, SYN mRNA expression in the TBI group was significantly lower than that in the sham group (F
= 90.250,t
= 11.857, dt = 10,P
< 0.01), but higher after rTMS treatment (F
= 2.317,t
= 7.3, dt = 10,P
< 0.01;Figure 6
).rTMS increases the expression of synaptic functional plasticity-related proteins in injured brain of TBI rats
Protein levels for BDNF, TrkB, NMDAR1, and P-CREB in the injured cortex were assessed at 16 days after TBI using immunochemistry. The cytoplasm of cells around the injury site showed stronger immunohistochemical staining for positive cells of BDNF (F
= 0.932,t
= –2.498,P
= 0.032), TrkB (F
= 0.137,t
= –3.295,P
< 0.01), NMDAR1 (F
= 0.653,t
= –2.426,P
= 0.036), and P-CREB (F
= 6.085,t
= –4.268,P
< 0.01) in the TBI group than in the sham group. The percentage of positive cells increased after rTMS treatment for positive cells of each protein (BDNF:F
= 1.031,t
= 2.70,P
= 0.022, rTMSvs
. TBI group, TrkB:F
= 1.288,t
= 2.345,P
= 0.041, rTMSvs
. TBI group, NMDAR1:F
= 0.143,t
= 3.059,P
= 0.012, rTMSvs.
TBI group, P-CREB:F
= 0.621,t
= 2.826,P
= 0.018, rTMSvs
. TBI group;Figure 7
).Tissue from the injured hemisphere was used for western blot assay and RTPCR at 16 days after TBI. Protein levels (BDNF:F
= 0.022,t
= –5.964, dt = 10,P
< 0.01, TrkB:F
= 0.505,t
= –2.416, dt = 10,P
= 0.036, NMDAR1:F
= 0.610,t
= –2.576, dt = 10,P
= 0.028, P-CREB:F
= 4.076,t
= –3.915, dt = 10,P
< 0.01;Figure 8
) and mRNA expression (BDNF:F
= 14.233,t
= –4.634, dt = 10,P
< 0.01, TrkB:F
= 28.250,t
=–4.861, dt = 10,P
< 0.01, NMDAR1:F
= 16.088,t
= –6.487, dt = 10,P
< 0.01, CREB:F
= 43.438,t
= –7.350, dt = 10,P
< 0.01;Figure 9
) for BDNF, TrkB, NMDAR1, and P-CREB were higher in the TBI group than in the sham group. Notably, levels were further upregulated after rTMS treatment (protein: BDNF:F
= 0.069,t
= 2.258, dt = 10,P
= 0.048, rTMSvs
. TBI group, TrkB:F
= 0.137,t
= 2.626, dt = 10,P
= 0.025, rTMSvs
. TBI group, NMDAR1:F
= 0.308,t
= 2.682, dt = 10,P
= 0.023, rTMSvs
. TBI group, P-CREB:F
= 0.705,t
= 2.296, dt = 10,P
= 0.045, rTMSvs
. TBI group; mRNA: BDNF:F
= 0.664,t
= 2.266, dt = 10,P
= 0.047, rTMSvs
. TBI group, TrkB:F
= 1.992,t
= 2.784, dt = 10,P
= 0.019, rTMSvs
. TBI group, NMDAR1:F
= 0.862,t
= 2.416, dt = 10,P
= 0.036, rTMSvs
. TBI group, CREB:F
= 0.003,t
= 6.043, dt = 10,P
< 0.01, rTMSvs
. TBI group).
Figure 6| rTMS reduces the loss of SYN after TBI.(A) After 20 Hz rTMS, the number of cells around the injury site that were positive for SYN were higher than they were for the TBI group (400× magnification). Scale bars: 50 µm. (B) Quantification of SYN-positive cells. (C) Quantification of SYN mRNA expression in the injured hemisphere. (D) Western blot images of SYN protein level in the injured hemisphere 16 days after TBI. (E) Relative protein expression of SYN, which was normalized by GAPDH. Data are expressed as mean ± SD (n = 6/group). *P < 0.05, vs. TBI group (Student’s t-test). GAPDH: Glyceraldehyde-3-phosphate dehydrogenase; rTMS: repetitive transcranial magnetic stimulation; SYN: synaptophysin; TBI: traumatic brain injury.

Figure 7| rTMS increases the number of BDNF, TrkB, NMDAR1, and P-CREB positive cells around the injured area after TBI.(A) After 20 Hz rTMS, the number of BDNF, TrkB, NMDAR1, and P-CREB positive cells around the injury site were higher than they were in the TBI group. Scale bars: 50 µm. (B) Quantification BDNF-, TrkB-, NMDAR1-, and P-CREB-positive cells. Data are expressed as mean ± SD (n = 6/group). *P < 0.05, vs. TBI group (Student’s t-test). BDNF: Brainderived neurotrophic factor; NMDAR1: N-methyl-D-aspartic acid receptor 1; P-CREB: phosphorylated cAMP response element binding protein; rTMS: repetitive transcranial magnetic stimulation, TBI: traumatic brain injury; TrkB: tropomyosin receptor kinase B.
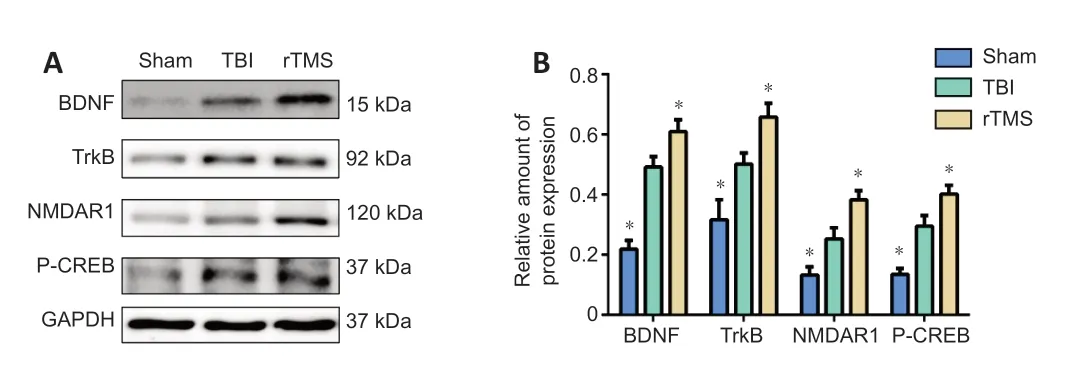
Figure 8| rTMS increases BDNF, TrkB, NMDAR1, and P-CREB protein levels in the injured hemisphere after TBI. (A) Western blot images representing protein expression levels of BDNF, TrkB, NMDAR1, and P-CREB in the injured hemisphere of rats 16 days after TBI. (B) Relative protein expression of BDNF, TrkB, NMDAR1 and p-CREB, normalized by GAPDH. Data are expressed as mean ± SD (n = 6/group). *P < 0.05, vs. TBI group (Student’s t-test). BDNF: brain-derived neurotrophic factor; GAPDH: Glyceraldehyde-3-phosphate dehydrogenase; NMDAR1: N-methyl-D-aspartic acid receptor 1; P-CREB: phosphorylated cAMP response element binding protein; rTMS: repetitive transcranial magnetic stimulation; TBI: traumatic brain injury; TrkB: tropomyosin receptor kinase B.

Figure 9| Quantification of BDNF, TrkB, NMDAR1, and CREB mRNA expression in the injured hemisphere. Data are expressed as mean ± SD (n = 6/group). *P < 0.05, vs. TBI group (Student’s t-test). BDNF: Brain-derived neurotrophic factor; CREB: cAMP response element binding protein; NMDAR1: N-methyl-D-aspartic acid receptor 1; rTMS: repetitive transcranial magnetic stimulation; TBI: traumatic brain injury; TrkB: tropomyosin receptor kinase B.
Discussion
The current results showed that the expression of synaptic plasticity related proteins (BDNF, TrkB, NMDAR1, P-CREB, and SYN) in injured cerebral cortex was significantly higher after high-frequency rTMS. In addition to these neuroprotective effects, we demonstrated that high-frequency rTMS improved functional recovery in TBI rats, as evidenced by a reduction in mNSS value, suggesting that this method is a promising strategy for TBI rehabilitation.
Modulation of synaptic transmission following TBI likely includes axonal sprouting, synaptogenesis, synaptic remodeling, and synaptic strengthening, which are all processes that promote synaptic plasticity (Algattas and Huang, 2013; Ng and Lee, 2019). Thus, we directly examined synaptic ultrastructure via transmission electron microscopy. We found greater PSD thickness, lower synaptic cleft width, and longer synaptic active zones after rTMS treatment. Furthermore, rTMS reduced the loss of SYN. SYN exists widely in nerve endings in the central and peripheral nervous system and is specifically distributed in presynaptic vesicle membranes. It is considered a biomarker of presynaptic terminals and has been extensively used to quantify the number, density, and distribution of synapses (Yu et al., 2018; Ji et al., 2021). It has also been demonstrated that BDNF knockout mice showed significant synaptic fatigue at the CA1 synapse under high-frequency stimulation, and that the number of docked vesicles in the presynaptic active region was significantly reduced (Pozzo-Miller et al., 1999). Surprisingly, BDNF may suppress autophagy via the TrkB and the phosphatidylinositol 3 kinase (PI3K)/Akt pathway, reducing the degradation of synaptic proteins and promoting the reconstruction of synaptic structures (Hernandez et al., 2012; Nikoletopoulou et al., 2017). Here, we also report that BDNF and TrkB expression were also higher after rTMS treatment in TBI rats.
rTMS can cause long-lasting changes in cortical excitability. A stimulation frequency ≤ 1 Hz suppresses cortical excitability and produces LTD, while a stimulation frequency ≥ 5 Hz facilitates cortical excitability and generates LTP (Page et al., 2015; Iglesias, 2020). LTP and LTD are the main types of functional synaptic plasticity (Levy et al., 2018; Koller and Chakrabarty, 2020) that can be assessed by electrophysiologically. Therefore, it is not surprising that we detected proteins closely related to the occurrence of LTP.
NMDARs are thought to play a bidirectional role in the occurrence and development of TBI. In the acute phase, excitotoxicity caused by glutamate accumulation is mainly mediated by NMDARs, which leads to secondary neuronal injury and various behavioral dysfunctions. However, in the subacute and chronic phases, NMDAR activation can resist synaptic transmission disturbances caused by the continuous increase in inhibitory neurotransmitters. To avoid the aggravation of nerve tissue damage caused by acute excitatory toxicity, it is recommended that rTMS treatment be initiated 24–72 hours in rat models of TBI. However, the application of rTMS at this stage is likely to be impractical clinically (Levy et al., 2018; Koller and Chakrabarty, 2020). Therefore, we gave 20 Hz rTMS to injured rats on the 4th day after TBI. After 1 week of rTMS treatment, we found that mNSS values were lower in the rTMS group than in the TBI group, but the difference was not statistically significant. However, when tested after 2 weeks of rTMS treatment, we found that a statistical difference had emerged. These results suggest that rTMS can promote neurological function in rats with brain injury, but that the effect is cumulative, and the course of treatment should be at least 2 weeks.
NMDARs are an important mediator of brain plasticity and can transform specific neuronal activity patterns into changes in synaptic structure and function (Piubelli et al., 2021), which is considered the basis of changes in behavioral function. NMDAR1 is present in all endogenous NMDARs and is widely expressed throughout development (Ju and Cui, 2016; Zhang et al., 2018). High frequency rTMS promotes the release of presynaptic glutamate after TBI, which binds to the corresponding NMDAR in the postsynaptic membrane. When the post-synaptic membrane is sufficiently depolarized, magnesium ions are expelled from the cation channel, allowing sodium and calcium ions to flow into the cell. This influx of calcium is thought to be the cause of LTP induction (Malenka et al., 1988; Volianskis et al., 2015). Evidence from human studies also suggests that the effect of rTMS depends critically on the activation of the glutamatergic NMDAR since these effects are blocked by the NMDAR antagonist dextromethorphan (Stefan et al., 2002). In the present study, we found that the NMDAR1 protein levels in the cerebral cortex were higher after rTMS treatment in TBI rats. This result is similar to that of a previous study (Lisanby and Belmaker, 2000), which found an increase in the number of NMDARs in the ventromedial thalamus, amygdala, and parietal cortex after rTMS treatment. Therefore, we speculate that rTMS enhances NMDAR1 protein expression in rats with TBI and eventually leads to the induction of LTP.
LTP maintenance is split into early and late phases. Early LTP involves changes in synaptic strength following the redistribution of medium and ion activity, lasting 30 to 60 minutes (Chervyakov et al., 2015). In contrast, late LTP (L-LTP) is associated with variations in gene expression and protein synthesis that last for hours, days, or even weeks (Chervyakov et al., 2015). CREB is an important transcription factor that is thought to contribute to the formation of L-LTP and long-term memory (Bourtchuladze et al., 1994) by initiating transcription of proteins (Glazewski et al., 1999). It has been reported that LIMK1-knockout mice, drastically impaired in long-term memory and selectively defective in L-LTP, were rescued by increasing the activity of CREB (Todorovski et al., 2015). Furthermore, LTP does not last > 90 minutes in the hippocampus of animals lacking most of the major isoforms of CREB (Barth et al., 2000). These results suggest that cAMP-dependent signaling cascades play an important role in L-LTP in mammals. Overall, our findings indicate that high-frequency rTMS enhanced expression of the CREB gene in rat models of TBI and may induce the occurrence L-LTP .
Cainflux in the postsynaptic membrane activates calcium-sensitive signaling, such as calcium/calmodulin-dependent kinase II (CaMKII), which triggers CREB phosphorylation in the nucleus (P-CREB) (Wang and Peng, 2016; Gandolfi et al., 2017). P-CREB activates BDNF transcription by binding to a key calcium response element in the BDNF gene (Yan et al., 2016; Esvald et al., 2020). In a previous study, blocking Casuppressed CREB phosphorylation, and P-CREB downregulation reduces BDNF transcription triggered by electrical stimulation in cultured postnatal dorsal root ganglion neurons from rats (Yan et al., 2016). Furthermore, P-CREB can be reduced by blocking CaMKII with inhibitors KN93 or KN62, and suppressed by specific knockdown of the CaMKIIα or CaMKIIβ subunit (Glazewski et al., 1999).
BDNF belongs to the neurotrophic factor family, which is mainly synthesized by neurons and remains highly expressed in the cerebral cortex and hippocampus of rodents and humans. Not only does BDNF regulate neuronal development, growth, and survival, it also plays a role in synaptic transmission and LTP (Numakawa et al., 2018; Miranda et al., 2019). The BDNF receptor tyrosine kinase, TrkB, is colocalized with BDNF in the central nervous system, suggesting that BDNF may act in a paracrine or an autocrine fashion (Tao et al., 1998). Several studies have shown that the induction of LTP can increase the mRNA levels of BDNF and its TrkB receptor (Bramham et al., 1996; Lee et al., 2005). It has been reported that the secretion time for BDNF is about 1 minutes for early LTP, and 5–12 minutes for L-LTP (Hartmann et al., 2001; Aicardi et al., 2004). Importantly, treatment of tissue slices from BDNF knockout (BDNF) mice with recombinant BDNF significantly improves deficits in synaptic transmission and completely reverses deficits both early LTP and late LTP (Patterson et al., 1996). Further, application of TrkB-IgG fusion proteins and BDNF antibody also result in impaired LTP in rat hippocampal slices (Chen et al., 1999). These results suggest that endogenous BDNF plays a specific role in the induction of LTP. However, these effects inevitably relate to the activation of TrkB (Chao, 2003). It has been reported that LTP can be induced by an increase in transcription, translation, and transportation of TrkB after high frequency activity (Gómez-Palacio-Schjetnan and Escobar, 2013). Additionally, insertion of TrkB receptors into active synapses increased under high frequency stimulation, which ensured preferential regulation of active synapses by BDNF (Nagappan and Lu, 2005). Additionally, lateral movement of TrkB from extra-synaptic sites into the synapse resulted in better transmission of BDNF signaling (Nagappan and Lu, 2005).
The early effects of BDNF are due to the modification of components at the synapse (e.g., protein phosphorylation). At the presynaptic level, the activation of TrkB receptors can upregulate glutamate release induced by depolarization of synaptosomes in the hippocampus and cortex (Leal et al., 2014). At the postsynaptic level, TrkB receptor activation phosphorylates plasma membrane-associated NMDAR by activating the PI3K/Akt pathway (Zhang et al., 2011; Lin et al., 2014). A recent study also showed that 5 Hz rTMS for 5 days improves BDNF-TrkB signaling and TrkB–NMDAR interaction in lymphocytes (Wang et al., 2011). Moreover, when TrkB binds to the TrkB receptor, it activates the mitogen-activated protein kinase/extracellular signalregulated kinase (MAPK) pathway to enhance phosphorylation at Ser133 of CREB (Li and Liu, 2010; Liu et al., 2020). Therefore, the BDNF-TrkB pathway and NMDAR/CREB form a positive feedback circuit that promotes LTP. The long-lasting effects of BDNF-controlled LTP and alterations in the synaptic proteome might result from the regulation of microRNA (miRNA) expression (Smalheiser et al., 2010; Jaitner et al., 2016). BDNF might activate synaptic consolidation through transcription and rapid dendritic trafficking of mRNA encoded by the immediate early gene, Arc. (Bramham and Messaoudi, 2005; Wibrand et al., 2006), thus making LTP exist in a more stable state. The formation of LTP increases the excitability of the injured brain hemispheres, thus maintaining the balance between hemispheres and ultimately promoting the recovery of neurological function (Talelli and Rothwell, 2006; Di Filippo et al., 2008). Consistent with previous studies, mRNA expression and protein levels of BDNF and TrkB were significantly higher in the cerebral cortex of rats with TBI after treatment with high-frequency rTMS. Similar to previous studies (Felderhoff-Mueser et al., 2002; Feng et al., 2017), the enhanced expression of BDNF, TrkB, NMDAR1 and P-CREB is thought to be the result of increased self-compensatory synthesis of neurons.
This study has several limitations. The first is the experimental equipment and technology. We did not directly measure LTP, but instead measured the levels of proteins related to LTP. Second, the effects of rTMS on neurological function were not observed when LTP was blocked. Third, although we used the smallest round coils available, the size of the coil was still larger than the rat brain. Thus, we could not ensure that stimulation was applied to a specific brain region. Fourth, as rats were only observed for 2 weeks after TBI, the subsequent therapeutic effects of rTMS remain unknown.Fifth, we only used mNSS as an index of neural function, but these values can be greatly influenced by subjective factors.Sixth, we did not apply rTMS to uninjured rats. Whether the rTMS effect observed in rats with TBI can be replicated in uninjured rats remains to be investigated. Finally, as our sample size was small, the experimental results should be confirmed in large-scale studies.In conclusion, our findings suggest that rTMS may promote the recovery of neurological function in TBI rats through the following mechanisms: (1) high-frequency rTMS could enhance SYN protein levels to promote synaptic reconstruction after TBI. (2) high-frequency rTMS could affect the expression of certain synaptic proteins, such as NMDAR1, P-CREB, BDNF, and TrkB, which have been shown to be closely related to the occurrence of LTP.
Acknowledgments:
We thank Dr. Xiao-Ying Miao (Department of Rehabilitation Medicine, Nanfang Hospital, Southern Medical University) and Dr. Ling Li (Department of Neurology, Nanfang Hospital, Southern Medical University) for the technical support on experiments on animals.
Author contributions:
Study conception and design: JZF, RHH; experiment implementation and data acquisition: FFQ, XHD, HXL; data analysis, and manuscript draft and revision: FFQ, YHH. All authors read and approved the final version of this manuscript.
Conflicts of interest:
The authors declare no conflict of interest.
Author statement:
This paper has been posted as a preprint on Research Square with doi: https://doi.org/10.21203/rs.3.rs-757647/v1, which is available from: https://assets.researchsquare. com/files/rs-757647/v1/7dee3887-4308-4d82-af8b-9a7e92e0e174.pdf?c=1631887412.
Open access statement:
This is an open access journal, and articles are distributed under the terms of the Creative Commons AttributionNonCommercial-ShareAlike 4.0 License, which allows others to remix, tweak, and build upon the work non-commercially, as long as appropriate credit is given and the new creations are licensed under the identical terms.
- 中国神经再生研究(英文版)的其它文章
- c-Abl kinase at the crossroads of healthy synaptic remodeling and synaptic dysfunction in neurodegenerative diseases
- The mechanism and relevant mediators associated with neuronal apoptosis and potential therapeutic targets in subarachnoid hemorrhage
- Microglia depletion as a therapeutic strategy: friend or foe in multiple sclerosis models?
- Brain and spinal cord trauma: what we know about the therapeutic potential of insulin growth factor 1 gene therapy
- Functions and mechanisms of cytosolic phospholipase A2 in central nervous system trauma
- Cre-recombinase systems for induction of neuronspecific knockout models: a guide for biomedical researchers