
Platelet-rich plasma promotes peripheral nerve regeneration after sciatic nerve injury
2022-06-29 08:14SuLongWangXiLinLiuZhiChenKangYueShuWang
中国神经再生研究(英文版) 2023年2期
Su-Long Wang , Xi-Lin Liu , Zhi-Chen Kang, Yue-Shu Wang
Abstract The effect of platelet-rich plasma on nerve regeneration remains controversial. In this study, we established a rabbit model of sciatic nerve small-gap defects with preserved epineurium and then filled the gaps with platelet-rich plasma. Twenty-eight rabbits were divided into the following groups (7 rabbits/group): model, low-concentration PRP (2.5–3.5-fold concentration of whole blood platelets), medium-concentration PRP (4.5–6.5-fold concentration of whole blood platelets), and high-concentration PRP (7.5–8.5-fold concentration of whole blood platelets). Electrophysiological and histomorphometrical assessments and proteomics analysis were used to evaluate regeneration of the sciatic nerve. Our results showed that platelet-rich plasma containing 4.5–6.5- and 7.5–8.5-fold concentrations of whole blood platelets promoted repair of sciatic nerve injury. Proteomics analysis was performed to investigate the possible mechanism by which platelet-rich plasma promoted nerve regeneration. Proteomics analysis showed that after sciatic nerve injury, platelet-rich plasma increased the expression of integrin subunit β-8 (ITGB8), which participates in angiogenesis, and differentially expressed proteins were mainly enriched in focal adhesion pathways. Additionally, two key proteins, ribosomal protein S27a (RSP27a) and ubiquilin 1 (UBQLN1), which were selected after protein-protein interaction analysis, are involved in the regulation of ubiquitin levels in vivo. These data suggest that platelet-rich plasma promotes peripheral nerve regeneration after sciatic nerve injury by affecting angiogenesis and intracellular ubiquitin levels.
Key Words: bioinformatic analysis; ITGB8; leukocyte-platelet rich plasma; nerve regeneration; peripheral nerve injury; platelet-rich plasma; proteomic analysis; sciatic nerve injury 1Department of Hand Surgery, China-Japan Union Hospital of Jilin University, Changchun, Jilin Province, China; 2Department of Rehabilitation, The Second Hospital of Jilin University, Changchun, Jilin Province, China

Introduction 375 Methods 375 Results 377 Discussion 380
Graphical Abstract
PRP promotes peripheral nerve regeneration and increases expression of ITGB8

Introduction
Platelet-rich plasma (PRP) is a platelet concentrate obtained by centrifugation of autologous blood. When activated, the platelets in PRP can release various growth factors, which can promote cellular mitosis and accelerate tissue regeneration. These factors include platelet-derived growth factor, vascular endothelial growth factor, brain-derived growth factor, and insulin-like growth factor 1 (IGF-1). PRP has the advantage of being easy to prepare, does not cause rejection, and promotes tissue regeneration. PRP has been widely used in various fields of clinical medicine for promotion of cartilage tissue repair (Wang et al., 2020); osteoarthritis treatment (Xu et al., 2021); bone tissue (Li et al., 2022), muscle, tendon, and other soft tissue regeneration (Zhang et al., 2013; Walsh et al., 2018); refractory wound repair (Uçar and Çelik, 2020); plastic surgery (Elnehrawy et al., 2017; Hui et al., 2017); and stomatology (ElSheshtawy et al., 2020).
Peripheral nerve injury is common and results from various types of injury, including acute open trauma, chronic nerve compression, and neurodegenerative disease (Li et al., 2021; Qu et al., 2021). Although rapid development of microsurgical technology has perfected nerve anastomosis, the postoperative recovery of neurological function remains a challenge (Kuffler, 2014). Clinically, the positive PRP effect on peripheral nerve regeneration has been widely recognized. For instance, a prospective randomized, single-blind, head-to-head comparative trial showed that for patients with moderate carpal tunnel syndrome, the recovery at 3 and 6 months after a single PRP injection was greatly superior to that after a single injection of 5% glucose (Shen et al., 2019). Wu et al. (2017) performed a prospective, randomized, single-blind controlled trial and reported remarkable relief of pain symptoms in carpal tunnel syndrome patients at 6 months after a single PRP injection. Beneficial effects of PRP have also been reported in other types of peripheral nerve injury. For example, García de Cortázar et al. (2018) described a patient with a radial nerve injury who achieved satisfactory neurological recovery 11 months after PRP treatment. Sánchez et al. (2014) used PRP injection therapy in a patient with common peroneal nerve paralysis, and electromyography results showed effective innervation of the peroneus longus and tibialis anterior muscles 21 months after PRP injection. However, despite widespread recognition of the efficacy of PRP treatment for peripheral nerve regeneration, the mechanisms underlying the effects remain unclear. This study aimed to investigate the effects of different concentrations of PRP on peripheral nerve regeneration. We also performed proteomic analysis to investigate the differentially expressed protein after PRP treatment and briefly explore the possible mechanism underlying PRP effects on peripheral nerve regeneration.
Methods
Animals
All animal tests in this study were approved by the Animal Ethics Committee of Basic Medical College of Jilin University (approval No. 2021271; October 13, 2021). All experiments were designed and reported according to the Animal Research: Reporting ofIn Vivo
Experiments (ARRIVE) guidelines (Percie du Sert et al., 2020). The rabbits were adapted to the environment by feeding them in the laboratory for 3 days before surgery. The temperature was controlled at 20–22°C, and a 12-hour dark/light cycle was adopted. All surgical procedures were performed aseptically. The animals used for the study were naïve and did not undergo drug tests. Male rabbits have stronger central auricular arteries than females, which make it easier to collect blood. Therefore, 28 conventional male New Zealand white rabbits (5-month-old; 2.5–3.5 kg; provided by Changchun Yisi Experimental Animal Technology Co., Ltd.; Changchun, China; license No. SCXK [Ji] 2017-0003) were randomly divided into four groups (n
= 7/group): model group, low-concentration PRP group (2.5–3.5-fold concentration of whole blood platelets), medium-concentration PRP group (4.5–6.5-fold concentration of whole blood platelets), and highconcentration PRP group (7.5–8.5-fold concentration of whole blood platelets). The experimental model used a small gap defect with epineurium. In the model group, the nerve defect area was filled with saline. In the other groups, the nerve defect areas were filled with different concentrations of PRP. The right sciatic nerve and bilateral triceps surae muscles of the rabbits were harvested 12 weeks after surgery. The study design is shown inFigure 1
.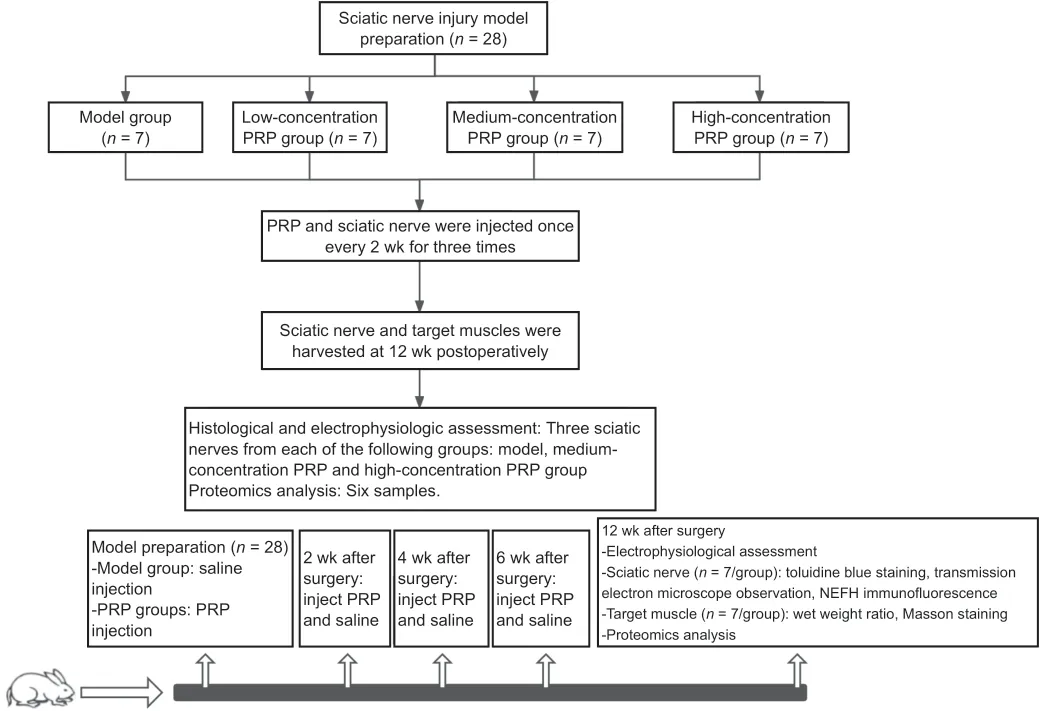
Figure 1|The flow chart for the experiment.NEFH: Neurofilament heavy protein; PRP: platelet-rich plasma.
Model preparation
The left gluteus maximus muscle was injected with 3% pentobarbital sodium solution (60 mg/kg; Xiya Chemical Technology Co., Ltd., Chengdu, China) for anesthesia. After 4–5 minutes of anesthesia, the right gluteal area was prepared and disinfected with iodophor, and a sterile surgical sheet was placed over the area. The skin was incised longitudinally along the midline between the sciatic tuberosity and the greater trochanter, which exposed the biceps femoris muscle. Then, the muscle was separated bluntly along the muscle fiber, and the sciatic nerve was exposed. The epineurium was incised longitudinally approximately 1 cm distal to the biceps femoris muscle branch emanating from the sciatic nerve. The epineurium and the nerve beneath it were then removed after ensuring the integrity of the epineurium. Under direct vision, nerve tissue was cut off and a small gap defect area of approximately 5 mm in length was created. Normal saline or different concentrations of PRP were then applied to the defect area according to group allocation. The epineurium was then sutured. The model used in this experiment was based on a previously described experimental model (Cheng et al., 2015), which was classified as a Sunderland type IV damage model. The advantage of this model is that nerve injury is more precise than that in the nerve crush injury model, and the result is similar to that obtained with the direct transection method. Compared with the nerve transection method, this model avoids the experimental error caused by the reflection and mismatch of nerve fiber bundles during end-to-end anastomosis. The left sciatic nerve was used as a normal control. The details of model preparation and blood collection are shown inAdditional file 1
. The incision was disinfected once every 2 days after surgery, and antibiotics (800,000 IU penicillin) were injected intramuscularly for 3 consecutive days after surgery. The right lower limbs of the rabbits were wrapped in gauze to prevent gnawing.Autologous PRP preparation and injection
Blood was extracted from rabbit central auricular arteries: 10 mL of whole blood from rabbits in the low-concentration PRP group, 15 mL of whole blood from rabbits in the medium-concentration PRP group, and 20 mL of whole blood from rabbits in the high-concentration PRP group. The blood was mixed with 4% sodium citrate at a ratio of 10:1. A PRP preparation kit and a centrifuge provided by WEGO (Changchun, China) were used to produce the PRP. Whole blood was placed in the centrifuge tube, and PRP was prepared by two-step centrifugation (888 ×g
for 10 minutes followed by 1278 ×g
for 10 minutes) at 22°C. The first centrifugation step separated the blood into three layers: the erythrocyte layer at the bottom, supernatant layer at the top, and PRP layer in the middle. The erythrocyte layer was appropriately extracted from the bottom after the first centrifugation step. After the second centrifugation, the supernatant layer was removed, leaving the complete PRP layer in the middle and resulting in 2 mL PRP. Whole blood and the final PRP (0.05 mL each) were removed for platelet counts. The platelet concentration and enrichment index (platelet concentration of PRP/platelet concentration of peripheral blood) were calculated. The PRP was injected into the nerve defect area, and the epineurium was sutured. Further injections of PRP and saline were administered immediately after modeling and once every 2 weeks for a total of three consecutive injections after the surgery. The characterization of PRP is shown inAdditional file 1
.Electrophysiological assessment
An electrophysiological assessment was performed in each group of rabbits at 12 weeks after surgery. After skin preparation, bilateral gluteal regions and lower extremities of the rabbits were moistened with saline and an electromyogram evoked potential instrument (NDI-200P+; Shanghai Haishen Medical Electronic Instrument Company; Shanghai, China) was used for detection. The current intensity was 5–30 mA, stimulation time was 0.1 ms, and sensitivity was 5 mV. A disposable sterile electromyographic needle (NR.15.1-38; REPUSI; Suzhou, Jiangsu Province, China) was placed into the gastrocnemius muscle, while the grounding electrode was placed in the Achilles tendon. Spontaneous potential was detected as the needle was pierced into the muscle, which meant the appearance of neurogenic injury. Electrical stimulation was released by the bipolar excitation electrode at the proximal end of the nerve injury. Bilateral amplitude and latency of the compound muscle action potential were recorded, and the recovery index (RI) was calculated. The latency RI was the maximum latency of the affected side (right)/the maximum latency of the healthy side (left). The amplitude RI was the maximum amplitude of the affected side (right)/the maximum amplitude of the healthy side (left). After nerve injury, the latency would be prolonged, and the amplitude would be reduced. Therefore, in this situation, the latency RI was > 1, and the amplitude RI was < 1. An RI value of approximately 1 indicates good recovery of the nerve. Two points at the proximal and distal ends of the nerve injury, respectively, were selected to apply electrical stimulation, and the conduction velocities of the bilateral sciatic nerve were calculated according to the conduction time and the distance between the two stimulation points. The conductive velocity of normal sciatic nerves was different in each rabbit. To reduce error, the conduction velocity of bilateral sciatic nerves was expressed as a ratio of right to left, which was used to evaluate the recovery of conductive function.
Histomorphometrical assessment of the regenerating nerve
Twelve weeks after surgery, rabbits were euthanized with 3% pentobarbital sodium (60 mg/kg) by intermuscular injection, and the right sciatic nerves were collected. A portion (0.5 cm) of the nerve was removed and fixed with glutaraldehyde. The nerve tissue was divided into two parts. One part was used for immunofluorescence detection of axon regeneration, which was analyzed by ImageJ 1.53c software (Schneider et al., 2012) to measure the integral optical density of the neurofilament. The neurofilament heavy protein monoclonal antibody (RMdO-20, mouse anti-rabbit, 1:200; Thermo Fisher Scientific, San Jose, CA, USA, Cat# 13-1300, RRID: AB_2532999) was used as the primary antibody and was incubated overnight with nerve tissue at 4°C. Fluorescein isothiocyanate-conjugated goat anti-mouse IgG (1:200; Shanghai Universal Biotech Company, Shanghai, China, Cat# abs20003, RRID: AB_2904556) was applied as the secondary antibody and incubated for 40 minutes at 20–22°C. The other part of the nerve was fixed by osmium tetroxide infiltration (Institution of Zoonosis, Jilin University, Changchun, Jilin Province, China). The resin-embedded sample was cut into semi-thin and ultra-thin sections. The semi-thin sections were stained with toluidine blue to evaluate the regeneration of myelinated nerve fibers. The percentage of cross-sectional areas of myelinated nerve fibers was calculated. The ultra-thin sections were examined by transmission electron microscopy (H-7650; Hitachi, Tokyo, Japan) to determine the myelin thickness of myelinated nerve fibers. Image Pro Plus 6.0 (Media Cybernetics Inc., Bethesda, MD, USA) was used to calculate the area, proportion, and myelin thickness of myelinated nerve fibers.
Gastrocnemius wet weight ratio and histological evaluation
Twelve weeks after surgery, the rabbits were euthanized as described above, and the bilateral triceps were completely removed. The weights of the muscles were measured to obtain the wet weight ratio of the target muscles on both sides. The muscle belly of the right triceps was harvested and fixed with formalin for Masson’s trichrome staining (Solarbio, Beijing, China). The tricep myofibril composition ratio (areas of myofibril/collagen fibers) was calculated using Image Pro Plus 6.0 software.
Liquid chromatography-mass spectrometry analysis
To determine differences in protein expression between the model group and medium-concentration or high-concentration PRP groups (which had better recovery), three sciatic nerves were harvested from the model group for proteomics analysis. Two sciatic nerves were collected from the mediumconcentration PRP group and one sciatic nerve was collected from the highconcentration PRP groups, which had satisfactory recovery. The tissues were removed rapidly and stored in liquid nitrogen. The method used for this analysis was the label-free relative quantification method, and the method of sample preparation is shown inAdditional file 1
. The samples (1–2 µg) were dissolved in the loading buffer (1% acetonitrile and 0.1% formic acid) for analysis. An Easy-nLC 1000 system (Thermo Fisher Scientific) was used with an analytical column (PepMap 100 C18, 2 µm, 75 µm × 250 mm with NanoViper fittings; Thermo Fisher Scientific, Stockbridge, GA, USA) and a flow rate of 0.2 mL/minute. The mass spectrometer was a Q-Exactive HF system (Thermo Fisher Scientific). Tandem mass spectrometry was performed in the data dependent acquisition mode. The full scan resolution was 60,000 (full width at half maximum), the scanning range of parent ions was 400–1600 m/z, and the collision energy was 32% higher energy collision-induced dissociation.Database retrieval and protein quantitative analysis
In this study, the proteomes based on mass spectrometry were used. After a series of optimizations, protein identification was performed by comparing the mass spectrometry data with the database data for similarity and scoring. Proteome Discoverer 2.4 (Thermo Fisher Scientific; Bremen, Germany) was used to search the Uniprot database (https://www.uniprot.org/) using the parameters described inAdditional Table 1
.The peptide intensities of the primary mass spectrometry analyses were used as the quantitative parameters of the label-free quantification. The expression of proteins was estimated by summing the calculated weights of the peak peptide intensities. The normalized protein abundance was obtained by normalizing the peak intensity of each protein in each sample, which was used for the quantitative analysis of individual proteins in all of the samples. Using pairwise comparisons between groups, the mean values of the normalized signals for each sample were calculated to determine the intergroup ratio fold-change. Student’st
-tests were used to assess differences between groups. The following conditions were used as the criteria for screening differential proteins between groups: (1) an inter-group ratio foldchange ≥ 1.2 or ≤ 0.83; (2)P
-value < 0.05.Bioinformatics analysis
Bioinformatics evaluation included the analysis of significant differences. Differentially expressed proteins based on component modulation were analyzed by unsupervised hierarchical clustering, Gene Ontology (GO), Kyoto Encyclopedia of Genes and Genomes (KEGG) pathway function enrichment, and protein-protein interaction (PPI) analyses.
For the experimental design with biological replicates (n
≥ 3), the sample data after mass spectrometry detection were evaluated using the inter-group Student’st
-test/Mann-WhitneyU
test to obtain two parameter values, which were theP
-value and fold-change. These values were then used to compile a volcano plot to show the significant differences between the two groups of samples and identify the most significantly altered proteins.Hierarchical cluster analysis was performed to analyze differentially expressed proteins between the groups (Meunier et al., 2007). The distance between two samples was calculated using protein expression data, and the distance matrix was formed. Adjacent classes were merged, and the distances between the new class and the current classes was calculated. The merging and calculations were continued until only one class remained. The direct correlation between samples was investigated by detecting the expression of selected differential proteins. In general, samples of the same class could be in the same cluster in the clustering tree because of the close distance of data attributes, and proteins with close expression values could also be in the same cluster, which may indicate similar biological functions.
GO enrichment and pathway enrichment analyses were performed on the differentially expressed proteins obtained from each group. The differentially expressed proteins were classified according to the GO categories included in the GO database (http://geneontology.org/). The classification results were based on the discrete distribution of significance analysis. Ten entries with the smallestP
-value were selected to draw the bar plot (less than 10 entries were shown in all). The GO analysis was divided into three categories, which described the molecular function of the gene, the cellular location, and the biological process involved.P
-values were obtained by Fisher’s exact test withP
< 0.05 indicating significant protein enrichment rather than random matching. LowerP
-values indicated more significant enrichment. The 10 entries with the lowestP
-values were selected.For pathway enrichment analysis, the differentially expressed proteins were analyzed using the KEGG database. The probability of differentially expressed proteins being mapped to different pathways was calculated using the Fisher’s exact test to determine pathway enrichment. AP
-value < 0.05 indicated significant pathway enrichment and that the pathway was affected by the experimental treatment. For pathway analysis, 15 entries with the smallestP
-values were selected and plotted on a dot plot (if less than 15, all entries were shown).The protein-protein interaction network was observed using Cytoscape 3.8.0 version (National Institute of General Medical Sciences; Bethesda, MD, USA) and included 100 differential proteins. All of the proteins were arranged according to the degree of connection, which implied the importance of each protein in the network.
Thirty key proteins were selected by combining the results of the PPI, GO, and KEGG analyses, and the target proteins were analyzed by mass spectrometry using the multiple reaction mode (MRM) technique. Each sample (150 µg) was added to 100 µL of 100 mM triethylammonium bicarbonate. After filteraided proteome preparation, enzymatic digestion, and desalting, the target proteins were screened for quantitative signature peptides, and the MRM mode was used to detect the target peptides. The conditions of screening and MRM detection are shown inAdditional file 1
.Statistical analysis
A preliminary experiment with a total of 12 rabbits (n
= 3 rabbits/group) was performed to calculate sample size. The percentage of myelinated nerve fiber area was used as the outcome measurement. The sample size was calculated by PASS version 15.0.5 software (NCSS, LLC; Kaysville, UT, USA) with an α of 0.05 and power of 0.9. The result wasn
= 7/group.Data were analyzed using SPSS version 26.0 (IBM Corp.; Armonk, NY, USA) and visualized using GraphPad Prism 8.0.2 (GraphPad Software, Inc.; San Diego, CA, USA). The Shapiro-Wilk normality test was performed on all data (P
< 0.05 indicating compound normal distribution). Leven’s chi-square test was used for data with composite normal distributions (P
< 0.05 indicating equal variance), and Tukey’s multiple comparison test (P
< 0.05 indicating statistical significance) was used if the data showed equal variance. Dunn’s multiple comparison test was used for non-normally distributed data. Statistical analysis methods are shown inAdditional file 1
.Results
PRP improves electrophysiological recovery in rabbits with sciatic nerve injury
Action potentials were detected at the gastrocnemius receptive electrodes in all rabbits in the medium-and high-concentration PRP groups, one rabbit in the low-concentration PRP group, and in zero rabbits in the model group. There were no statistical differences in latency, amplitude RI, or conduction velocity between the medium- and high-concentration PRP groups (P
> 0.05;Figure 2
).PRP improves the morphological recovery of regenerated nerves in rabbits with sciatic nerve injury
Toluidine blue staining was used to calculate the number of regenerated myelinated nerve fibers in the regions of nerve defects in rabbits. In the medium- and high-concentration PRP groups, there were more regenerated myelinated nerve fibers compared with those in the model and lowconcentration PRP groups (P
< 0.01). Immunofluorescent staining of NEFH was performed to assess the levels of neurofilament protein. The immunopositivity of neurofilaments was higher in the medium- and highconcentration PRP groups than in the model and low-concentration PRP groups (P
< 0.001). Transmission electron microscopy was used to assess the thickness of the myelin sheath of myelinated nerve fibers, which indicates the maturity of the fibers. The number of regenerated nerve fibers in the medium- and high-concentration PRP groups was higher than that in the model and low-concentration PRP groups (P
< 0.01;Figure 3A–G
).PRP improves tricep recovery in rabbits with sciatic nerve injury
Masson’s trichrome staining of the triceps was performed to evaluate the tricep myofibril composition ratio (Figure 4A
). The degree of muscle fibrosis in the medium- and high-concentration PRP groups was lower than that in the model and low-concentration PRP groups. Masson’s staining showed that the tricep myofibril composition ratio in the medium- and high-concentration PRP groups was significantly higher than that in the model and low-concentration PRP groups (P
< 0.05). There was no significant difference in tricep myofibril composition ratio between the medium- and high-concentration PRP groups (P
> 0.05) or between the low-concentration PRP and model groups (P
> 0.05;Figure 4B
). The wet weight ratio of the triceps was calculated to assess the extent of denervation of the triceps (Figure 4C
). The wet weight ratio of the triceps was significantly higher in the medium- and high-concentration PRP groups than that in the model and low-concentration PRP groups (P
< 0.01). There was no significant difference in the wet weight ratio of the triceps between the medium- and high-concentration PRP groups (P
> 0.05) or between the model and low-concentration PRP groups (P
> 0.05;Figure 4D
).Proteomic analysis after PRP treatment of sciatic nerve injury
Results of the label-free relative quantification of proteins by mass spectrometry (Figure 5
) showed that 100 differentially expressed proteins were detected in the treatment groups compared with the model group of which 32 were upregulated and 68 were downregulated. The hierarchical clusters of the differential proteins between the groups are plotted inFigure 6
using unsupervised hierarchical cluster analysis. GO and KEGG pathway enrichment analyses were performed on proteins expressed differentially between the treatment and model groups. The results are summarized inAdditional Table 2
. GO pathway results showed that the following pathways were enriched: intracellular protein transport (four proteins, 5.47-fold enrichment), extracellular exosome (28 proteins, 2.67-fold enrichment), and calcium ion binding (nine proteins,P
= 0.0092, 3.29-fold enrichment;Figure 7
). The KEGG pathway analysis showed significant enrichment in seven pathways, including “focal adhesion” (count gene symbol 6,P
= 0.0018, 6.51-fold enrichment), “regulation of actin cytoskeleton” (count gene symbol 5,P
= 0.012, 5.35-fold enrichment), “biosynthesis of antibiotics” (count gene symbol 5,P
= 0.0172, 4.82-fold enrichment), “amino sugar and nucleotide sugar metabolism” (count gene symbol 3,P
= 0.0176, 14.20-fold enrichment), “valine, leucine and isoleucine degradation” (count gene symbol 3,P
= 0.0261, 11.51-fold enrichment), “PPAR signaling pathway” (count gene symbol 3,P
= 0.0389, 9.27-fold enrichment), and “metabolic pathways” (count gene symbol 11,P
= 0.0418, 1.90-fold enrichment) (Figure 8
). The PPI network contained 65 nodes and 54 edges. RPS27A (40S ribosomal protein S27a), UBQLN1 (Ubiquilin 1), UBA1 (ubiquitin-like modifier-activating enzyme 1), NPL0C4 (ubiquitin recognition factor), and CKMT1A (creatine kinase) were the five proteins that demonstrated the greatest number of interactions. Among them, RPS27A interacted with nine significantly expressed proteins, while UBQLN1 interacted with six significantly expressed proteins (Figure 9
andTable 1
). Based on the results of the PPI analysis and the GO and KEGG functional enrichment analyses, 30 significant proteins were selected and analyzed by MRM-targeted mass spectrometry. The results showed that 12 out of the 30 proteins followed the same trends observed in the treatment and the model groups (Table 2
).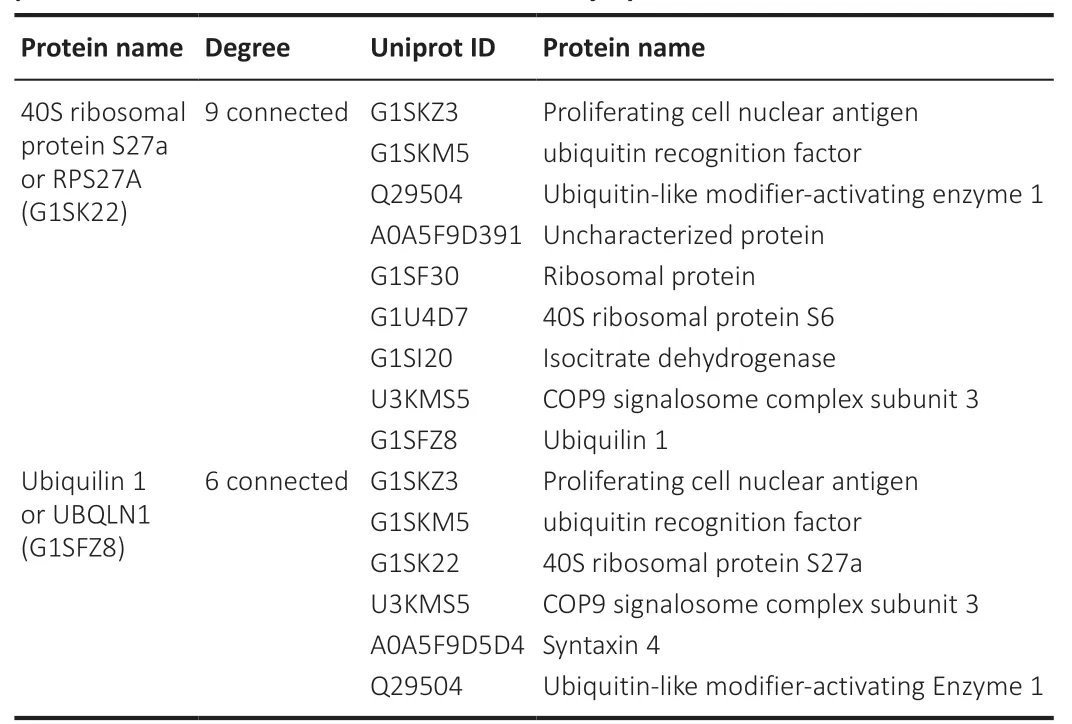
Table 1 | Protein-protein interaction (PPI) network of all differentially expressed proteins after PRP treatment for sciatic nerve injury

Table 2 |Results of MRM verifications for all differentially expressed proteins after PRP treatment of sciatic nerve injury
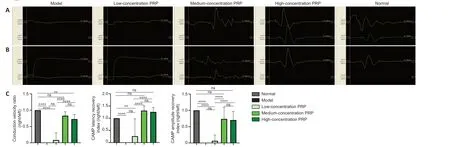
Figure 2|Effects of PRP on electrophysiological recovery in rabbits with sciatic nerve injury. (A) Typical images of compound muscle action potential. In medium- and high-concentration PRP groups, CMAP was detected, and the signal of CMAP was closer to normal. In the low-concentration PRP and model groups, no CMAP was detected, and the signal was flat. (B) CMAP latency and amputation (upper) and conduction velocity (lower). The latency, amplitude recovery index, and conduction velocity ratio in the medium-concentration PRP group were not different from those in the high-concentration PRP group (P > 0.05). (C) Quantitative results of conduction velocity, CMAP latency recovery index, and CMAP amplitude recovery index. Data are presented as means ± SD (n = 7). **P < 0.01, ****P < 0.0001 (Tukey’s multiple comparison test). CMAP: Compound muscle action potential; ns: not significant; PRP: platelet-rich plasma.
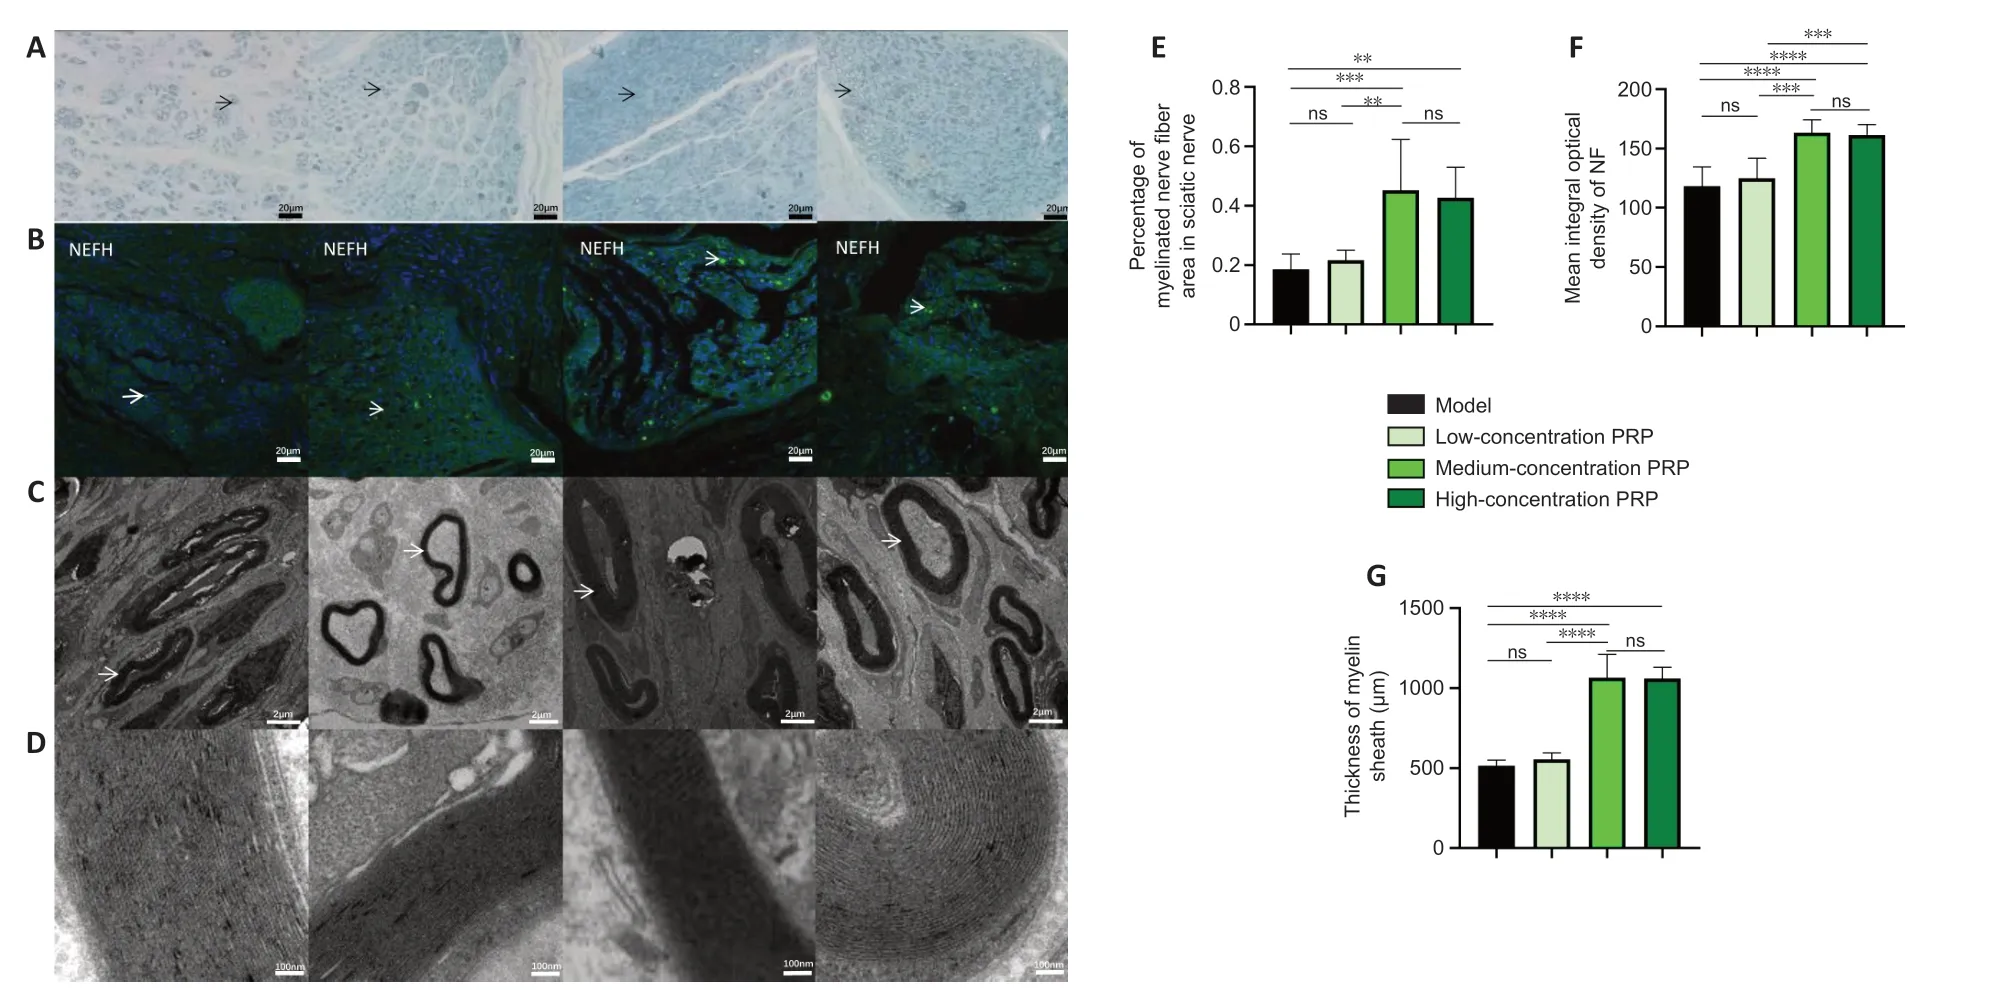
Figure 3|Effects of PRP on morphological recovery of regenerated nerves in rabbits with sciatic nerve injury. (A) Images of myelinated nerve fibers using toluidine blue staining. The percentage of myelinated nerve fibers in the medium- and high-concentration PRP groups was higher than that in the model and low-concentration PRP groups. Black arrows indicate myelinated nerve fibers. Scale bars: 20 µm. (B) Immunofluorescent staining of the NEFH (NF; green, stained by fluorescein isothiocyanate, white arrows). The presence of neurofilaments in the medium- and high-concentration PRP groups was significantly higher than that in the model and lowconcentration PRP groups. Scale bars: 20 µm. (C) Myelin sheaths of regenerated nerves observed by transmission electron microscopy. The white arrows indicate myelinated nerve fibers. Scale bars: 2 µm. (D) Lamellar structure of myelin sheaths. The thickness of the myelin sheath in the medium- and high-concentration PRP groups was greater than that in the model and low-concentration PRP groups. Scale bars: 100 nm. (E–G) Quantitative results of the percentage of myelinated nerve fibers (E), integral optical density of the neurofilament (F), and thickness of the myelin sheath (G). Data in E and F are presented as means ± SD (n = 7) and were analyzed by Tukey’s multiple comparison test. Data in G are presented as median and 95% confidence interval (n = 7) and were analyzed by Tukey’s multiple comparison test. **P < 0.01, ***P < 0.001, ****P < 0.0001. NEFH: Neurofilament heavy protein; NF: neurofilament; ns: not significant; PRP: platelet-rich plasma.

Figure 4|Effects of PRP on tricep recovery in rabbits with sciatic nerve injury.(A) Masson’s trichrome staining of triceps. Black arrows indicate muscle fibers, and green arrows indicate collagen fibers. The tricep myofibril composition ratios in the medium- and high-concentration PRP groups were significantly higher than those in the model and low-concentration PRP groups. Scale bars: 200 µm. (B) Quantitative results for the tricep myofibril composition ratios. (C) Bilateral tricep and tibialis anterior muscles. The injured side is on the right. The wet weight ratios of the triceps were significantly higher in the medium- and high-concentration PRP groups than those in the model and low-concentration PRP groups. Scale bars: 2 cm. (D) Quantitative results for wet tricep weights. Data are presented as means ± SD (n = 7). **P < 0.01, ***P < 0.001, ****P < 0.0001 (Tukey’s multiple comparison test). ns: Not significant; PRP: platelet-rich plasma.
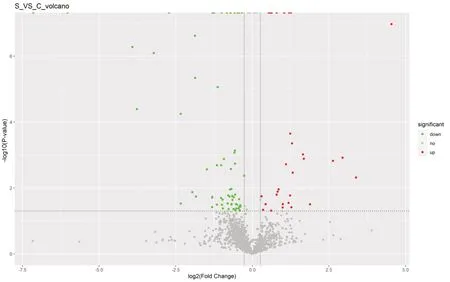
Figure 5|Label-free quantification analysis of protein expression changes after platelet-rich plasma treatment for sciatic nerve injury. In the volcano plot, the vertical coordinate shows the -log10 (P-value) value, and the horizontal coordinate shows the log2 (fold-change) value. The upregulated proteins reaching the threshold fold-change and P values are shown as red dots and the downregulated proteins are shown as green dots. The remaining proteins are shown as gray dots.

Figure 6|Hierarchical clusters of protein expression changes after platelet-rich plasma treatment for sciatic nerve injury. The horizontal coordinates represent the group names and the vertical coordinates represent the differentially expressed proteins. The red color indicates higher expression of the proteins, while the blue color represents lower expression. C: Model group; S: treatment group.

Figure 7|Gene ontology (GO) analysis of protein expression changes after plateletrich plasma treatment for sciatic nerve injury. The vertical axis shows the numbers of counts (the number of genes that matched the category), and the horizontal axis indicates the category.

Figure 8|The Kyoto Encyclopedia of Genes and Genomes (KEGG) pathways for protein expression changes after platelet-rich plasma treatment for sciatic nerve injury. The horizontal axis represents the fold-enrichment, and the vertical axis indicates the KEGG pathway. The color of the dot indicates the P-value. The size of the dot indicates the number of counts.
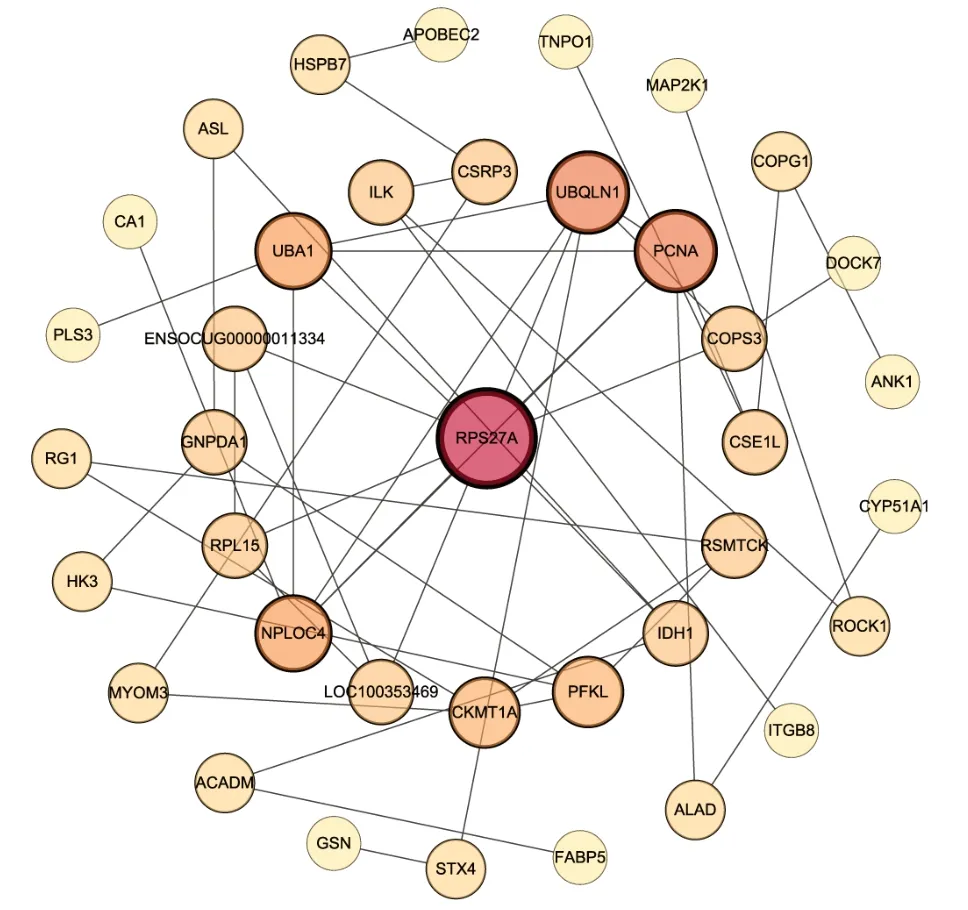
Figure 9|Protein interaction networks for all differentially expressed proteins after platelet-rich plasma treatment for sciatic nerve injury.The size of the circles represents the degree (number of adjacent links).
Discussion
Results from this study showed that PRP promoted the regeneration of the sciatic nerve in the medium- (4.5–6.5-fold PRP) and high- (7.5–8.5-fold PRP) concentration groups. Both the quality and quantity of regenerated nerve fibers were superior in the medium- and high-concentration PRP groups to those in the model and low-concentration PRP groups. Regeneration in the medium-concentration PRP group was not statistically different from that in the high-concentration group, and regeneration between the lowconcentration PRP and model groups was also not statistically different.
The electromyogram results showed that compound muscle action potential was detected in only one rabbit in the low-concentration PRP group, suggesting that low PRP concentrations still had a promotive effect on peripheral nerve regeneration even though the effect was limited. Therefore, the concentration of PRP plays an important role in tissue regeneration. It is very important to investigate the effects of different concentrations of PRP on peripheral nerve regenerationin vivo
. However, the majority of previous studies have been performedin vitro
. The effects of PRP on tissue repair depend on the type of tissue and the physiological environment in which it acts (Gentile and Garcovich, 2020), which variesin vivo
andin vitro
. For example, Zheng et al. (2016) reported that appropriate concentrations of PRP (2.5–20%) had a significant effect on the proliferation of Schwann cells and the synthesis of neurotrophic factorsin vitro
, whereas high concentrations of PRP (40%) inhibited these effects. Sowa et al. (2019) found that 5% PRP led to the most significant effects on proliferation, migration, and nerve growth factor (NGF) production in Schwann cells. In addition, Zhu et al. (2020) showed detailed differences betweenin vivo
andin vitro
conditions. In this latter study, four PRP concentrations were used (1.5×, 2.5×, 4.5×, 6.5×)in vitro
, and the results showed that the proliferation of Schwann cells and NGF synthesis were greatest at a PRP concentration of 4.5-fold, while the function of Schwann cells was severely inhibited at a PRP concentration of 6.5×. However, in thein vivo
study, the 4.5× and 6.5× PRP groups did not show significant differences in nerve crush injury repair.According to the proteomics analysis, the local application of PRP significantly increased the expression of integrin β-8 (ITGB8) and affected focal adhesion and the regulation of actin cytoskeleton in the cells, both of which are closely related. Focal adhesion involves specific binding between the cell and extracellular matrix, which results in bi-directional conduction of mechanical forces between the extracellular matrix and intracellular actin cytoskeleton (Sastry and Burridge, 2000). The assembly of many integrins depends on focal adhesion mechanical signal conduction, especially in the case of integrin α5β1 (Zuidema et al., 2020). The integrin family is composed of 24 different heterodimers, which are formed by different combinations of α and β subunits, among which integrin α7β1 is the receptor for laminin 2 in Schwann cells (Chernousov et al., 2007). Similar to α7β1, integrin α6β1 is a laminin-binding integrin required for axonal sorting in Schwann cells (Pellegatta et al., 2013). Integrin signaling is dependent on the non-receptor tyrosine kinase activity of the Src/focal adhesion kinase (FAK) complex, which initiates downstream signaling events through the complex and Shc-induced phosphorylation. Integrin-dependent FAK pathways play important roles in peripheral nerve growth and development as well as Schwann cell bioactivity. Grove et al. (2007) reported that FAK deficiency severely affected Schwann cell proliferation and myelin formation. In addition, FAK promoted the spread of immature Schwann cells and actin contractility of the basal lamina, thus enhancing cell proliferation and preventing their premature differentiation until they reached high density (Grove and Brophy, 2014). As a member of the integrin family of proteins, ITGB8 can recognize and bind to the intracellular αv subunit on the membrane surface to form the integrin αvβ8 protein, which is involved in cell adhesion and angiogenesis (Moyle et al., 1991). It has been shown that ITGB8 and activin receptor-like kinase 1 (ALK1) play important roles in maintaining normal angiogenesis in response to vascular endothelial growth factor in the brain (Ma et al., 2016). Vascular endothelial cells can interact with each other and form new blood vessels at the two severed ends of the nerve, and the new blood vessels lie in the same direction as the long axis of the nerve. Schwann cells can migrate along the new blood vessels forming Schwann cell cords (Cattin et al., 2015). Results of this study showed that the expression of ITGB8 in the treatment group was significantly higher than that in the model group. Therefore, it can be deduced that appropriate concentrations of PRP significantly contribute to the regulation of vascular regeneration in the process of nerve repair. Qin et al. (2016a, b) investigated the effects of concentrated growth factor on the biological behavior of Schwann cells and found that it promoted the migration of cells partly through the activation of the FAK pathway mediated by integrin β1.
RPS27A and UBQLN1 that were selected from the PPI network are involved in the pathogenesis of neurodegenerative diseases. RPS27A, a component of the 40S subunit of the ribosome, is a fusion protein consisting of an N-terminal ubiquitin (Ub) and the C-terminal ribosomal protein S27a (NCBI Resource Coordinators, 2017). RPS27 is cleaved by the cysteine protease UCHL1, which frees the Ub monomer and ribosomal protein S27A. UCHL1 is a deubiquitinating enzyme (Setsuie and Wada, 2007). The Ub terminus binds free Ub and maintains the homeostasis of intracellular Ub levels, and disruption of Ub homeostasis plays a key role in the physiology of various neurodegenerative diseases. A bioinformatics study from Khayer et al. (2020) showed that RPS27A may act as a switch gene that regulates interleukin-18 activation in microglial cells, which may trigger neurogenerative disorders. RPS27A has been suggested to be one of the key genes involved in the progression of Alzheimer’s disease (Gui et al., 2021).
Ubiquilin 1 is encoded by the UBQLN1 gene. To date, many studies have demonstrated the involvement of ubiquilin 1 in the pathogenesis of neurodegenerative diseases. For example, in Alzheimer’s disease, reduced ubiquilin 1 activity leads to an increase in the production of pathogenic fragments of the amyloid precursor protein, ultimately resulting in neuronal death (Stieren et al., 2011). Thus, ubiquilin 1 may play a central role in the synthesis and transport of the amyloid precursor protein (El Ayadi et al., 2013). Hiltunen et al. (2006) suggested that ubiquilin 1 acts as a cytoplasmic “gatekeeper” in the regulation of amyloid precursor protein trafficking from intracellular compartments to the cell surface. Because of the central role of ubiquilin 1 in the regulation of protein levels, it is a potential target for Alzheimer’s disease therapy and drug research (Takalo et al., 2013).
Various growth factors are released after PRP activation. IGF-1 regulates Schwann cell motility through the downstream activation of the phosphatidylinositol-3-kinase, small GTPase, and FAK pathways to promote remodeling of the actin cytoskeleton (Cheng et al., 2000). Therefore, IGF-1 is regarded as an important growth factor for peripheral nerve regeneration (Emel et al., 2011). Schumacher et al. (1993) reported that IGF-1 exhibited a strong stimulatory effect on mitogens of Schwann cells after binding forskolin or dibutyryl cyclic adenosine monophosphate. Ubiquilin 1 is regarded as an essential regulator of IGF receptors. In UBQLN1-deficient cells, although the number of IGF receptors is rapidly reduced, the overall activity of the IGF-1 receptor is significantly higher. Hence, cell viability is improved (Kurlawala et al., 2017).
RPS27A and UBQLN1 are associated with the regulation of the intracellular Ub system and are involved in maintaining the homeostasis of intracellular Ub levels. Therefore, it can be hypothesized that the cytokines released after PRP activation may promote peripheral nerve regeneration through the regulation of the intracellular Ub system. Further molecular biological experiments are needed to verify the specific mechanism by which PRP regulates the intracellular Ub system and investigate which growth factors in the PRP facilitate the most significant effects.
There were several limitations to this study. First, there was a single time point of only 12 weeks post-surgery. Thus, the dynamics of sciatic nerve regeneration in the rabbits and long-term prognosis were not evaluated. Second, there was no available method to evaluate the behavior of the rabbits. Third, the correlation between PRP concentration and prognosis was not well established. Correlation analysis between PRP concentration and histomorphological or electrophysiological assessment is still required. Fourth, further experiments should be designed to reveal the relevant mechanisms and determine whether intra-neural infiltration is better than extra-neural infiltration for PRP injection therapy in peripheral nerves.
As newer forms of bioactive substances are developed, the optimization of components for different tissues and cells will be needed to achieve robust regeneration. For neural tissue, it will be necessary to investigate the molecular mechanisms responsible for the effects of PRP on neural tissue and the effects of different bioactive factors in PRP preparations that may improve the efficacy of PRP-mediated neural tissue regeneration. Currently, there are few studies that have defined mechanisms by which PRP promotes peripheral nerve regeneration. Thus, proteomics analysis may provide a direction for further investigations of the various molecular pathways that may be involved. Exploring PRP mechanisms and analyzing the effects of various components of PRP during neural regeneration may allow optimization of PRP preparations and maximize its effect in the field of nerve repair.
Based on the above findings, it was concluded that (1) sciatic nerve regeneration was significantly higher in the medium- (4.5–6.5×) and high- (7.5–8.5×) PRP concentration groups than that in the low-PRP concentration (2.5–3.5×) and model groups. The overall effects of the 4.5–6.5× and 7.5–8.5× PRP concentrations on sciatic nerve regeneration were not statistically different. (2) Proteomics analysis revealed that PRP upregulated the expression of ITGB8, which significantly promotes angiogenesis during neural regeneration. Specifically, the enrichment of focal adhesion pathways was particularly significant, which may be considered the main mechanism for promoting neural regeneration. In addition, the differentially expressed proteins RPS27A and UBQLN1 are associated with the regulation of the intracellular Ub system. Therefore, it can be speculated that PRP may also have a significant effect on the level of intracellular Ub regulation, which is a topic that requires further investigation.
Author contributions:
Study conception and design: SLW, XLL; animal modeling and manuscript writing: SLW; electromyography: ZCK; manuscript revision and project administration: XLL, YSW; supervision: ZCK, YSW. All authors approved the final version of the paper.
Conflicts of interest:
The authors declare no conflicts of interest.
Availability of data and materials:
All data generated or analyzed during this study are included in this published article and its supplementary information files.
Open access statement:
This is an open access journal, and articles are distributed under the terms of the Creative Commons AttributionNonCommercial-ShareAlike 4.0 License, which allows others to remix, tweak, and build upon the work non-commercially, as long as appropriate credit is given and the new creations are licensed under the identical terms.
Additional files:
Model preparation, Auricular artery approached for blood collection, characterization of PRP, result of GO and KEGG, and statistical method.
Retrieval arguments.
GO and KEGG pathway analysis on protein expression changes after PRP treatment on sciatic nerve injury.
- 中国神经再生研究(英文版)的其它文章
- c-Abl kinase at the crossroads of healthy synaptic remodeling and synaptic dysfunction in neurodegenerative diseases
- The mechanism and relevant mediators associated with neuronal apoptosis and potential therapeutic targets in subarachnoid hemorrhage
- Microglia depletion as a therapeutic strategy: friend or foe in multiple sclerosis models?
- Brain and spinal cord trauma: what we know about the therapeutic potential of insulin growth factor 1 gene therapy
- Functions and mechanisms of cytosolic phospholipase A2 in central nervous system trauma
- Cre-recombinase systems for induction of neuronspecific knockout models: a guide for biomedical researchers