
Synchronous detection of multiple optical characteristics of atmospheric aerosol by coupled photoacoustic cavity
2022-06-29 08:53HuaWeiJin靳华伟RenZhiHu胡仁志PinHuaXie谢品华andPingLuo罗平
Chinese Physics B 2022年6期
关键词:罗平
Hua-Wei Jin(靳华伟) Ren-Zhi Hu(胡仁志) Pin-Hua Xie(谢品华) and Ping Luo(罗平)
1Key Laboratory of Environmental Optics&Technology,Anhui Institute of Optics and Fine Mechanics,Chinese Academy of Sciences,Hefei 230031,China
2Institute of Environment Friendly Materials and Occupational Health,Anhui University of Science and Technology,Wuhu 241000,China
3State Key Laboratory of Coal Resources in Western China,Xi’an University of Science and Technology,Xi’an 710054,China
4Mechanical Engineering School,Anhui University of Science and Technology,Huainan 232001,China
Keywords: spectroscopy,synchronous detection,coupling spectrum,coupled photoacoustic cavity
1. Introduction
With the development of society and economy, environmental pollution has been a serious threat to people’s physical and mental health. Therefore, it is urgent to understand the mechanism of environmental and atmospheric pollution.Atmospheric aerosol is an important factor affecting atmospheric oxidation,[1]regional pollution transport[2,3]and disease prevention and control.[4,5]It is very important to accurately measure the optical characteristic parameters of atmospheric aerosol,such as extinction coefficient,absorption coefficient and scattering coefficient. These optical characteristics have important effects on atmospheric radiation,environmental protection and occupational disease prevention and control.
In order to accurately detect the optical characteristic parameters of aerosols, the filter technology,[6]cavity ring-down spectrometer (CRDS),[7,8]photoacoustic spectroscopy(PAS),[9,10]cavity enhanced absorption spectroscopy(CEAS),[11,12]and laser induced fluorescence technology(LIF)[13,14]have emerged successively,and the extinction coefficient and absorption coefficient of aerosols have been measured by the above technologies. Among them,Chenet al.[15]developed a set of aerosol absorption coefficient measurement system by using photoacoustic spectroscopy technology, and successfully measured the aerosol absorption coefficient of the ambient atmosphere. Liuet al.[16]developed an aerosol optical absorption measuring instrument based on photoacoustic spectroscopy. The detection sensitivity of aerosol absorption coefficient at 532 nm reached 1.30 Mm-1. Liet al.[17]developed a cavity ring-down spectrometer with a minimum aerosol extinction coefficient of 6.10×10⁻⁷Mm-1. In view of the measurement of aerosol optical characteristic parameters,many methods have been used to conducted in-depth research,but most of them are single system of single parameter measurement.However,the existing multi-parameter synchronous detection technologies are greatly affected by sampling loss,cavity difference,detection source,and other factors,and there are technical problems such as inconsistent detection benchmark,unable to make accurate synchronous detection,etc.[18]Dialet al.[19]proposed an aerosol albedo meter that includes an attenuation chamber and an integrating sphere. The aerosol albedo meter can simultaneously measure the scattering coefficient and extinction coefficient of fixed frequency light,and then the relative measurement uncertainty of single scattering albedo can be obtained. The detection sensitivity of scattering coefficient and extinction coefficient are 2.70 Mm-1and 0.60 Mm-1, respectively. Sharmaet al.[20]conducted photoacoustic and scattering spectroscopic study of aerosol optical properties, and measured the aerosol absorption and scattering coefficients at five wavelengths(central wavelength 417 nm,475 nm,542 nm,607 nm,and 675 nm). Thompsonet al.[21]proposed a method of measuring aerosol single scattering albedo at 532 nm,in which mainly cavity ring-down spectrometer was used to measure aerosol extinction coefficient,and also adopted an integrating sphere turbid meter to measure aerosol scattering coefficient. The detection limits of extinction coefficient and scattering coefficient reached 0.61 Mm-1and 2.70 Mm-1, respectively. Ma and Thompson[22]developed an aerosol albedo meter with cavity ring-down spectrometer and integrating sphere,which was used to measure the extinction coefficient and scattering coefficient of particles in the near ultraviolet region.
The above-mentioned synchronous detection methods of optical characteristic parameters mostly involve direct measurement of scattering coefficient using integrating sphere as carrier, or using synchronous measurement of extinction coefficient and scattering coefficient, or absorption coefficient and scattering coefficient. However,there is still room for the improvement in the measurement of scattering coefficient by integrating turbid meter in terms of obtaining light scattering intensity and scattering information. Based on this, a spectroscopic system for the simultaneous measurement of aerosol absorption coefficient and extinction coefficient is developed based on two mature optical cavity techniques: photoacoustic spectroscopy and cavity ring-down spectrometer. In this way,the technical problems of the system sampling can be overcome, such as inconsistent detection benchmark, and failingto-implement synchronous and accurate detection.
2. Measuring principle
Photoacoustic spectroscopy is a detection method based on photoacoustic effect. When the molecule absorbs the light ofPpower and forms a heat source with periodic changes,the pressure in the measuring cavity changes periodically,and the sound signalSPAis stimulated.The photoacoustic signal is detected by a microphone(sensitivitySm),and the cell constantCcellis regarded as the inherent property of the photoacoustic cavity,and its value can be systematically calibrated by an object with a known absorption cross section. Therefore, the absorption coefficientαabsof aerosol can be expressed as[23]

The measurement principle of cavity ring-down spectrometer is based on Lambert Beer’s law. Optical resonators (with high reflection mirror seals at both ends)are used to increase the effective absorption path. When the incident light is coupled to the cavity,multiple reflections occur in the cavity,and the light intensity signal after having passed through the optical resonator decays exponentially. According to the length of optical resonatord, sample lengthLs, ring-down timeτ,background ring-down timeτ, and the speed of lightc, the relationship between the optical intensity ring-down time and the aerosol extinction coefficient can be established.[24]Therefore,the extinction coefficientαextof aerosol can be expressed as

3. Design of coupling cavity and system
3.1. Design of three-stage coupling cavity
The system of synchronously measuring the atmospheric aerosol absorption coefficient and extinction coefficient is mainly based on the coupling optical cavity composed of photoacoustic spectroscopy and cavity ring-down spectrometer. It adopts the same light source,optical path,gas path,frequency modulation,timing sequence and cavity. In this work,a threestage coupling cavity is designed, which is respectively composed of two sections of thin aluminum tubes and one section of thick aluminum tube connected end to end as shown in Fig.1. The thick aluminum tube is located in the middle,and two sections of thin aluminum tube are located at both ends.Purge holes and inlet and outlet holes are respectively arranged on the thin aluminum tube to construct the sampling air path of the system.

Fig.1. Three-stage coupled cavity.
The specific parameters of the three-stage cavity are shown in Table 1. The inner hole of the aluminum tube is uniform in size, specifically, 8 mm, which matches the beam diameter,and the overall length of the cavity after connection is 780 mm. Both ends of the optical resonator are equipped with high reflection mirror adjustment frame, which can not only adjust the high reflection mirror,but also support and fasten the photomultiplier tube(PMT).When adjusting the light path,the laser passes through the center of the high reflection mirror by adjusting the adjusting knob and the fixing screw,so as to achieve the effect of maximum reflection times. The maximum number of reflections is determined by measuring the residual light intensity with a photomultiplier tube and then fitting the ring-down curve.
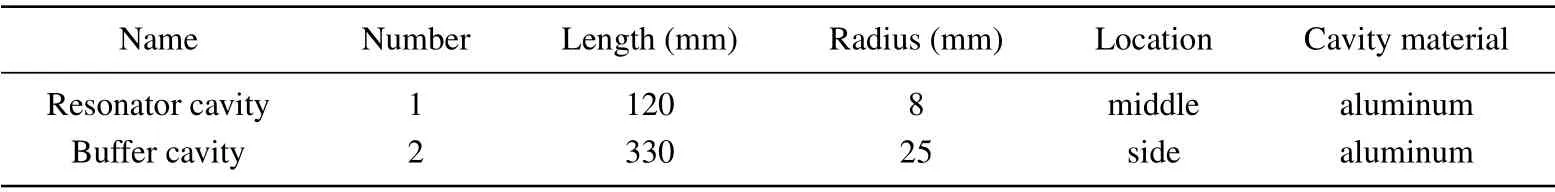
Table 1. Cavity parameters of coupling spectral measurement system.
3.2. Influence of buffer cavity on coupling photoacoustic system
Compared with the photoacoustic cavity, the coupling cavity has a length that is increased to match the cavity length of the cavity ring-down system. In order to study the influence of 330 mm buffer cavity on the coupling measurement system,an acoustic finite element model of the coupling cavity is established, and its simulation cloud image (the cavity was set as nitrogen)is obtained as shown in Fig.2. From the simulation results of the sound field distribution in the cavity,it can be seen that the middle part of the resonator cavity is the acoustic maximum position,and the sound pressure value decreases along the axis to both ends of the resonator cavity,and the closer to the two ends of the photoacoustic cell,the lower the sound pressure value is. It can be seen that the established coupling cavity has little influence on the sound field distribution of the photoacoustic system, and the microphone should be placed in the middle of the resonator cavity to collect the sound signal during measurement.

Fig.2. Coupled cavity acoustic mesh model and simulation cloud map: (a)coupled cavity finite element model,and(b)cloud image of coupling cavity acoustic simulation.
3.3. Design of coupling measurement spectrum system
The coupling measurement spectral system designed in this paper is shown in Fig. 3, which mainly includes 405-nm blue diode laser(DL-405),coupling measurement cavity,signal processing module and gas path system. The system is purged by pure nitrogen to protect the high reflection mirror,and the purging flow rate is 50 mL/min. The interference of large particles in the ambient atmosphere is filtered with a filter membrane,and the flow rate is controlled by a mass flow meter(CS200)to be 0.5 L/min. The ambient air is pumped into the coupling chamber by means of a small pump(N83KNE).The square wave modulated diode laser outputs 405 nm blue light at a specific frequency, which is reflected by the mirror and then enters into the coupling measurement cavity. The acoustic signal and light intensity signal of the coupled photoacoustic cavity are detected by microphone(MP201)and photomultiplier tube (H10721-210) respectively. The LabVIEW software collects the ring-down signal of light intensity output from photomultiplier tube in real time,and the lock-in amplifier(OE1022D)detects the signal of microphone in real time.The time constant of the PLL amplifier is set to be 3 s,the sensitivity 200 μV, the attenuation rate 12 dB, and the sampling time 1000 ms.

Fig.3. Schematic diagram of(a)coupled spectral measurement system and(b)real picture of coupled spectral measurement system.
4. Experimental results and discussion
4.1. Calibration of system
Because the aerosol has no obvious absorption peak, the NO2gas with known absorption cross section is used to calibrate the system. However,NO2gas molecules have a strong absorption peak near 403 nm,and water vapor and other interfering gases have no obvious absorption near 403 nm. Therefore,the 405 nm blue diode laser with rated power of 120 mW is selected as an excitation source of the system in this paper.By accurately controlling the mass flowmeter, 7 mg/m3NO2is diluted into 19.20 μg/m3, 48.10 μg/m3, 92.20 μg/m3,192.50 μg/m3, 384.90 μg/m3, and 577.40 μg/m3, respectively, and then passed into the system at a flow rate of 200 mL/min to record the value of photoacoustic signal.Combined with the specific absorption coefficient of NO2studied by Sharmaet al.[20]under the experimental conditions(293 K,101.325 kPa), the specific absorption coefficient of NO2is 195.28 Mm-1·(mg·m-3)-1, and then the calibration curve of the system can be obtained (pink line in Fig. 4). The slope after calibration curve fitting is 0.04368 μV/Mm-1,andR2is 0.998. According to Eq. (1), the constant number of cell is 300.24 Pa·cm·W-1. According to the Allan analysis of variance (red line in Fig. 4) of the system, the detection limit of absorption coefficient of the coupling photoacoustic spectrum system is 0.45 Mm-1in an average time of 1 min.
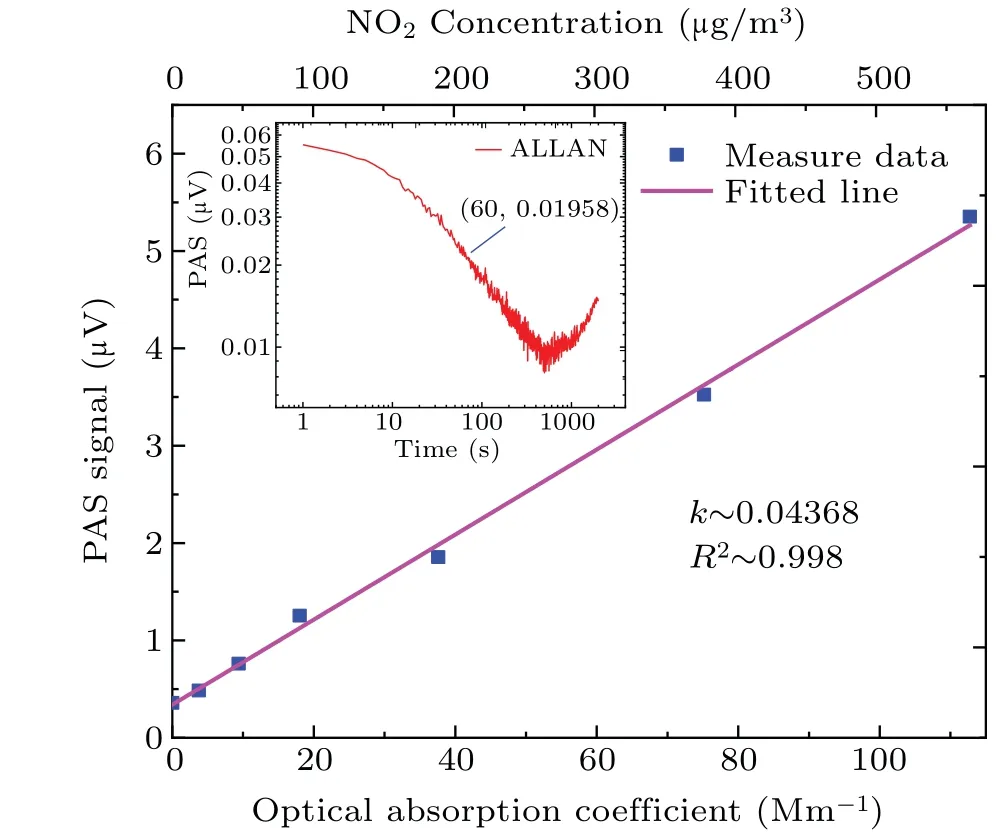
Fig.4. Calibration study.
For the coupling ring-down cavity,since the cavity lengthdis 780 mm and the sample lengthLsis 695 mm,so the ratioRLis 1.122. At a sampling frequency of 2.5 M,the ring-down timeτ0is 11.436 μs, then the lowest detection limit of the coupled ring-down cavity is
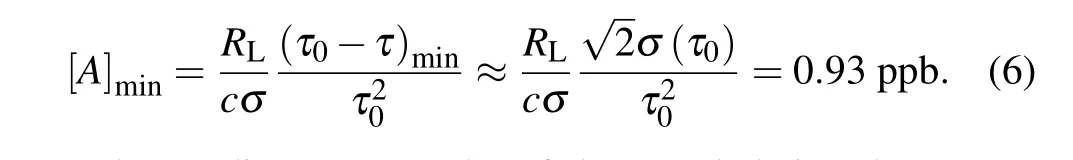
The gradient test results of the coupled ring-down cavity are shown in Fig.5. When standard sample gas separately with a volume fraction of 41.36 ppb, 90.18 ppb, 141.07 ppb and 192.25 ppb are introduced, the corresponding fluctuation of detected concentration separately is 0.63 ppb, 0.62 ppb,0.85 ppb,and 0.99 ppb. It can be seen that the linear gradient of the coupled ring-down cavity is good, and the correlationR2is close to 1. Combined with the experimental conditions(293 K,101.325 kPa)and Sharmaet al.’s study on the specific absorption coefficient of NO2, it can be seen that the specific absorption coefficient of NO2is 195.28 Mm-1·(mg·m-3)-1,so in an average time of 60 s, the detection limit of spectral extinction coefficient of coupling ring-down cavity is 0.11 Mm-1.

Fig.5. Ring-down cavity performance analysis.
4.2. Measurement of aerosol absorption coefficient and extinction coefficient
Using the system, we carry out the simultaneous measurement of atmospheric aerosol absorption coefficient and extinction coefficient at Dongpu reservoir(117°16′longitude,31°90′latitude)in Hefei from December 10 to 31,2019. The measurement results are shown in Fig.6. From December 15,2019 to December 29,2019,due to the heavy rain,in order to avoid rain affecting the experimental equipment,the windows were opened but left gaps, and the position of the sampling tube was changed from 1 meter away from the window to 15 cm away from the window, but the measured data during the rain were still environmental atmospheric data. The black line in Fig. 6 shows the aerosol extinction coefficient detected by cavity ring-down spectrometer system. The analysis shows that the aerosol extinction coefficient fluctuated greatly before and after the rainstorm,but the indoor aerosol extinction coefficient fluctuated less during the rainstorm. The overall amplitude ranged from 66.32 Mm-1to 537.87 Mm-1, the average value was 158 Mm-1,and the variance reached 78.89 Mm-1.The red line in Fig.6 shows the aerosol absorption coefficient measured by the photoacoustic spectrometer system. It can be seen from the analysis that it is relatively stable on the whole and affected by the rainstorm. Its amplitude range is from 30.90 Mm-1to 111.02 Mm-1,with an average value of 61.70 Mm-1and a variance of 7.71 Mm-1.

Fig. 6. Time series of aerosol extinction coefficient and absorption coefficient.

Fig.7. Influence of particle size and humidity on extinction coefficient: (a)Extinction coefficients of particles with different particle sizes, (b) extinction coefficients at different humidities.
In order to verify the influence of particle size on aerosol extinction coefficient,the relationship between aerosol extinction coefficient and particle size is studied by aerosol generator in laboratory environment. The required liquid is polystyrene microspheres (4205A), whose average diameter of standard microspheres is 5.027 μm±0.047 μm, and the density of microspheres is 1.05 g/cm3. By selecting generating liquids with different particle sizes,namely 1.6 μm,2 μm,5 μm,and 8 μm,and diluting them to specific concentrations by ionic water,the extinction coefficients of particles with different particle sizes at the same concentration are studied,and the results are shown in Fig.7(a). It can be seen from the figure that the extinction coefficient of particles increases with the increase of concentration. Heavy rain will affect air humidity. In order to further obtain the relationship between humidity and extinction coefficient,we use the humidity control system to investigate the humidity ratios of standard source gas,which are 0%,13.5%, 23.8%, 35.4%, 44.2%, 51.5%, 61.4%, and 86% respectively. The extinction coefficients under different humidities are observed as shown in Fig.7(b). As can be seen from the figure,extinction coefficient increases with the increase of humidity.
4.3. Analysis of aerosol single albedo
According to the measured aerosol extinction coefficient and absorption coefficient, the single time series of aerosol albedo can be calculated from Eq. (5), and the results are shown in Fig. 8. According to the figure, the aerosol single albedo during the observation period is relatively stable,ranging from 0.26 to 0.89,with an average of 0.56 and a variance of 0.13. The single albedo was maintained in a low range during the rainstorm,and the minimum value of single albedo was about 0.31 at 23:02 on December 27 2019. At this time, the proportion of aerosol absorption coefficient to extinction coefficient was relatively large, the ability of aerosol to scatter had a relatively large decline,and the air was relatively clean.After the rainstorm,the aerosol single albedo,extinction coefficient and scattering coefficient increased together,and gradually recovered to their values before the rainstorm.

Fig.8. Time series of aerosol single albedo.
4.4. Relationship between aerosol scattering coefficient and extinction coefficient
According to the measured aerosol extinction coefficient and absorption coefficient, the aerosol scattering coefficient time series during the observation period can be calculated from formula (4), and the results are shown in Fig. 9(a). As can be seen from the figure, the aerosol scattering coefficient during the observation period fluctuated greatly before and after the rainstorm,the overall amplitude range was 50.40 Mm-1to 459.97 Mm-1, the average value was 96.28 Mm-1, and the variance was 73.54 Mm-1. Figure 9(b) shows the correlation between aerosol extinction coefficient and scattering coefficient during the observation period. As can be seen from the figure,the correlationR2between aerosol extinction coefficient and scattering coefficient is 0.990,and the fitting slope is 0.96. It can be seen that the aerosol scattering coefficient contributes greatly to the extinction coefficient during the observation period.

Fig. 9. Aerosol scattering coefficients versus (a) time and (b) extinction coefficient.
4.5. Comparative study of data of environmental quality monitoring station
Because the atmospheric aerosol is a multiphase system,the particulate matter has a great influence on it, which can reflect the accuracy of the system detection to a certain extent. In order to understand the contribution of particulate matter to atmospheric aerosol and verify the accuracy of the system, the correlation between particulate matter and atmospheric aerosol extinction coefficient is studied. The monitoring data of PM2.5 and PM10 from the China air pollution quality monitoring station Hefei Dongpu reservoir station(117°16′longitude, 31°90′latitude) are adopted. The corresponding aerosol extinction coefficient and PM2.5 mass concentration time series during the observation period are shown in Fig.10,and the aerosol extinction coefficient and PM10 mass concentration time series during the observation period are shown in Fig.11.
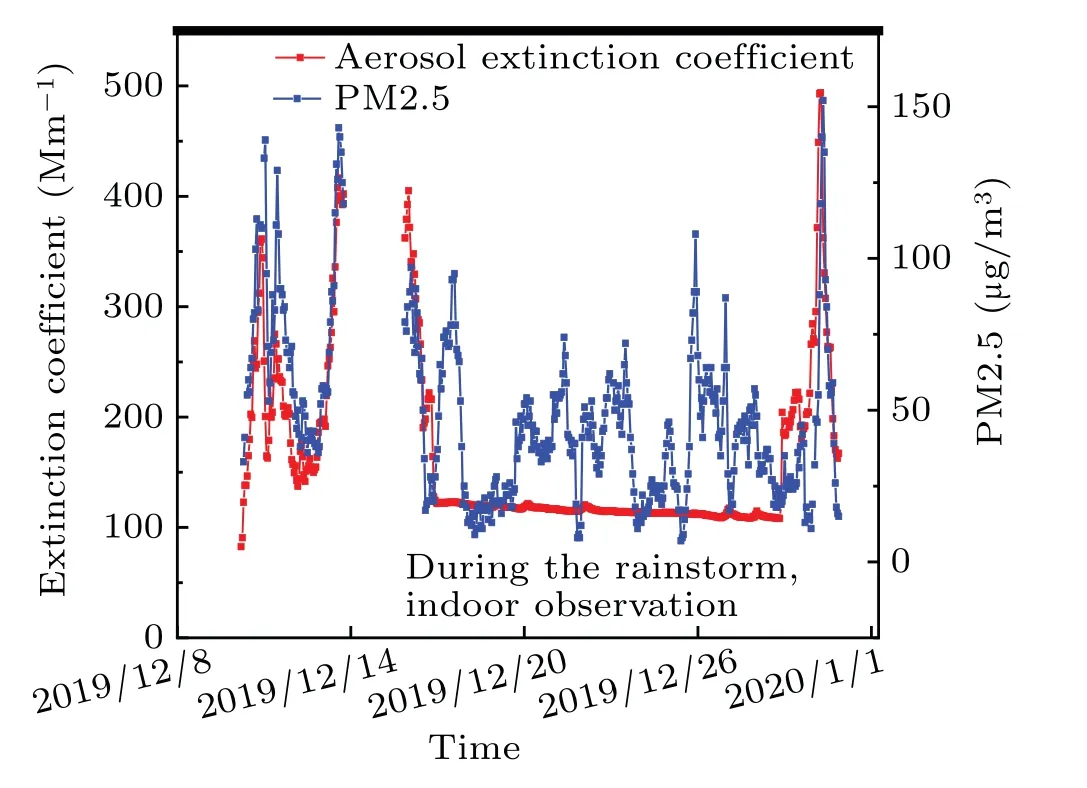
Fig.10. Time dependence of aerosol extinction coefficient and PM2.5.
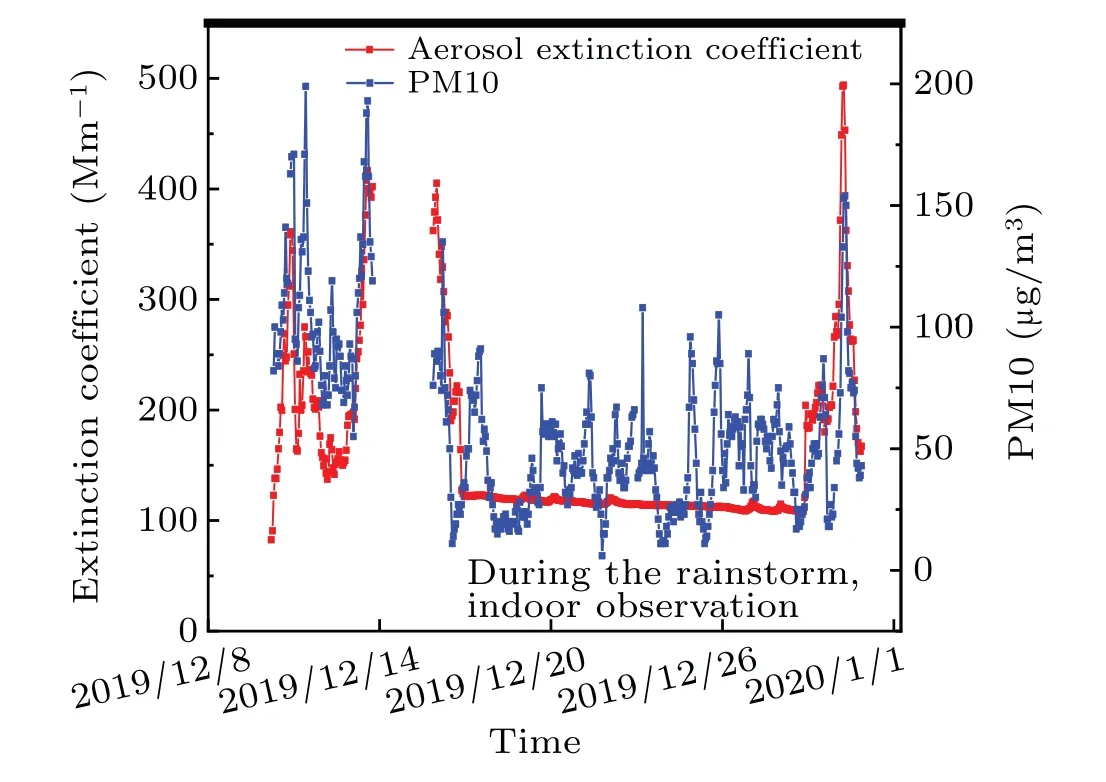
Fig.11. Time dependence aerosol extinction coefficient and PM10.
According to the figure,the mass concentration of PM2.5 ranges from 7 μg/m3to 152 μg/m3, the average value is 49.05 μg/m3and the variance is 27.98 μg/m3. The mass concentration of PM10 is in a range from 11 μg/m3to 199 μg/m3,with an average value of 59.74 μg/m3and a variance of 34.64 μg/m3. The variation trend of aerosol extinction coefficient before and after the rainstorm are consistent with those of PM2.5 and PM10,but the sampling difference is large. Therefore, the data before the rainstorm from December 10 to December 14 2019 are selected for correlation study,and the results are shown in Figs.12 and 13.

Fig.12. Variation of PM2 with aerosol extinction coefficient.

Fig.13. Variation of PM10 with aerosol extinction coefficient.
As can be seen from Figs. 12 and 13, the correlationR2between PM2.5 mass concentration and aerosol extinction coefficient is 0.683,the fitting slope 0.33,and the intercept 0.03.The correlationR2between PM10 mass concentration and aerosol extinction coefficient is 0.617, the fitting slope 0.34,and the intercept 31.75.Since PM2.5 and PM10 can reflect the mass concentration of fine particles and coarse particles in the ambient atmosphere during the observation period,the correlation between PM 2.5 and extinction coefficient,and between PM10 and extinction coefficient show that fine particles in the ambient atmosphere contribute more to extinction coefficient than coarse particles during the observation period.
5. Conclusions
Based on therequirements for simultaneous detection of multiple optical characteristics of aerosol, a new method of coupled cavity ring-down spectroscopy with photoacoustic spectroscopy is proposed in this work. The detection limits of photoacoustic spectroscopy absorption coefficient and extinction coefficient of cavity ring-down spectroscopy after coupling are 0.45 Mm-1and 0.11 Mm-1,respectively,which can meet the measurement requirements for atmospheric aerosol.The absorption coefficient and extinction coefficient of atmospheric aerosol are measured directly and the scattering coefficient and single albedo are calculated. Comparing with the data of environmental quality monitoring station, it can be concluded that the mass concentration of particulate matter has a great influence on the aerosol extinction coefficient,and the measurement results of the system prove accurate. This technique provides a new idea for the simultaneous detection of multiple optical characteristics of atmospheric aerosol.
Acknowledgements
Project supported by the Major Project of Natural Science Research in Universities of Anhui Province,China(Grant No.KJ2021ZD0052),the Open Foundation of Key Laboratory of Environmental Optics and Technology of Chinese Academy of Sciences(Grant No.2009DP1730652020-03),and the Research and Development Project of Wuhu Research Institute of Anhui University of Science and Technology,China(Grant No.ALW2020YF17).
猜你喜欢
奥秘(2022年10期)2022-12-06
奥秘(2022年9期)2022-10-15
奥秘(2022年8期)2022-09-02
奥秘(2022年7期)2022-08-09
奥秘(2022年5期)2022-05-31
奥秘(2022年4期)2022-04-26
中学生学习报(2022年1期)2022-03-21
中老年保健(2020年3期)2020-12-09
边疆文学(2020年5期)2020-11-12
中华诗词(2019年2期)2019-08-27
- Chinese Physics B的其它文章
- Ergodic stationary distribution of a stochastic rumor propagation model with general incidence function
- Most probable transition paths in eutrophicated lake ecosystem under Gaussian white noise and periodic force
- Local sum uncertainty relations for angular momentum operators of bipartite permutation symmetric systems
- Quantum algorithm for neighborhood preserving embedding
- Vortex chains induced by anisotropic spin–orbit coupling and magnetic field in spin-2 Bose–Einstein condensates
- Short-wave infrared continuous-variable quantum key distribution over satellite-to-submarine channels