
Influence of particle size on the breaking of aluminum particle shells
2022-08-01 06:02TianYiWang王天一ZhengQingZhou周正青JianPingPeng彭剑平YuKunGao高玉坤andYingHuaZhang张英华
Chinese Physics B 2022年7期
Tian-Yi Wang(王天一), Zheng-Qing Zhou(周正青),†, Jian-Ping Peng(彭剑平),Yu-Kun Gao(高玉坤), and Ying-Hua Zhang(张英华)
1School of Civil and Resource Engineering,University of Science and Technology Beijing,Beijing 100083,China
2Zhaojin Mining Industry Co.,Ltd,Zhaoyuan 265400,China
Keywords: aluminum particle,shell–core structure,thermal stress,shell-breaking
1. Introduction
Aluminum has attracted an intense interest over the years due to its high activity and high energy density in explosives and propellants.[1–6]Natural aluminum particles have a shell–core structure and are wrapped in a layer of amorphous alumina at room temperature.[7–11]Breaking the shell is a prerequisite for energy release. Therefore, mastering the shellbreaking mechanism is very important in order to study the ignition and combustion of aluminum powder.[12,13]
The crystal transformation of the alumina shell has an important effect on shell-breaking. Eisenreich[14,15]noted that the alumina shell undergoes a crystal transformation in a hightemperature environment, but the dynamic relationship between crystal transformation and the alumina shell has not been explained. Others have conducted more in-depth research into the relationship between crystal transformation and shell-breaking. Trunov[16–18]used x-ray diffraction(XRD)to study the crystal transformation of the alumina shell due to the heating process. It showed that the shell breaking is caused by the transformation of amorphous alumina intoγ-Al2O3(the new formedγ-Al2O3layer increases in density and decreases in volume,and cannot completely cover the aluminum core,resulting in shell breaking). However,the thermal stress caused by the different thermal expansion coefficients of the aluminum core and the alumina shell in a high-temperature environment has not been considered. Lipkin[19]also found that the transformation of the less-dense monoclinic crystal structureθ-Al2O3into the close-packed structureα-Al2O3is accompanied by a volume shrinkage of 10% and that this volume shrinkage during crystal transformation causes shell breaking.[20]Guo[21,22]used differential scanning calorimetry,thermogravimetric analysis and XRD to analyze the crystal transformation of aluminum powder at temperatures of up to 660°C. The experimental results showed that during this process, the crystal lattice arrangement, volume, and density of the alumina shell changed, leading to the destruction of the alumina shell and even shell breaking. Khan[23]also believed that crystal transformation was one of the main factors in shell breaking. Although crystal transformation is an important cause of shell breaking, its impact on shell breaking has not been quantitatively considered.
However, others hold different views on the main factors responsible for shell breaking. Levitas[24–26]believed that shell breaking was due to stress overload caused by the difference between the thermal expansion coefficient of the aluminum core (23.0×10⁻⁶) and that of the alumina shell(8.6×10⁻⁶). However,the influence of thermal stress on the shell-breaking process has not been quantitatively analyzed.Some researchers also studied the relationship between the thermal stress of aluminum particles and temperature. Dudi[7]used an in-situ transmission electron microscope(TEM)to estimate the relationship between thermal stress and the temperature of 100 nm aluminum particles by analyzing changes in lattice distance. However,since TEM cannot observe micronscale particles, his method of estimating stress cannot be applied to micron-scale aluminum particles. Overall, different scholars have different opinions about the shell-breaking mechanism of aluminum particles, and there is a lack of research that provides quantitative analysis of the thermal stress of aluminum particles in high-temperature environments.
It appears that the shell-breaking mechanism of aluminum particles is still unclear and that no one has quantitatively explained the reason for shell breaking from a mechanical point of view. Shell breaking is the result of a combination of temperature, particle size, environmental conditions, and other factors, and its process is complex and diverse. Earlier research has described the effect of temperature on shell breaking,but the effect of particle size on shell breaking has rarely been reported. Therefore, COMSOL was used to quantitatively study the causes of shell breaking and the effect of particle size on shell breaking from a mechanical point of view.
2. Finite element model
Figure 1(a) shows that a natural aluminum particle has a shell–core structure. The aluminum particles used in military and industrial applications are in the micron size range(10 μm–100 μm). To obtain an accurate structural model of the shell–core structure model,the shell thicknesses of 10 μm–100 μm aluminum particles were measured using the gas volume method,[27]as shown in Fig.1(b). Based on the results,a calculation model for aluminum particles was established, as shown in Fig.1(c).

Fig. 1. (a) Aluminum particle HR-TEM image. (b) Relationship between the particle size of a micron-scale aluminum particle and alumina shell thickness.[28] (c)Finite element model of the shell–core structure.
A solid heat conduction model and a solid mechanics model inside COMSOL are coupled into a multi-physics field for this research. The heat transfer and thermal expansion equations built into COMSOL are used as the control equations for aluminum and alumina,as shown below:

whereρis the density,CPis the constant pressure heat capacity,Tis the temperature,tis time,Qis the absorbed heat,∇is the Laplace operator, andkis the coefficient of thermal conductivity.
The thermal expansion control equation is

whereEthis the thermal strain,αis the coefficient of thermal expansion,T0is the initial temperature, andTis the current temperature.
The physical properties of aluminum and alumina are shown in Tables 1 and 2.
During the heating process, the alumina shell undergoes crystal transformation,which leads to a change of density.The crystal transformation of the alumina shell can be divided into four stages,[16]but in the temperature range of 0°C–650°C,only the first two stages of crystal transformation should be considered, as shown in Fig. 2. The thermal expansion coefficient of alumina (α) was corrected to indirectly realize the simulation of the crystal transformation process during the heating process. Here,αis modified as
whereαis the coefficient of thermal expansion andρAl2O3is the density of alumina.

Fig.2. Relationship between the density of alumina and temperature.

Table 1. Physical properties of aluminum.[2]

Table 2. Physical properties of alumina.[29]

Fig. 3. (a) The quality of the mesh. (b) Relationship between the time step and the reciprocal step. (c) The relationship between the number of iterations and the error of the solver.
In order to ensure the accuracy of the model, the mesh quality and the convergence of the model were verified, as shown in Figs. 3(a)–3(c). It can be seen from Fig. 3(a) that the overall quality of the mesh is good,and there are no cells with poor quality. Figure 3(b)shows that as the time step increases,the reciprocal step size tends to be stable and there is no growth fluctuation, indicating that the transient solver has better convergence.Figure 3(c)shows that the error of the heat transfer and solid mechanics solvers fluctuates in the range of 5×10⁻⁵–200×10-5,which is an acceptable error.
Dudi[7]usedin-situtechniques to analyze the relationship between aluminum lattice distances and temperature. The results showed that the maximum pressure of an aluminum core with a particle size of 100 nm at 600°C is 0.051 GPa. In order to verify the accuracy of the aluminum particle model, a model with the same particle size and alumina shell thickness parameters was established(the particle size was 100 nm and the thickness of the alumina shell was 4.6 nm). The simulation results show that the maximum pressure of the aluminum core at 600°C is 0.044 GPa. Compared with the experimental results,the error of the simulation results is 13.72%.
3. Results analysis
3.1. Heating process of micron-scale aluminum particles
The environmental temperature is 650°C,and the initial temperature of the aluminum particle is 0°C.Figure 4 shows the temperature distribution of a 100 μm aluminum particle over time.

Fig.4. Temperature distribution of a 100 μm aluminum particle at different time.

Fig.5. (a)Relationship between the minimum temperature of a 100 μm aluminum particle and time. (b)Relationship between the thermal stability time and the particle’s size.
The heating rate of the aluminum particle is a process that changes from fast to slow, as shown in Fig. 5(a). This is because as time increases,there is a decrease in the temperature difference between the inside of the aluminum particle and the environment. Figure 5(b)shows that the thermal stability time(the time required for the minimum temperature of the aluminum particle to reach 645°C)of 10 μm–100 μm aluminum particles is in the range of 0.15 μs–11.44 μs. The fitting relationship between the thermal stability time and the particle size is as follows:

wheretis the thermal stability time anddis the size of the aluminum particle.
3.2. Thermal stress of micron-scale aluminum particles
Figure 6 shows the compressive stress distribution of the aluminum particle.It can be seen from the figure that the maximum compressive stress of 20 μm–70 μm aluminum particles is concentrated on two lines of 45°and 135°.

Fig.6. Compressive stress distribution of aluminum particles with different particle sizes at 10 μs.
Figure 7(a) shows that the maximum compressive stress first increases slightly and then decreases rapidly, reaching a maximum at a particle size of 60 μm. This is because the maximum compressive stress is determined by the minimum temperature of the aluminum particles and the ratioRtogether. The lower the minimum temperature, the smaller the maximum compressive stress,and the greater the ratioR,the greater the maximum compressive stress. It can be seen from Fig.7(b)that when the particle size is less than 60 μm,the minimum temperature decreases slightly,while the ratioRincreases greatly. The increase in the ratioRhas a greater impact on the maximum compressive stress than the decrease in the minimum temperature. Therefore,the maximum compressive stress increases, reaching its maximum value at around 60 μm. When the particle size is 60 μm–100 μm, the minimum temperature decreases greatly, and the ratioRincreases relatively slowly. Therefore,the maximum compressive stress shows a downward trend,and the decline is extremely large.
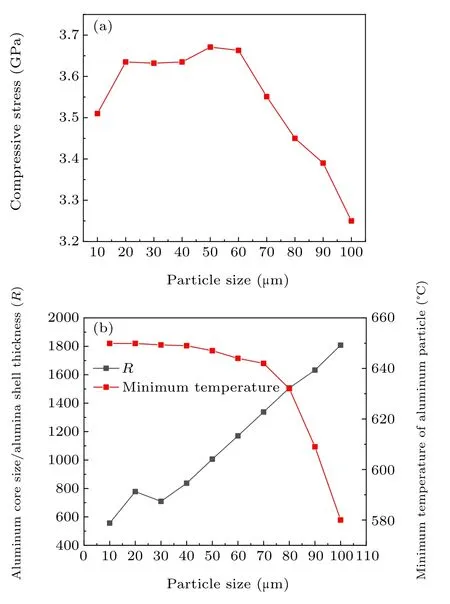
Fig.7. (a)The relationship between particle size and compressive stress. (b)The effect of the particle size on the ratio R and the minimum temperature of the aluminum particle.
In a high-temperature environment, the compressive stress of the alumina shell will change.The compressive stress arises from the expansion and extrusion caused by the different thermal expansion coefficients inside and outside the shell and the crystal transformation of the alumina shell. Figure 8 shows that the growth rate of compressive stress on the inner and outer surfaces gradually slows down and then stabilizes.However,the compressive stress on the outer surface increases slightly faster;this is because the change in compressive stress originates from the change in the temperature field.A distance corresponding to the shell thickness (about 50 nm) separates the inner surface and the outer surface,and it takes some time(less than 0.1 μs) for the temperature fields of the inner and outer surfaces to equalize. As the temperature fields stabilize, the compressive stress also tends to stabilize. This also proves that the change of compressive stress originates from the change in the temperature field. The ratioRis 556–1808 for particle sizes of 10 μm–100 μm. The larger the ratio, the greater the expansion extrusion effect.

Fig. 8. (a) Relationship between compressive stress on the inner surface of alumina shell and time. (b)Relationship between compressive stress on the outer surface of alumina shell and time.
Figure 9 shows the tensile stress distribution of aluminum particles with different particle sizes at 10 μs. It can be seen from Figs.6 and 9 that the extreme value for the distribution of the tensile stress is roughly the same as the extreme value for the distribution of the compressive stress.Figure 10 shows that when the particle size is less than 50 μm,the tensile stress first increases rapidly and then stabilizes;when the particle size is greater than 50 μm, the tensile stress first increases rapidly and then the growth rate slows down. This proves that both the tensile stress and the compressive stress originate from the change of the temperature field(the growth rate changes from fast to slow). It can be seen from Figs. 8 and 10 that with the change of particle size, the maximum compressive stress varies little,but the maximum tensile stress varies greatly.

Table 3. Comprehensive analysis of the structural response.
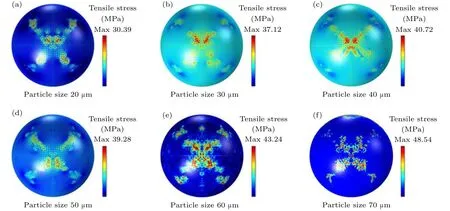
Fig.9. Tensile stress distribution of aluminum particles of different sizes at 10 μs.

Fig.10. (a)Relationship between tensile stress and time for the inner surface of alumina shell. (b)Relationship between tensile stress and time for the outer surface of alumina shell.
Table 3 shows the shell–core relationships of aluminum particles with different particle sizes, the shell-breaking response time for compressive stress, the shell-breaking response time for tensile stress,and the direct cause of the shellbreaking response. The tensile strength of alumina is between 35.5 MPa and 53.1 MPa.[30]In this paper, 35.5 MPa was used as the tensile strength of alumina,and the compressive strength of alumina is 2600 MPa.[31]The time required for the compressive stress to reach the compressive strength is the compressive stress shell-breaking response time. Similarly, the time required for the tensile stress to reach the tensile stress strength is the tensile shell-breaking response time.The smaller value of the two is the shell-breaking response time. Therefore,the shell-breaking response times of 10 μm–100 μm aluminum particles are in the range of 0.08 μm–2.69 μs.
Figure 11 shows the relationship between the shellbreaking response time and the particle size of the aluminum particle. The fitting relationship is as follows:

wheretis the shell-breaking response time (μs) anddis the particle size of the aluminum particle(μm).

Fig. 11. Relationship between particle size and the shell-breaking response time.
4. Conclusion
In this paper,the relationship between the thermal stability time,the shell-breaking response time,and the particle size was obtained. The conclusions are as follows:
(i)As the particle size of the aluminum particle increases,the thermal stability time does not follow a process of uniform growth, but a process that is fast and then slow. The thermal stability times of aluminum particles with particle sizes of 10 μm–100 μm are in the range of 0.15 μs–11.44 μs.
(ii)The direct cause of shell-breaking has an obvious relationship with the particle size, and there is a particle size boundary (80 μm): when the aluminum particle size is less than 80 μm,the direct cause of shell-breaking is compressive stress overload; when the particle size is between 80 μm and 100 μm,the direct cause is tensile stress overload.
(iii) As the particle size increases, the shell-breaking response time follows a pattern of initial rapid increase, then a slow increase, and finally stability. The breaking response times of aluminum particles with particle sizes of 10 μm–100 μm are in the range of 0.08 μs–2.69 μs.
Acknowledgment
Project supported by the National Natural Science Foundation of China(Grant No.11802160).
猜你喜欢
应用数学(2022年3期)2022-07-07
汽车实用技术(2022年10期)2022-06-09
电子乐园·下旬刊(2021年3期)2021-02-08
作文大王·低年级(2020年4期)2020-04-19
大观(2020年9期)2020-01-25
新高考·高一物理(2016年11期)2017-07-07
北京观察(2016年9期)2017-01-16
校园英语·下旬(2016年3期)2016-04-18
故事会(2015年19期)2015-05-14
故事林(2013年19期)2013-05-14

- Chinese Physics B的其它文章
- Real non-Hermitian energy spectra without any symmetry
- Propagation and modulational instability of Rossby waves in stratified fluids
- Effect of observation time on source identification of diffusion in complex networks
- Topological phase transition in cavity optomechanical system with periodical modulation
- Practical security analysis of continuous-variable quantum key distribution with an unbalanced heterodyne detector
- Photon blockade in a cavity–atom optomechanical system