
Theoretical and experimental study of phase optimization of tapping mode atomic force microscope
2022-08-01 06:02ZhengWei魏征AnJiePeng彭安杰FengJiaoBin宾凤姣YaXinChen陈亚鑫andRuiGuan关睿
Chinese Physics B 2022年7期
关键词:魏征
Zheng Wei(魏征), An-Jie Peng(彭安杰), Feng-Jiao Bin(宾凤姣), Ya-Xin Chen(陈亚鑫), and Rui Guan(关睿)
College of Mechanical and Electrical Engineering,Beijing University of Chemical Technology,Beijing 100029,China
Keywords: TM-AFM,phase image,excitation frequency,energy dissipation
1. Introduction
Since its advent,the atomic force microscopes(AFM)has become one of the nanoscale surface metrology tools used most widely.[1,2]An atomic force microscope is similar to an atomic-scale phonograph. Its core component is a microcantilever(phonographic arm)with a sharp tip(phonographic stylus).[3]The surface information can be obtained by transforming the interaction force between the tip and a sample into the displacement of the micro-cantilever tip.[4]As one of the most commonly used operational modes in atomic force microscope,the tapping mode(TM)can provide high-resolution images of a variety of samples,as well as greatly reducing the wear of the tip and damages to the samples in comparison with contact modes.[5]Therefore, tapping-mode atomic force microscopes(TM-AFM)are widely used in biomolecules,polymers,and nanoscale structures.[6–16]
As an element of TM-AFM, phase-imaging has greatly promoted the establishment of key nanoscale characterization methods of force microscopy in various material science fields.[4,17]By recording the phase shifts of microcantilever oscillations relative to the driving signals, the interaction characteristics of a heterogeneous sample can be plotted.[18]Phase-imaging has been used to study various material properties, such as capillary forces,[19]wettability,[20]and viscoelasticity.[21]In addition,owing to its wide and powerful applications, phase-imaging has consistently been a research hotspot in the relevant atomic force microscope.[22,23]
Phase images are used as supplementary information for topography in TM-AFM.In operational processes,various parameters in the control panels are adjusted to ensure the integrity and contrasts of the phase images. However,there are currently few theories to guide the adjustments of those parameters. Therefore,it is significant to study the factors affecting phase-imaging theoretically and experimentally.[21,24–28]The dependence of phase contrast on elastic interaction and inelastic interaction in TM-AFM have been investigated.[21]Some results have revealed the relationships between the phase images and the amplitude values of the free oscillationA0and the setpoint amplitudeASP.[24–26]Fasolket al. found that the selecting of the appropriate temperature levels for the phase scanning according to the characteristics of the samples can improve the phase contrast results.[27]Furthermore, a large number of studies have shown that energy dissipation is the key factor affecting the phase imaging of TM-AFM.[29–32]
Generally, there are various energy dissipations in TMAFM systems, including contact dissipation between the tip and sample, air viscous dissipation, squeeze film dissipation,and liquid bridge dissipation.[29,34–36]All of these dissipations will affect the phases of a system.In the present study,the contact dissipation between the tip and sample is of direct interest since it is considered to accurately reflect the properties of the samples. Meanwhile, the background dissipation masked the key dissipation, so that the real phase information of the sample is masked. Therefore, it is determined in this study that phase imaging can be successfully optimized by enhancing key dissipation or eliminating other irrelevant dissipations.
In this work, starting from the energy dissipation of the TM-AFM system, a theoretical model of the key factors affecting the phases is established. Then, through the analysis of the theoretical model, two ways to optimize the phase imaging are identified. The effects of the excitation frequency on a two-component blend are first studied both theoretically and experimentally. In this study it is proven both theoretically and experimentally that there exists an optimal excitation frequency that maximizes the phase contrast. In addition,by eliminating the background dissipation via a self-excitation method, the system is able to only reflect the key dissipation between the tip and the sample. As a result,only the real sample information is obtained and the phase contrast is improved to a certain extent.Furthermore,it is considered to be most advantageous to optimize the phase imaging of a two-component blend by considering a combination method of identifying an optimal excitation frequency and eliminating the background dissipation.
2. Factors affecting phases of TM-AFM
2.1. Phases and phase contrasts of TM-AFM
The key component of TM-AFM is a micro-cantilever with a sharp tip at the end which is very sensitive to small interaction forces. During its application,the micro-cantilever is oscillated at a frequency close to a resonance frequency while scanning a sample.[1]The tip contacts the sample intermittently, and information about the sample surface is obtained by monitoring the changes in the tip’s dynamic responses. In Fig. 1(a),ldenotes the length of the micro-cantilever,bthe width, anddthe thickness. The differential equation of the micro-cantilever under the interactions between the tip and sample is expressed as follows:
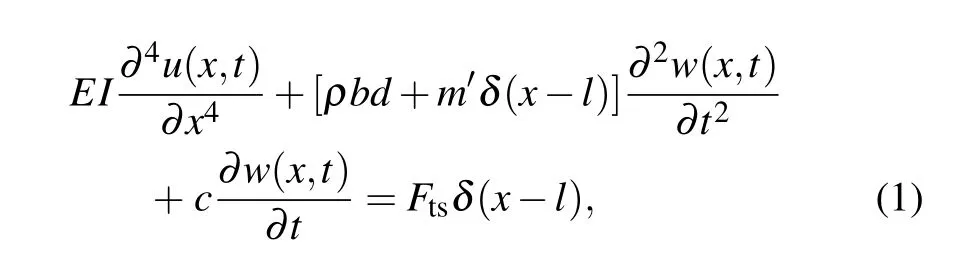
wherewrepresents the absolute displacement of the microcantilever,uthe relative displacement of the micro-cantilever relative to the substrate,EandIare the Young’s modulus and section moment of inertia of the microcantilever,respectively;ρindicates the density of the micro-cantilever,cthe equivalent damping coefficient per unit length of the micro-cantilever,m′the mass of the tip,Ftsthe interaction forces between the tip and the sample,andδ(xl)the Dirac function.
The term with equivalent damping coefficient (i.e., the last term on the left-hand side) in Eq. (1) is the dissipation term, which reflects the energy dissipation in the microcantilever system. As shown in Fig.1(a),the micro-cantilever has various energy dissipation paths when working in an atmospheric environment. From the perspective of phase imaging, there are two types of energy dissipation in the system.The first type is the contact dissipation between the tip and the sample, which can directly reflect the sample surface information,and this type of energy dissipation is referred to as the key dissipation. The other type of dissipation which does not reflect the surface information of the sample is termed the background dissipation.

Fig.1. (a)Schematic diagram of energy dissipation process in TM-AFM and(b)simplified model of micro-cantilever system in TM-AFM.
In the tapping mode, the movement of the microcantilever in the air will drag some of the medium with it.Part of the energy of the micro-cantilever is converted into the kinetic energy of the medium, and this part of energy loss is referred to as the air viscous dissipation.[33,37]Generally speaking, the quality factors of the micro-cantilever under high vacuum condition can reach hundreds of thousands.Meanwhile, in atmospheric environments, the quality factors of the micro-cantilever tend to be only several hundred.[38,39]Consequently, air viscous dissipation is one of the most important energy dissipations in the TM-AFM. For example, if the gaps between the micro-cantilever and the sample surfaces become smaller,the micro-cantilever will need to squeeze the medium out of the gaps.[40,41]The energy loss in these types of processes is named the squeeze film dissipation. In addition, when the gap between the tip and sample surface is smaller than a critical distance (approximately the length of the Kelvin radius), liquid bridge will be formed between the tip and the sample surface. When the tip leaves the sample surface, the liquid bridge breaks, during which time the liquid bridge fracture energy will be a dominant part of the energy dissipation.[2,34]In addition, a micro-cantilever system also has support dissipation due to the strain concentrating at the attachment points of the resonators, thermoelastic damping dissipation caused by phonon–phonon interactions, surface dissipation,etc.[42–45]However,owing to the fact that the above-mentioned dissipations exist in the system itself and do not reflect the sample information, they are put into the category of background dissipation in this study.The effects of the background dissipation on the phase and phase contrast results will be analyzed later.
In the TM-AFM, the piezoelectric actuator at the fixed end of the micro-cantilever drives the micro-cantilever through displacement excitation, which is expressed aszf=Dsinϖt.The absolute displacement of the micro-cantilever isw(x,t)=u(x,t)+Dsinϖt, and the differential equation of the microcantilever under displacement excitation is as follows:

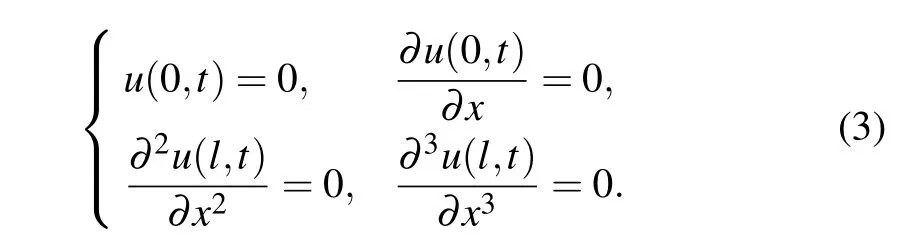
The boundary conditions of the micro-cantilever are given by
Therefore, according to the method of separating variables,there exists the following equation:

Substituting Eq. (4) into Eq. (2), for a linearized system ignoring damping and excitation, the general solution of the modal function can be obtained from the boundary conditions as follows:
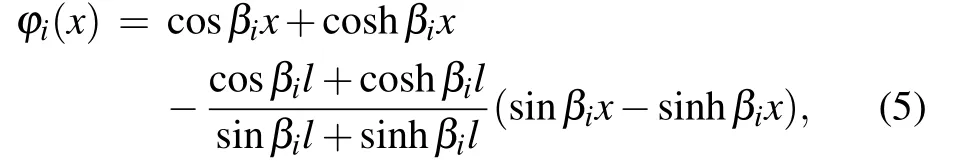
where
whereωiis thei-th natural frequency of the micro-cantilever.
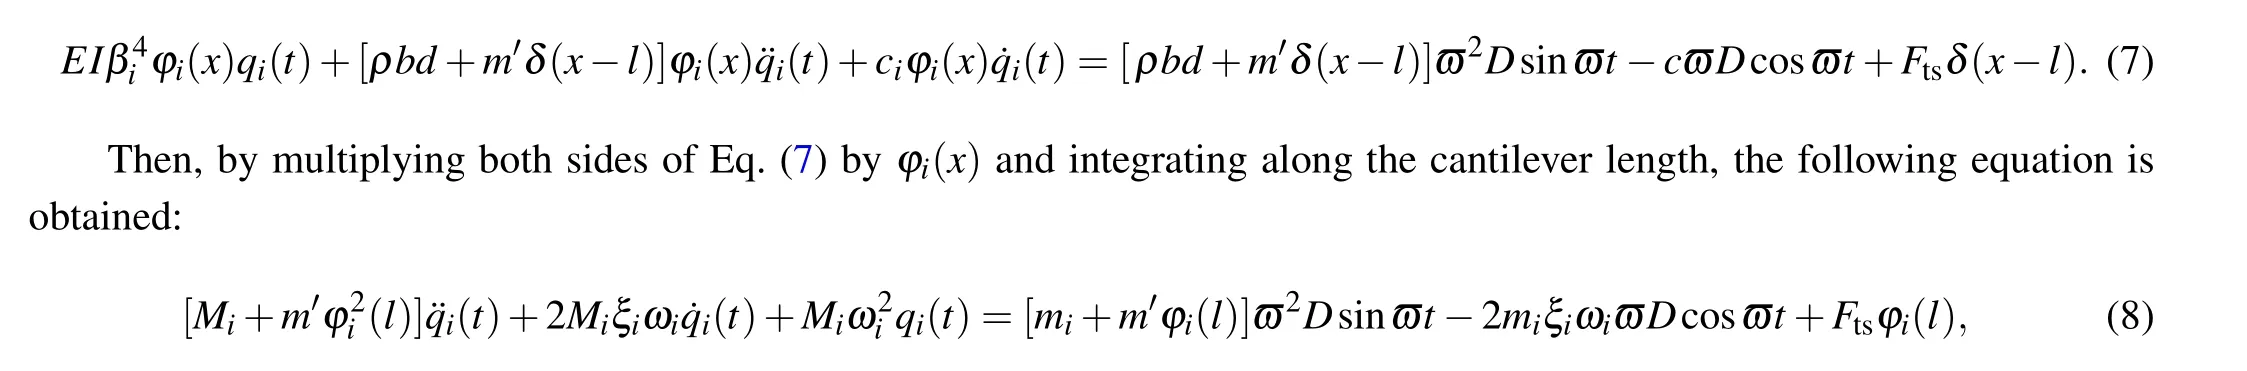
Subsequently, the following equation is obtained in this study by substituting Eq.(4)into Eq.(2):
where
and the relative damping coefficients of each orderξi=ci/2ρbdωi. The values ofφi(l),Mi, andmiare obtained from the modal functions and the parameters of the microcantilever. In this work, the time solution of the relative displacement can be solved by using Eq. (8), and the absolute displacement of the micro-cantilever is given as follows:
Therefore,by considering the first-order mode,whenx=l,the absolute displacement of the tip is obtained below

In the TM-AFM,the micro-cantilever vibrates at about its first resonant frequency.The sample surface is then imaged by monitoring the displacements at the tip of the cantilever. The steady-state responses of the tip are shown in Eq.(10). Therefore, the position of the tip and the first-order mode can be used to simplify the micro-cantilever. The interaction forces between the tip and the sample include nonlinear elastic forces and dissipative forces. As shown in Fig.1(b),for the tip equation of motion, a micro-cantilever which has been excited by displacement at its first natural frequency or close to it can be obtained from the following equation:[2,46]

wheremerepresents the effective mass, which is approximately one quarter of the total mass of the micro-cantilever;keis the force constant of the micro-cantilever;c0denotes the equivalent damping coefficient describing the background dissipation;zrepresents the instantaneous deflection of the tip;zf=Dsinϖtis the displacement excitation;Dindicates the excitation amplitude;andϖis the excitation frequency;hrepresents the instantaneous distance between the tip and the sample;Ftsrepresents the tip-sample interaction forces. The force between the tip and the sample is further simplified into a nonlinear elastic force and a viscous damping force,and the equation is expressed as follows:

wherectsrepresents the equivalent damping coefficient representing the contact dissipation between the tip and the sample;ktsis the elastic coefficient representing the conservative force between the tip and the sample. Previous studies have shown that the force between the tip and the sample has little effect on the natural frequency of the system.[41,47]Therefore,ktsis ignored in the present investigation. The equation which describes the TM-AFM is given as follows:w
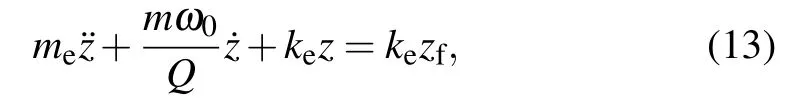
hereQ=meω/(c0+cts)is the total quality factor of the system,andω=(ke/me)-1/2represents the angular frequency of the first resonance. In this study,the quality factor represents the ratio of the total energy to the energy lost per oscillation of the micro-cantilever and is expressed as follows:[33,48,49]
whereWindicates the total energy stored in the microcantilever system, and ΔWrepresents the energy dissipated in each cycle of the micro-cantilever. Therefore, the energy dissipation of the system can be expressed by quality factor.As shown in Fig. 1(a), the total quality factor of the microcantilever system is expressed as follows:
whereQkeyis the quality factor representing the key dissipation between the tip and the sample;Qbgis the quality factor representing the background dissipation of the microcantilever system;Qviscousis the quality factor representing the viscous dissipation;Qsqueezeis the quality factor representing the squeeze film dissipation;Qbridgeis the quality factor representing the liquid bridge dissipation. Subsequently,the phase lag angle of the steady-state response obtained from Eq.(13)is
wheres=ϖ/ω0denotes the frequency ratio. Therefore, according to Eq.(15),the phase in Eq.(16)reflects not only the dissipation between the tip and the sample,but also the background dissipation of the micro-cantilever system. However,it is determined that the phase does not reflect the real phase information of the sample,but the distorted phase masked by the background dissipation.In this study,in order to obtain the real phase information of the sample,it is necessary to eliminate the background dissipation. The specific method adopted for the elimination of the background dissipation is presented in Subsection 2.3.
2.2. Effects of excitation frequencies on phase contrast results
In the TM-AFM, the phase images are obtained by detecting the phase lag angles of the tip at each position on the sample surface. The difference in phase lag angle between two different components on the sample surface is referred to as the phase contrast, which reflects the difference in sample surface property.The greater the phase contrast,the easier it is to distinguish the properties of a sample’s surface area. In the present investigation,according to Eq.(16),the phase contrast between two areas with different properties can be expressed as
whereQ1andQ2are the quality factors of the system when the tip is located at two areas with different properties,respectively.In this study,Q1is less thanQ2by default.Therefore,it can be seen from the above formula that whenQ1andQ2are determined,the phase contrast will be related to the excitation frequency. As a result, the phase contrast can be controlled and operated by using the excitation frequency.
In the TM-AFM operation process, the excitation frequency of the piezoelectric actuator is one of the most basic and easiest parameters to change. For example, it can be expected that a maximum phase contrast can be identified by selecting the optimal excitation frequency. As can be seen from Eq. (17) when the quality factors of the microcantilever system working in two areas with different properties are determined, the phase contrast will only be related to the excitation frequency. The excitation frequency corresponding to the maximum phase contrast can be obtained by calculating the extreme value of the above-mentioned expression of the phase contrast. Since an excitation frequency slightly smaller than the natural frequency is generally used in the operations, the corresponding frequency when the phase contrast is taken as a maximum value is

It can be seen from Eq.(18)that an excitation frequency to maximize the phase contrast exists in theory,which also explains why the excitation frequency is generally adjusted in order to obtain the best phase contrast in experimental processes.
In the present experiments,a Bruker dimension XR AFM is used to scan the surfaces of a blend of polystyrene and lowdensity polyethylene(PS-LDPE).The experiments are carried out by using a Tap AN-NSC10 probe at room temperature and a relative humidity of approximately 30%. According to the results of frequency sweep experiments,the natural frequency of the micro-cantilever system is approximately 188 kHz. The frequency ratio increases from 0.95 to 1 with equal intervals,and 11 groups of experiments are performed. The phase images corresponding to the different excitation frequencies are detailed in Fig.2.
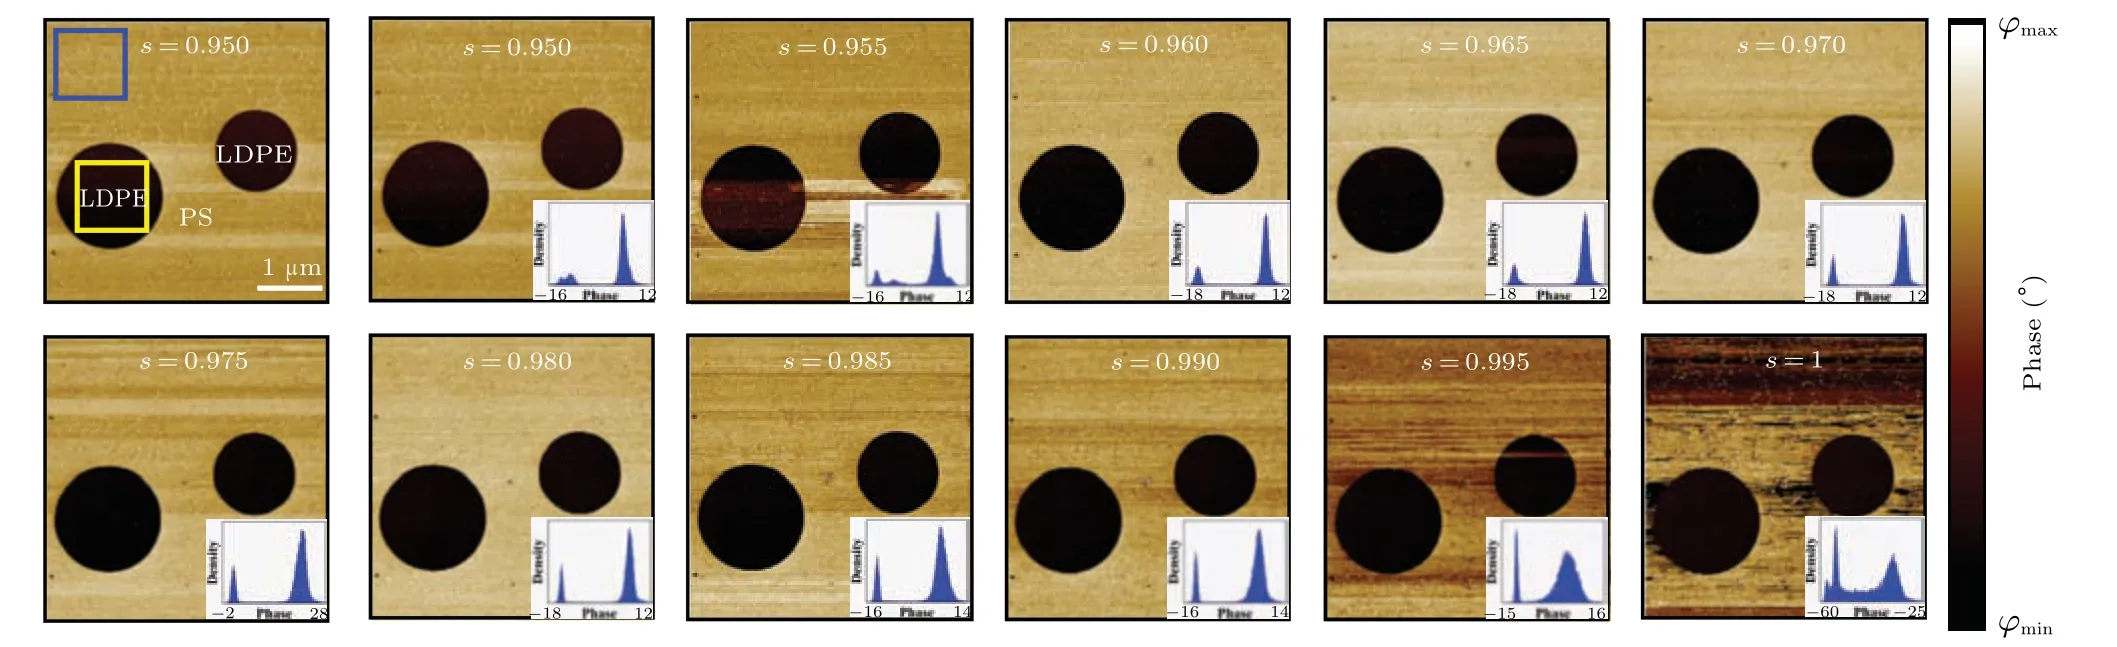
Fig.2. Phase images of PS-LDPE with different excitation frequencies,where white scale bar is 1 μm;total scan size is 4.5 μm×4.5 μm;sizes of the yellow box and the blue box are both 1 μm×1 μm;sample corresponding to the yellow box area is LDPE,and sample corresponding to blue box area is PS.Inset in lower right corner of each phase image shows distribution density of the data in the corresponding specific phase image.

Fig. 3. Normalized theoretical and experimental phase contrast results of PS-LDPE.
As shown in Fig.2,the characteristics of the sample can obviously be seen in the phase images, where the LDPE is represented by a black circular area, and the PS is located in the yellowish-brown background area. Owing to the fact that the properties of the PS and LDPE are very different, excellent contrast results are obtained in phase images at all frequency ratios.It is observed that when the frequency ratios are 0.955,0.995,and 1,there occur obvious scratched areas in the phase images due to the instability or interference effects of the micro-cantilever system. In Fig.2,the insets in the lower right corners of phase images show the corresponding distribution densities of the data in those specific phase images. In each inset,the horizontal axis represents the phase,and vertical axis the density of the phase data. The phases of the start position and end position of the horizontal axis correspond to the minimum phase and maximum phase on the scale on the right side of the figure, respectively. Generally speaking, the sharper the two peaks in the binormal distribution,and the farther apart from each other the two peaks,the greater the phase contrast is. However, since the phase contrast of each image cannot be perceived intuitively,it is necessary to quantify the phase contrast in each phase image.
It is determined from Eq. (18) that there is an optimal excitation frequency for maximizing the phase contrast. However,in order to prove this experimentally,the phase images at different frequency ratios are quantified. In this study the data in the blue box and yellow box,which are shown in Fig.2,are used respectively,and the method proposed in Refs.[50–52]is adopted to quantify the phase contrast. The statistical formula is given as follows:
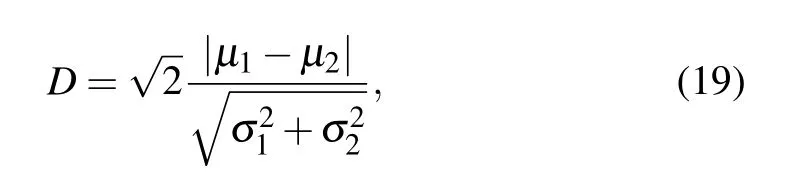
where Ashman’sDrefers to the phase image contrast;μ1andμ2represent the normal distribution means of the phases of the two components; andσ1andσ2are the standard deviations. The quantization results of the phase images with different frequency ratios are detailed in Fig.3.
It can be seen in Fig.3 that the theoretical curve fitted by Eq.(17)coincides exactly with the experimental results,which indicates that the theoretical description of the phase contrast in this study is in line with reality and reflects the essence of the phases in the TM-AFM. The experimental results are fitted using Eq. (17). The values ofQ1andQ2are 18 and 54,respectively. These represent the quality factors of the system when the tip contacts the PS and LDPE,respectively.Then,by substitutingQ1andQ2into Eq. (18), the theoretical optimal frequency ratio is determined to be 0.984. The experimental results show that there is an optimal frequency ratio(approximately 0.985)available to maximize the phase contrasts of the two areas with different properties, which is almost exactly consistent with the theoretical results.
Therefore, this study is able to select a certain number of frequency ratios near the natural frequency for the phase scanning processes,and then fit the experimental results using Eq. (17) in order to obtain the correspondingQ1(Qkey1) andQ2(Qkey2) of the two components of the blend, respectively.Subsequently, the optimal excitation frequency of the microcantilever system is theoretically determined. Then, the optimal excitation frequency obtained by the theoretical fitting is selected for the phase imaging process,and the phase images with the best contrast results are selected.
2.3. Acquisition of real phase information of samples
The phase image reflects all the energy dissipations of the TM-AFM system, including the background dissipation and the key dissipation. As shown in Fig. 1(a) and Eq. (15),in the atmospheric environment of this study, there are many background dissipations of micro-cantilever system, such as air viscous damping,squeeze film damping,liquid bridge dissipation. However, only the contact dissipation between the tip and the sample can accurately reflect the real information about the sample surface.It is found that the background dissipation can potentially reduce the phase contrast or even mask or distort the effective information in the phase images.Therefore,it is necessary to determine a method which only reflects the key dissipation and eliminates the effect of the background dissipation on phase contrast result.
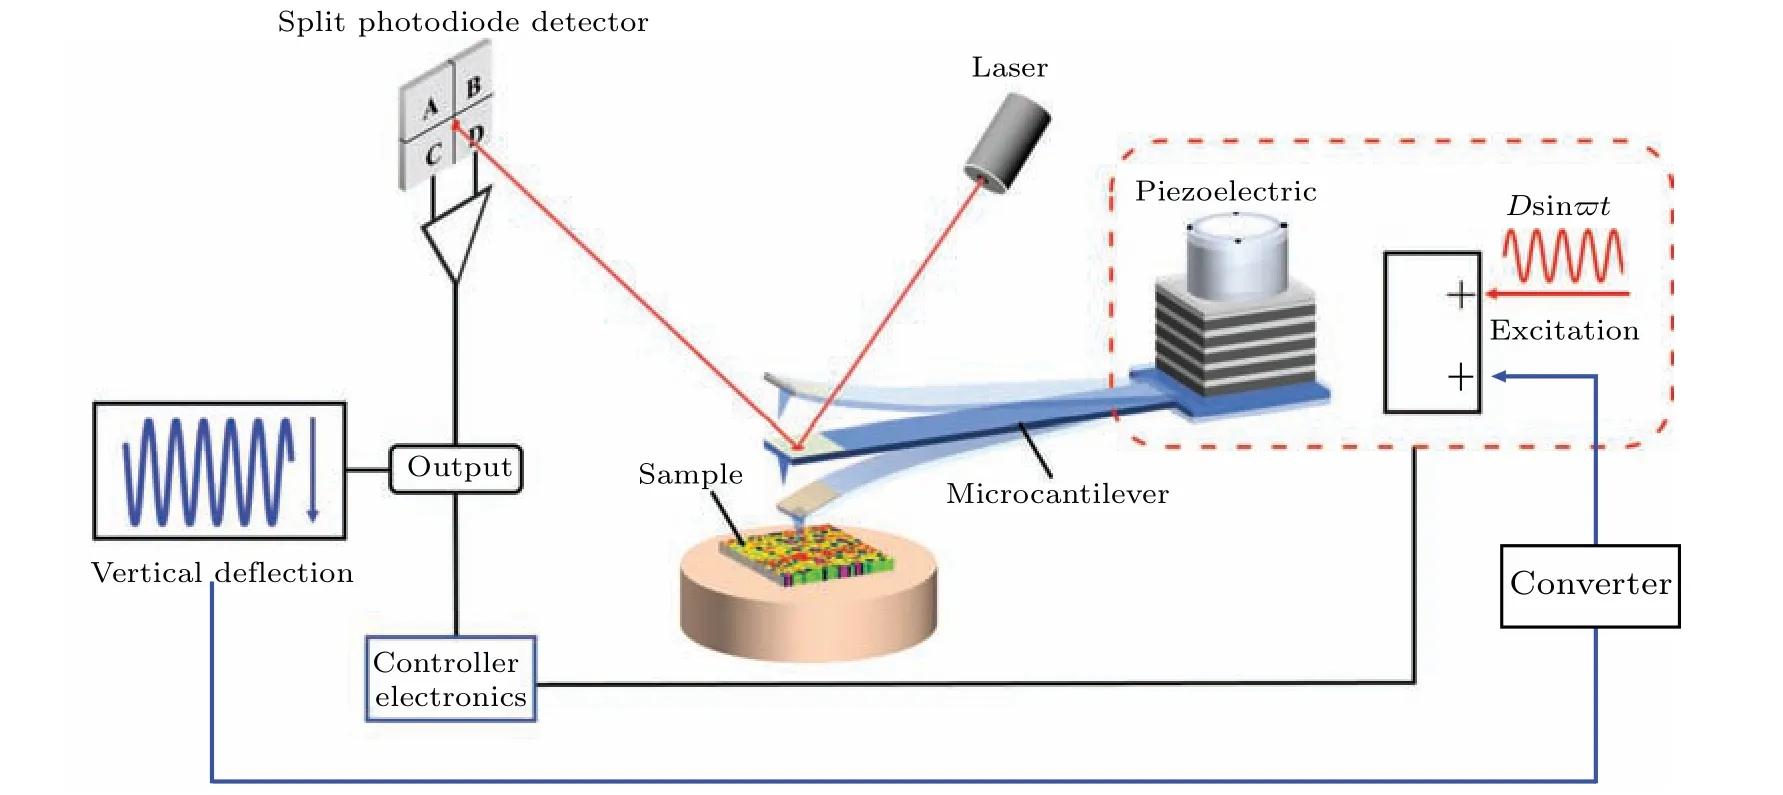
Fig.4. Schematic diagram of self-excitation method for TM-AFM.
Figure 4 shows the self-excitation method (also known as the Q-control)[53]in the TM-AFM.The micro-cantilever is excited jointly by the transformed tip response signals and the original excitation. The goal of this study is to offset the effect of the background dissipation on the phase contrast by using an effective compensation method. The general equation of the tip motion with self-excitation gain in the TM-AFM is expressed as[53,54]
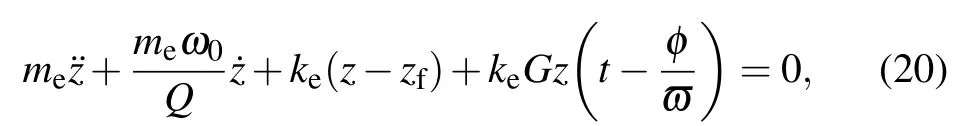
whereGis the gain factor of the self-excitation,andφdenotes the phase shift between the self-excitation signal and the instantaneous deflection. Therefore,whenφis taken asπ/2,the phase lag angle can be expressed as
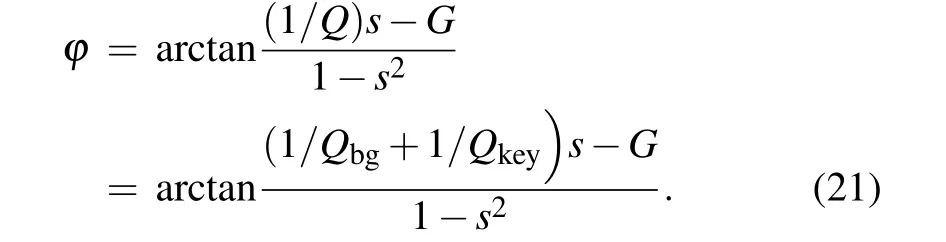
It can be seen from Eq. (21) that the background dissipation in the system can be reduced or eliminated by adjusting the gain factorG. When the gain factorG=s/Qbg,the background dissipation can be effectively eliminated. Figure 5 shows the phases at different gain factors,obtained using Eq.(21),whereQkey1andQkey2represent the key dissipation of the systems on two samples of different properties,respectively. In the figure, whenG=0, the relationship between the phase and the key dissipation without self-excitation is indicated. In addition,G=0.00197 shows that the background dissipation is just offset by the gain factor. WhenG=0.00788 andG=0.01970,it is determined that the gain factor has offset the background dissipation and reduced the key dissipation to a certain extent. In addition, Δφ1, Δφ2, Δφ3, and Δφ4represent the phase contrasts between two samples with different properties under different gain factors.
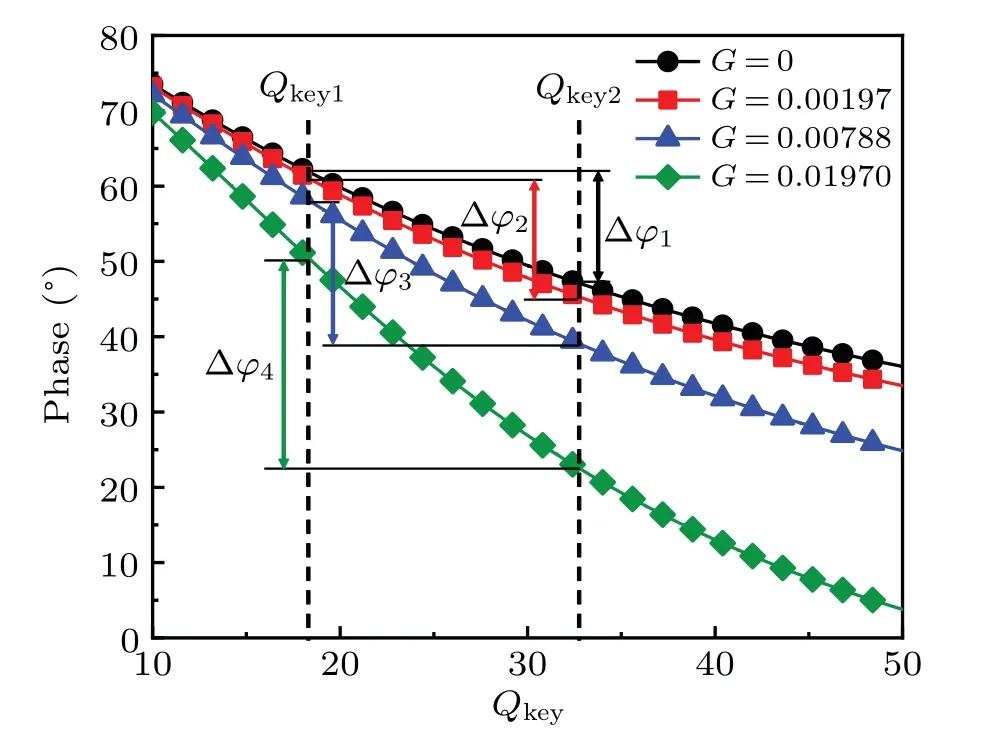
Fig.5.Curves of phase versus background dissipation for different gain factors,where frequency ratio is s=0.985,and quality factor Qbg representing background dissipation is 500, with different colors denoting phases under different gain factors.
The curves of phaseversusbackground dissipation for different gain factors are compared and the phase change rates increase with gain factorGincreasing, which are shown in Fig. 5. Therefore, whenQkey1andQkey2reflecting the key dissipations between the tip and the sample are determined,it can be observed that the phase contrasts of two components with different properties increase with gain factor increasing.That is to say, Δφ4>Δφ3>Δφ2>Δφ1. WhenG=0, the phases undergo the effect of background dissipation. WhenG=0.00197,it is indicated that the effects of the background dissipation on the phases are eliminated,and the phases reflect only the real core dissipation between the tip and the samples.Furthermore, whenG=0.00788 andG=0.01970, the gain factor offsets part of the key dissipation, and the phases and phase contrasts are both distorted. Incidentally, in the liquid environment,the quality factor of micro-cantilever is very low,usually only tens or even single digit,and the conventional tapping mode is very difficult to image in this environment.[30]Therefore,if the self-excitation method is used to eliminate the influence of background dissipation on phase, it is of significance in implementing the phase imaging of some living biological cells and biological macromolecules.Generally speaking, the eliminating of the background dissipation can eliminate its masking effects on the key dissipation and improve the phase contrast results to a certain extent. However, it should be noted that if the gain factor has an unreasonable value and thus offsets only part of the key dissipation, then the phase information will also be distorted. Therefore, based on this study’s results, it is necessary to select an appropriate value for the gain factor.
The quality factor of a micro-cantilever system oscillating in air can be obtained generally using frequency sweep in experiment. Figure 6 shows the curves of amplitudeversussweep frequency for different distances between the tip and the sample. It can be seen in the figure that the maximum amplitude of the curve decreases with the relative distance between the needle tip and the sample decreasing. In addition,the quality factor of the system also decreases with the relative distance decreasing. It is indicated that the decreases in the quality factor are caused by such factors as the squeeze film dissipation of the micro-cantilever and the liquid bridge dissipation of the tip when the micro-cantilever is close to the sample surface. It is observed that when the distance between the tip and the sample is further reduced, the frequency response curve is truncated.At that time,the quality factor of the system cannot be obtained by using frequency sweep in experiment. Since the truncation of the sweep frequency curve represents the contact between the tip and the sample,the sweep frequency curve before truncation reflects the background dissipation.

Fig.6.Curves of amplitude versus frequency for different distances between tip and sample.
A new method is proposed in this study in order to obtain the quality factor representing the background dissipation of the system. Multiple frequency sweeping experiments are performed near the sample surface for obtaining the approximate range of the quality factor representing the background dissipation. Figure 6 shows the experimental results about frequency sweep at different initial distances between the tip and the sample surface. As can be seen in the figure, when the tip is in“virtual”contact with the sample surface at the maximum displacement(for example, the tip is infinitely close to the sample surface but does not contact the sample surface or interaction between the tip and sample surface is very inconsiderable), the quality factor obtained from the frequency sweep experiment can be utilized as the reference value of theQbg.
In summary, the background dissipation is found to reduce the phase contrasts of the samples or even distort the phase information. Therefore, through the above-mentioned self-excitation methods,this study can obtain the phase information which includes only the key dissipation between the tip and the sample (in other words, the real phase information),thereby improving the phase contrast results of TM-AFM to a certain extent.
3. Conclusions
In this study, based on the dynamic model of TM-AFM,two factors affecting phase contrast are determined, and two optimization methods of the phases are proposed. An optimal excitation frequency proves both theoretically and experimentally to be available for maximizing the phase contrasts between the two components of the blend.Therefore,the optimal excitation frequency can be selected to optimize the phase contrast between the two components. Furthermore,the masking effect of the background dissipation on the phase information of sample surface is analyzed theoretically. A self-excitation method is utilized in this study to reduce or eliminate the effect of background dissipation on the phase, thereby reaching the goal of accurately reflecting the real phase information of each component. The results show that the elimination of the background dissipation can reflect the real phase information of the sample and improve the phase contrast between each component of the sample. The proposed method is applicable to optimizing not only the phases of the two-component blend,but also the phases of each component within multi-component sample.In addition,in this study a frequency sweep method of obtaining the background dissipation is proposed,thereby providing a reference for eliminating the background dissipation.The aforementioned method is considered to have both theoretical and experimental significance in optimizing the phase of TM-AFM.
Acknowledgement
Project supported by the National Natural Science Foundation of China(Grant No.11572031).
猜你喜欢
格言·校园版(2021年33期)2021-12-26
读书文摘(2020年10期)2020-11-23
读书文摘(2020年10期)2020-11-23
阅读与作文(小学高年级版)(2019年5期)2019-05-27
北广人物(2018年17期)2018-05-09
山海经(2017年5期)2017-04-08
前线(2015年7期)2015-05-14
阅读与作文(高中版)(2014年9期)2014-09-01
领导文萃(2009年14期)2009-10-14
文史月刊(2009年1期)2009-02-05

- Chinese Physics B的其它文章
- Real non-Hermitian energy spectra without any symmetry
- Propagation and modulational instability of Rossby waves in stratified fluids
- Effect of observation time on source identification of diffusion in complex networks
- Topological phase transition in cavity optomechanical system with periodical modulation
- Practical security analysis of continuous-variable quantum key distribution with an unbalanced heterodyne detector
- Photon blockade in a cavity–atom optomechanical system