
Gene and protein expression profiles of olfactory ensheathing cells from olfactory bulb versus olfactory mucosa
2022-08-08 02:11YuanXiangLanPingYangZhongZengNeerajYadavLiJianZhangLiBinWangHeChunXia
中国神经再生研究(英文版) 2022年2期
Yuan-Xiang Lan,Ping Yang,Zhong ZengNeeraj Yadav,Li-Jian ZhangLi-Bin Wang,He-Chun Xia
Abstract Olfactory ensheathing cells (OECs) from the olfactory bulb (OB) and the olfactory mucosa (OM) have the capacity to repair nerve injury. However,the difference in the therapeutic effect between OB-derived OECs and OM-derived OECs remains unclear. In this study,we extracted OECs from OB and OM and compared the gene and protein expression profiles of the cells using transcriptomics and non-quantitative proteomics techniques. The results revealed that both OB-derived OECs and OM-derived OECs highly expressed genes and proteins that regulate cell growth,proliferation,apoptosis and vascular endothelial cell regeneration. The differentially expressed genes and proteins of OB-derived OECs play a key role in regulation of nerve regeneration and axon regeneration and extension,transmission of nerve impulses and response to axon injury. The differentially expressed genes and proteins of OM-derived OECs mainly participate in the positive regulation of inflammatory response,defense response,cytokine binding,cell migration and wound healing. These findings suggest that differentially expressed genes and proteins may explain why OB-derived OECs and OM-derived OECs exhibit different therapeutic roles. This study was approved by the Animal Ethics Committee of the General Hospital of Ningxia Medical University (approval No. 2017-073) on February 13,2017.
Key Words: biological process; cellular component; gene; Gene Ontology; Kyoto Encyclopedia of Genes and Genomes; molecular function; olfactory bulb; olfactory ensheathing cells; olfactory mucosa; protein
Introduction
Olfactory ensheathing cells (OECs) are a unique type of glial cell characterized by their lifelong nerve regeneration function. They secrete a variety of neurotrophic factors and neural adhesion molecules. OECs share similarities with Schwann cells and astrocytes (Barnett,2004),and although OECs and Schwann cells are particularly similar,OECs have some unique characteristics. OECs exist in the peripheral nervous system (as with Schwann cells) and in the central nervous system (as with astroglia). The olfactory mucosa (OM) can regenerate throughout life,including in humans; however,the specific mechanism of regeneration,and how this process may involve OECs,are not yet clear. OECs stimulate axon growth and cell migration in a stronger manner than Schwann cells (Ramón-Cueto et al.,1998). Astrocytes have a beneficial effect on neuron survival and axon growth; transplanted OECs also wrap around neurons to form myelin sheaths that support the growth of nerve processes after a nerve defect (Devon and Doucette,1992; Gu et al.,2019). These characteristics make OECs one of the best choices for the treatment of neurological diseases and injury (Abdel-Rahman et al.,2018; Kim et al.,2018; Yao et al.,2018; Reshamnala et al.,2020; Yang et al.,2020; Wang et al.,2021).
OECs used in research are usually derived from the olfactory bulb (OB) (Franssen et al.,2007),although harvesting OECs from the OM is easier in clinical practice (Miedzybrodzki et al.,2006). Previous studies have shown that OB-derived OECs and OM-derived OECs have many similar and different functions (Richter et al.,2005; Bergström et al.,2007; Wang et al.,2014; Smith et al.,2020). Guérout et al. (2010) found relatively large differences in expression of many genes related to wound repair and nerve regeneration in the two cell types. OECs from the OB and the OM can repair nerve injury (Gu et al.,2017). However,the difference in the therapeutic effect between OB-derived OECs and OM-derived OECs remains unclear. Therefore,we hypothesized that OB-derived and OM-derived OECs will differ in protein expression levels. In this study,we used current,well-established transcriptomic and proteomic techniques to explore differences between OECs from OB and OM. We explain why OECs from OB and OM have different therapeutic effects,which should provide a new theoretical basis for future clinical treatments.
Materials and Methods
Isolation of OECs by cell culture
This study was approved by the Animal Ethics Committee of the General Hospital of Ningxia Medical University (approval No. 2017-073) on February 13,2017. All experimental procedures described here were in accordance with the National Institutes of Health Guidelines for the Care and Use of Laboratory Animals (National Institutes of Health Publication No. 85-23,revised 1996). The experimental animals were subjected to all operations under anesthesia,and every effort was made to minimize their pain and suffering.
Ten 1-week-old Institute of Cancer Research (ICR) mice,weighing 7 ± 0.5 g,were provided by the Animal Experiment Center of Ningxia Medical University,license No. SCXK (Ning) 2015-0001. The mice were deeply anesthetized by 5% isoflurane (Cat# 217190101,RWD,Shenzhen,China) inhalation and were then decapitated. The skull was peeled off quickly from the foramen magnum of the head of the mouse to fully expose the medulla oblongata,cerebellum,cerebrum and OB to ensure the integrity of the OB. The OB on the posterior side of the nasal septum and the OM on the epithelial surface were quickly separated and placed in cooled phosphate buffered saline (PBS; Cat# 8120062,Thermo Fisher Biochemical Product (Beijing) Co. Ltd.,Beijing,China) on ice. The OB and OM surfaces were gently washed three times to remove excess blood. Each tissue type was cut carefully with ophthalmic scissors,ground with a micropipette and placed into a tube. The OB and OM samples were incubated at 37°C for 20 minutes with 0.1% trypsin (Cat# 12604021,Thermo Fisher Scientific,Grand Island,NY,USA). After addition of culture medium consisting of Dulbecco’s modified Eagle medium/nutrient mixture F12 medium (Cat# 2186850,Thermo Fisher Scientific),10% fetal bovine serum (Cat# 1048791,Biological Industries Israel,Kibbutz Beit-Haemek,Israel) and 1% penicillin-streptomycin liquid (Cat# P1400,Solarbio,Beijing,China),the OB and OM samples were centrifuged at 800 ×gfor 5 minutes,the pellet was resuspended in fresh culture medium and the samples were centrifuged again at 800 ×gfor 5 minutes. After removal of the supernatant,the samples were again resuspended in culture medium and filtered with a 200-μm mesh filter to obtain uniform cell suspensions. The cells were seeded in six-well plates (Cat# 031819AA01,Wuxi NEST Biotechnology Co.,Ltd.,Wuxi,China) at 1 × 10⁶cells/mL/well,and the six-well plates were incubated at 37°C and 5% CO2. After 18 hours of incubation,the cell suspensions were centrifuged at 800 ×gfor 5 minutes,the pellets were resuspended in fresh culture medium and incubated in new sixwell plates for 24 hours. The cell suspensions were centrifuged again at 800 ×gfor 5 minutes,then seeded in six-well plates coated with poly-L-lysine (Cat# RNBD4661,Sigma-Aldrich,St. Louis,MO,USA) for 48 hours of incubation. The cells were separated by the modified Nash differential adhesion method (Peng et al.,2009),and finally,purified OB and OM cells were obtained,as previously described (Choi et al.,2008; Wang et al.,2014; Yao et al.,2018). The culture medium for the primary cells was refreshed every 2 days. When cells reached 80% confluence,they were collected for future experiments.
Identification and Purification of OECs
On day 1,OB and OM cells grown on slides (Cat# 10210008CE,CITOTEST,Haimen,China) were washed three times with PBS for 3 minutes each time,fixed with 4% paraformaldehyde for 15 minutes and rinsed three times with PBS for 3 minutes each time. The cells were permeated with 0.5% Triton X-100 in PBS (T8200,Solarbio) for 20 minutes at room temperature,and the slides were immersed in PBS three times for 5 minutes each time. The PBS was removed using absorbent paper,and the slides were treated with 5% bovine serum albumin blocking solution (SW3015,Solarbio) at room temperature for 30 minutes. After removal of blocking solution with absorbent paper,without washing,the slides were treated with the primary antibodies neurotrophin receptor 2% P75 in PBS (rabbit,1:50,Cat# ab52987,Abcam,Cambridge,UK) and 1% S100 in PBS (rabbit,1:100,Cat# ab52642,Abcam) and incubated overnight at 4°C in a humid box. On day 2,the slides were soaked in PBS three times for 3 minutes each time. After removal of excess liquid,the slides were treated with the diluted fluorescent cross-absorbed secondary antibodies Alexa Fluor 594 (goat anti-rabbit,1:200,Cat# A-21203,Invitrogen,Eugene,OR,USA) and Alexa Fluor 488 (goat anti-rabbit,1:200,Cat# A-21202,Invitrogen) in the dark at 37°C for 1 hour,then washed with PBS three times for 3 minutes each time. After 4′,6-diamidino-2-phenylindole (DAPI; Cat# D9542,Sigma-Aldrich) was added dropwise,slides were incubated in the dark for 5 minutes to stain the cells. PBS was used to wash away excess DAPI. After removing the liquid with absorbent paper,the slides were sealed with antifading mounting medium (Cat# 20181130,Solarbio) and observed under a fluorescence microscope (IJ21181; Olympus,Tokyo,Japan). Five fields of view were randomly selected under the microscope to count cells. The total number of nuclei was counted. The number of P75- or S100-positive cells and the number of cells with nuclei co-stained with DAPI were counted. Purity of OECs (%) = (P75-positive + DAPI-positive cells,or S100-positive + DAPI-positive cells)/DAPI-positive cells × 100.
RNA preparation
For RNA samples,the culture medium was removed when cells were at 80% confluence,and cells were lysed in an appropriate amount of TRIzolTMreagent (Cat# 15596026,Thermo Fisher Scientific) and stored in 1.5 mL RNase-free tubes at -80°C. For protein samples,cells at passage 3-5 were washed with cold PBS three times,scraped into centrifuge tubes and centrifuged at 800 ×gat 4°C for 5 minutes. After supernatant removal,each tube opening was sealed with a sealing membrane,and the tubes were stored at -80°C.
RNA quality determination
RNA purity was determined using a K5500® spectrophotometer (Kaiao,Beijing,China). RNA integrity and concentration were assessed using the RNA Nano 6000 Assay Kit (Agilent Technologies,Santa Clara,CA,USA) and the Bioanalyzer 2100 system (Agilent Technologies).
Library preparation for RNA sequencing
RNA sequencing samples were prepared using 2 μg RNA per sample. Sequencing libraries were generated using NEBNext® UltraTMRNA Library Prep Kit for Illumina® (Cat# E7530L,New England BioLabs,Inc.,Ipswich,MA,USA) in accordance with the manufacturer’s instructions,and index codes were added to attribute sequences to each sample.
Library examination
RNA concentration of the library was measured using the Qubit® RNA Assay Kit (Thermo Fisher,Waltham,MA,USA) in Qubit® 3.0 and then diluted to 1 ng/μL. Insert size was assessed using the Agilent Bioanalyzer 2100 system,and qualified insert size was accurately quantified using the StepOnePlusTMReal-Time polymerase chain reaction system (Thermo Fisher Scientific) (library valid concentration > 10 nM).
Library clustering and sequencing
The clustering of the index-coded samples was performed on a cBot cluster generation system (Illumina,San Diego,CA,USA) using a HiSeq PE Cluster Kit v4-cBot-HS (Illumina) in accordance with the manufacturer’s instructions. After cluster generation,the libraries were sequenced on an Illumina platform,and 150 base pair paired-end reads were generated.
Protein preparation
Samples from passage 3 OECs were sonicated three times on ice using a high-intensity ultrasonic processor (Ningbo Scientz Biotechnology Co.,Ltd.,Ningbo,China) in lysis buffer (8 M urea [Sigma,Burlington,VT,USA] and 1% protease inhibitor cocktail [Sigma]). Remaining debris was removed by centrifugation at 12,000 ×gat 4°C for 10 minutes. Finally,the supernatant was collected,and the protein concentration was determined with a bicinchoninic acid protein assay kit (Cat# P0012,Beyotime,Shanghai,China) in accordance with the manufacturer’s instructions.
For digestion,the protein solution was reduced with 5 mM dithiothreitol for 30 minutes at 56°C and alkylated with 11 mM iodoacetamide for 15 minutes at room temperature in the dark. The protein samples were diluted by adding 100 mM triethylammonium bicarbonate (Sigma) to urea concentration < 2 M. Finally,trypsin (Yaxin Biotechnology Co.,Ltd.,Shanghai,China) was added at 1:50 trypsin-to-protein mass ratio for the first digestion overnight and at 1:100 trypsin-to-protein mass ratio for a 4-hour digestion.
Liquid chromatography-tandem mass spectrometry analysis
The peptides were dissolved in the mobile phase A of liquid chromatography (0.1% [v/v] formic acid [Fluka,Burlington,VT,USA] in water) and then separated using the nanoElute® ultrahigh performance liquid system (Bruker Daltonics,Billerica,MA,USA). The peptides were injected into the capillary ion source for nanospray ionization and analyzed by time-of-flight tandem mass spectrometry (MS/MS) (Bruker Daltonics) using Q ExactiveTMPlus (Thermo Fisher Scientific).
Database search
The resulting MS/MS data were processed using the MaxQuant search engine (v.1.6.6.0; http://www.coxdocs.org/doku.php?id=maxquant:start). Tandem mass spectra were searched against the human UniProt database concatenated with a reverse decoy database. Carbamidomethylation of cysteine was specified as a fixed modification,and acetylation modification and oxidation on methionine were specified as variable modifications (Cox and Mann,2008).
Gene ontology annotation and enrichment analysis
Gene Ontology (GO) analysis (Ashburner et al.,2000; Thomas,2017) is a bioinformatics analysis method that can organically link information from genes and gene products (such as proteins) to provide statistical information. The GO annotation proteome was derived from the UniProt-GOA database (http://www.ebi.ac.uk/GOA/). First,identified protein IDs were converted to UniProt IDs and then mapped to GO IDs. If identified proteins were not annotated by the UniProt-GOA database,the InterProScan software was used to annotate the protein’s GO function based on the protein sequence alignment method. Second,proteins were classified by GO annotation based on three categories: “biological process,” “cellular component,” and “molecular function.” For each category,a two-tailed Fisher’s exact test was employed to test the enrichment of a differentially expressed protein against all identified proteins. The GO with a correctedP-value < 0.05 was considered significant.
Kyoto encyclopedia of genes and genomes pathway annotation and enrichment analysis
The Kyoto Encyclopedia of Genes and Genomes (KEGG) (Ogata et al.,1999; Chen et al.,2020a) combines current protein interaction network information,such as pathways and related complexes (“pathway” database),genes and gene products (“gene” database) and biological complexes and relevant reactions (“compound and reaction” database). KEGG’s pathways include metabolism,genetic-information processing,environmental information-related processes,cellular physiological processes and drug research (Du et al.,2014). We used the KEGG pathway database to annotate protein pathways: first,using the KEGG online service tool KAAS (v. 2.0; http://www.genome.jp/kaas-bin/kaas_main) to annotate the submitted proteins,then using the KEGG mapper to match the annotated proteins to corresponding pathways in the database.
Parallel reaction monitoring data analysis
The resulting MS data were processed using Skyline (v. 3.6; https://skyline.ms/project/home/software/Skyline/begin.view). For the peptide settings,enzyme was set as trypsin (KR/P) and maximum missed cleavage was set to 0. The peptide length was set as 7-25 amino acids,fixed modification was set as carbamidomethylation on cysteine,and maximum variable modifications was set to 3. For the transition settings,precursor charges were set to 2,3; ion charges were set to 1,2; and ion types were set to b,y,p. The product ions were set from ion 3 to the last ion,and the ion match tolerance was set as 0.02 Da.
Data analysis
The hypergeometric test was used for functional enrichment analysis,and Fisher’s exact test using R was used to calculatePvalues. The R package DESeq2 (http://www.bioconductor.org/packages/DESeq2/ (Love et al.,2014)) was used to analyze differentially expressed genes. The hierarchical cluster method was used to generate the expression heat map. AllPvalues were adjusted using the Benjamini-Hochberg procedure to decrease the false discovery rate. All calculation steps were performed in RStudio (https://rstudio.com/products/rstudio/download/#download).
Results
Identification of OECs from OB and OM
We purified OECs using a modified Nash differential adhesion method. In thein vitroculture environment,most of the suspended cells adhered to the six-well plates’ walls at 36 hours. Two main types of cells were identified morphologically. In the OB samples,almost all cells were bipolar or tripolar. In the OM samples,some cells were flat and polygonal with darkened cell bodies and several pseudopod-like structures,and were possibly early fibroblasts; other cells were bipolar or tripolar. However,it was difficult to accurately distinguish cell types at this 36-hour time point. Three days later,the differences between the two cell morphologies were more apparent. We identified fibroblasts,which had irregular shapes,a poor refractive index and divided rapidly,and OECs,which had clear outlines,strong three-dimensionality and bipolar or tripolar protrusions. OECs from the OB were dominated by bipolar cells with symmetrical protrusions. The cell body was long and spindle-shaped,and the nucleus was in the center. OECs from the OM were dominated by tripolar cells with three protrusions. The purification rate of both samples of cells was relatively high (85.4 ± 3.7%) after immunofluorescence identification with P75 and S100 (Lazzari et al.,2016; Śmieszek et al.,2017; Lin et al.,2019; Yue et al.,2020). There was no obvious difference in the expression level of P75 and S100 between cells from OB and OM,indicating that cells were separated and cultured successfully (Figure 1).
Differentially expressed genes and proteins in OB-derived and OM-derived OECs
This study detected 878 genes that were significantly differentially expressed in OB-derived OECs compared with OM-derived OECs,of which 419 were upregulated and 459 were downregulated. Cluster analysis was used to reflect changes in the pattern of differentially expressed genes in samples under different experimental conditions.
We used DESeq2 for differential gene expression analysis of OB-derived and OM-derived OECs. We calculated the Euclidean distance based on the expression level [fragments per kilobase of exon per million fragments mapped (FPKM)] of the differentially expressed genes in each sample and took the logarithm to the base 2. We then used the hierarchical cluster method to determine the overall clustering results of the samples. A heat map of all differentially expressed genes was generated (Figure 2A).
In this study,we used mass spectrometry to detect the signal abundance of proteins in each sample and obtained the labelfree quantification (LFQ) intensity of these proteins using a non-standard quantitative calculation method. The relative quantification of each sample was determined by comparing the protein LFQ intensity values of the samples. We quantified 266 differentially expressed proteins in OB-derived OECs and OM-derived OECs,of which 236 were increased and 30 were decreased in OM-derived OECs compared with OBderived OECs. We generated a quantitative volcano map of the differentially expressed proteins (Figure 2B). GO analysis of OECs from OB and OM showed that the most significant differences in genes,in terms of “molecular function,” related to “glial cell-derived neurotrophic factor receptor binding,” “neuregulin receptor activity” and “death receptor activity.” The most significant differentially expressed protein in OBderived OECs was related to “hydro-lyase activity”; in OMderived OECs,it was related to “structural constituent of ribosome.” In terms of “cellular component,” the most significant differences in genes related to “clathrin-sculpted gamma-aminobutyric acid transport vesicle membrane,” “semaphorin receptor complex” and “perisynaptic extracellular matrix.” The proteins with significant differences in OB-derived OECs were related to “mitochondrion”; OMderived OECs were related to “cytosolic ribosome.” In terms of “biological process,” the difference in genes related to “sclerotome development” was the most significant. The proteins with significant differences in OB-derived OECs were related to “aerobic respiration”; OM-derived OECs were related to “amide biosynthetic process” (Figures 3and4).
Through analysis and testing,we found that in OECs from OB and OM,the most significantly expressed genes and proteins involve “regulation of reproductive process” (GO:2000241),“cell adhesion” (GO:0007155),“regulation of cell migration” (GO:0030334),“positive regulation of developmental process” (GO:0051094),“regulation of nervous system development” (GO:0051960),“axon guidance” (GO:0007411),“regulation of neurogenesis” (GO:0050767),“regulation of axonogenesis” (GO:0050770),“protein dimerization activity” (GO:0046983),“protein homodimerization activity” (GO:0042803),“death receptor activity” (GO:0005035),“cytokine binding” (GO:0019955),“growth factor binding” (GO:0019838),“cell adhesion molecule binding” (GO:0050839),“neurotrophin binding” (GO:0043121),“transporter activity” (GO:0005215),“cytokine activity” (GO:0005125),“transforming growth factor beta receptor binding” (GO:0005160),“growth factor activity” (GO:0008083),“neurotrophin receptor activity” (GO:0005030) and “nerve growth factor binding” (GO:0048406 ) (Table 1).
To thoroughly understand the genes and proteins identified and quantified in our data,we elaborated on the functions and characteristics of these genes and proteins in terms of GO and the KEGG pathway. We obtained the enrichment results of differentially expressed genes in the secondary GO entries. At the same time,we plotted the functional classification of significantly enriched differentially expressed proteins (P< 0.05) (Figures 3-5;Tables 2and3). In terms of “molecular function,” we found that two genes were highly expressed in OB-derived OECs compared with OM-derived OECs in the “glial cell-derived neurotrophic factor receptor binding” category of GO analysis. For the “death receptor activity” category,one gene was highly expressed in OB-derived OECs,and three genes were highly expressed in OM-derived OECs. Compared with OM-derived OECs,three proteins related to “hydro-lyase activity” were expressed at higher levels in OB-derived OECs; 33 proteins related to the “structural constituent of ribosome” were expressed at higher levels in OM-derived OECs. In terms of “cellular component,” two genes were highly expressed in OB-derived OECs under the “clathrin-sculpted gammaaminobutyric acid transport vesicle membrane” category of GO analysis. Fifteen proteins related to “mitochondrion” were expressed at higher levels in OB-derived OECs; 35 proteins related to “cytosolic ribosome” were overexpressed in OMderived OECs. In terms of “biological process,” the differentially expressed genes related to “sclerotome development” were most significantly enriched. Four genes were highly expressed in OM-derived OECs. Five proteins related to “aerobic respiration” were highly expressed in OB-derived OECs. Fortynine proteins related to “amide biosynthetic process” were highly expressed in OM-derived OECs.
The hypergeometric test was applied to enrichment analysis for each pathway in KEGG,and the pathways that were significantly enriched in differentially expressed genes were identified. The extraction and union of the enrichment pathways of the comparison group were combined,and the KEGG entry was analyzed according to the enrichment degree q value of the sample in the pathway (Figure 5A). For the differentially expressed proteins identified by proteomics,the functional classifications and pathways of the significantly enriched proteins were determined byP< 0.05 (obtained by the enrichment test; Fisher’s exact test) (Figure 5B). In this study,there were five KEGG pathways with the highest enrichment,namely “cytokine-cytokine receptor interaction,” “cell adhesion molecules (CAMs),” “axon guidance,” “malaria” and “Rap1 signaling pathway.” Our data show that OM-derived OECs had 22 genes related to the “cytokine-cytokine receptor interaction” pathway,whereas OB-derived OECs had a greater number of differentially expressed genes in the “cell adhesion molecules (CAMs)” and “axon guidance” pathways (Table 4). Our proteomics sequencing shows that OB-derived OECs had five differentially expressed proteins enriched in the “citrate cycle (TCA cycle)” pathway. In OM-derived OECs,30 proteins were enriched in the “ribosome” pathway,11 proteins were enriched in the “tight junction” pathway and 7 significant proteins were enriched in the “adherens junction” pathway.
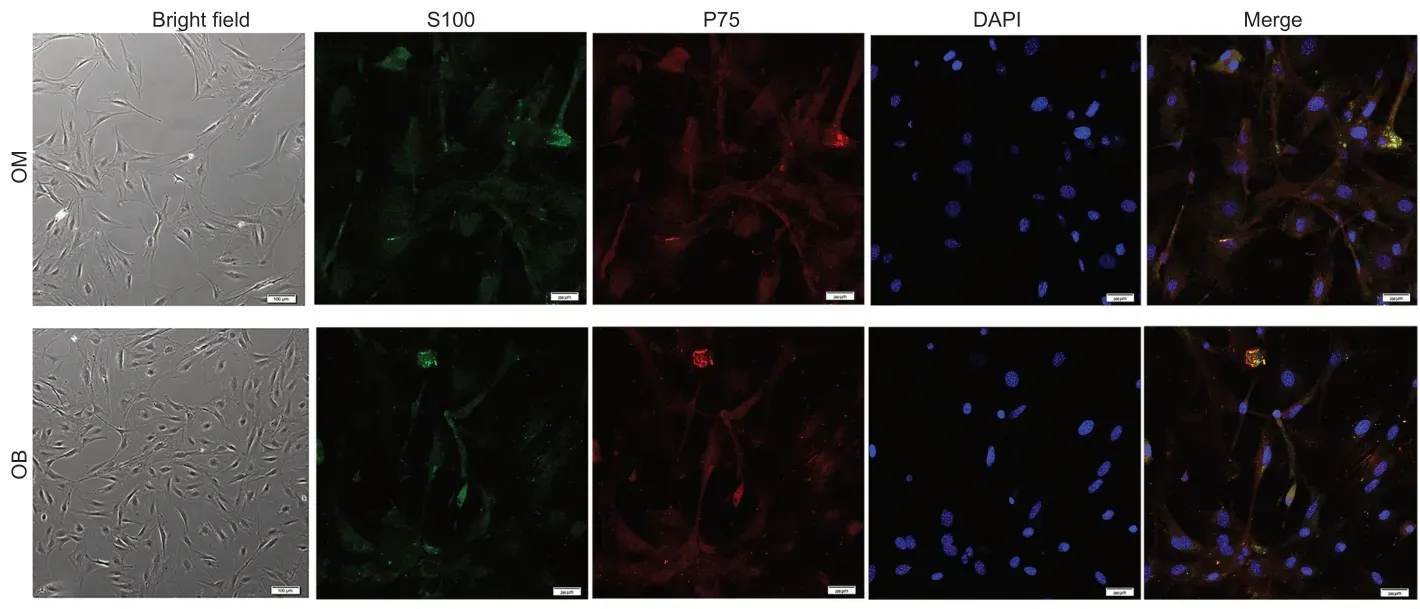
Figure 1|Identification of olfactory ensheathing cells from the OM and OB.
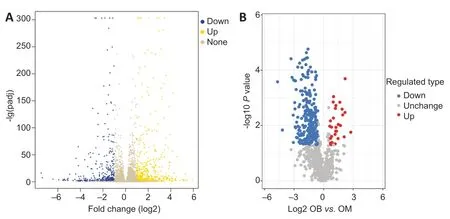
Figure 2|Quantitative volcano map of differentially expressed genes (A) and proteins (B) of olfactory ensheathing cells from olfactory bulb compared with olfactory mucosa.
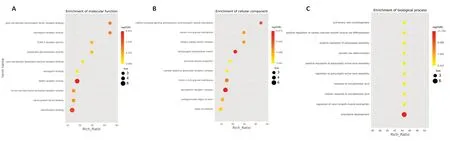
Figure 3|Bubble chart of “molecular function” (A),“cellular component” (B) and “biological process” (C) of differentially expressed genes in olfactory ensheathing cells from olfactory bulb and olfactory mucosa.
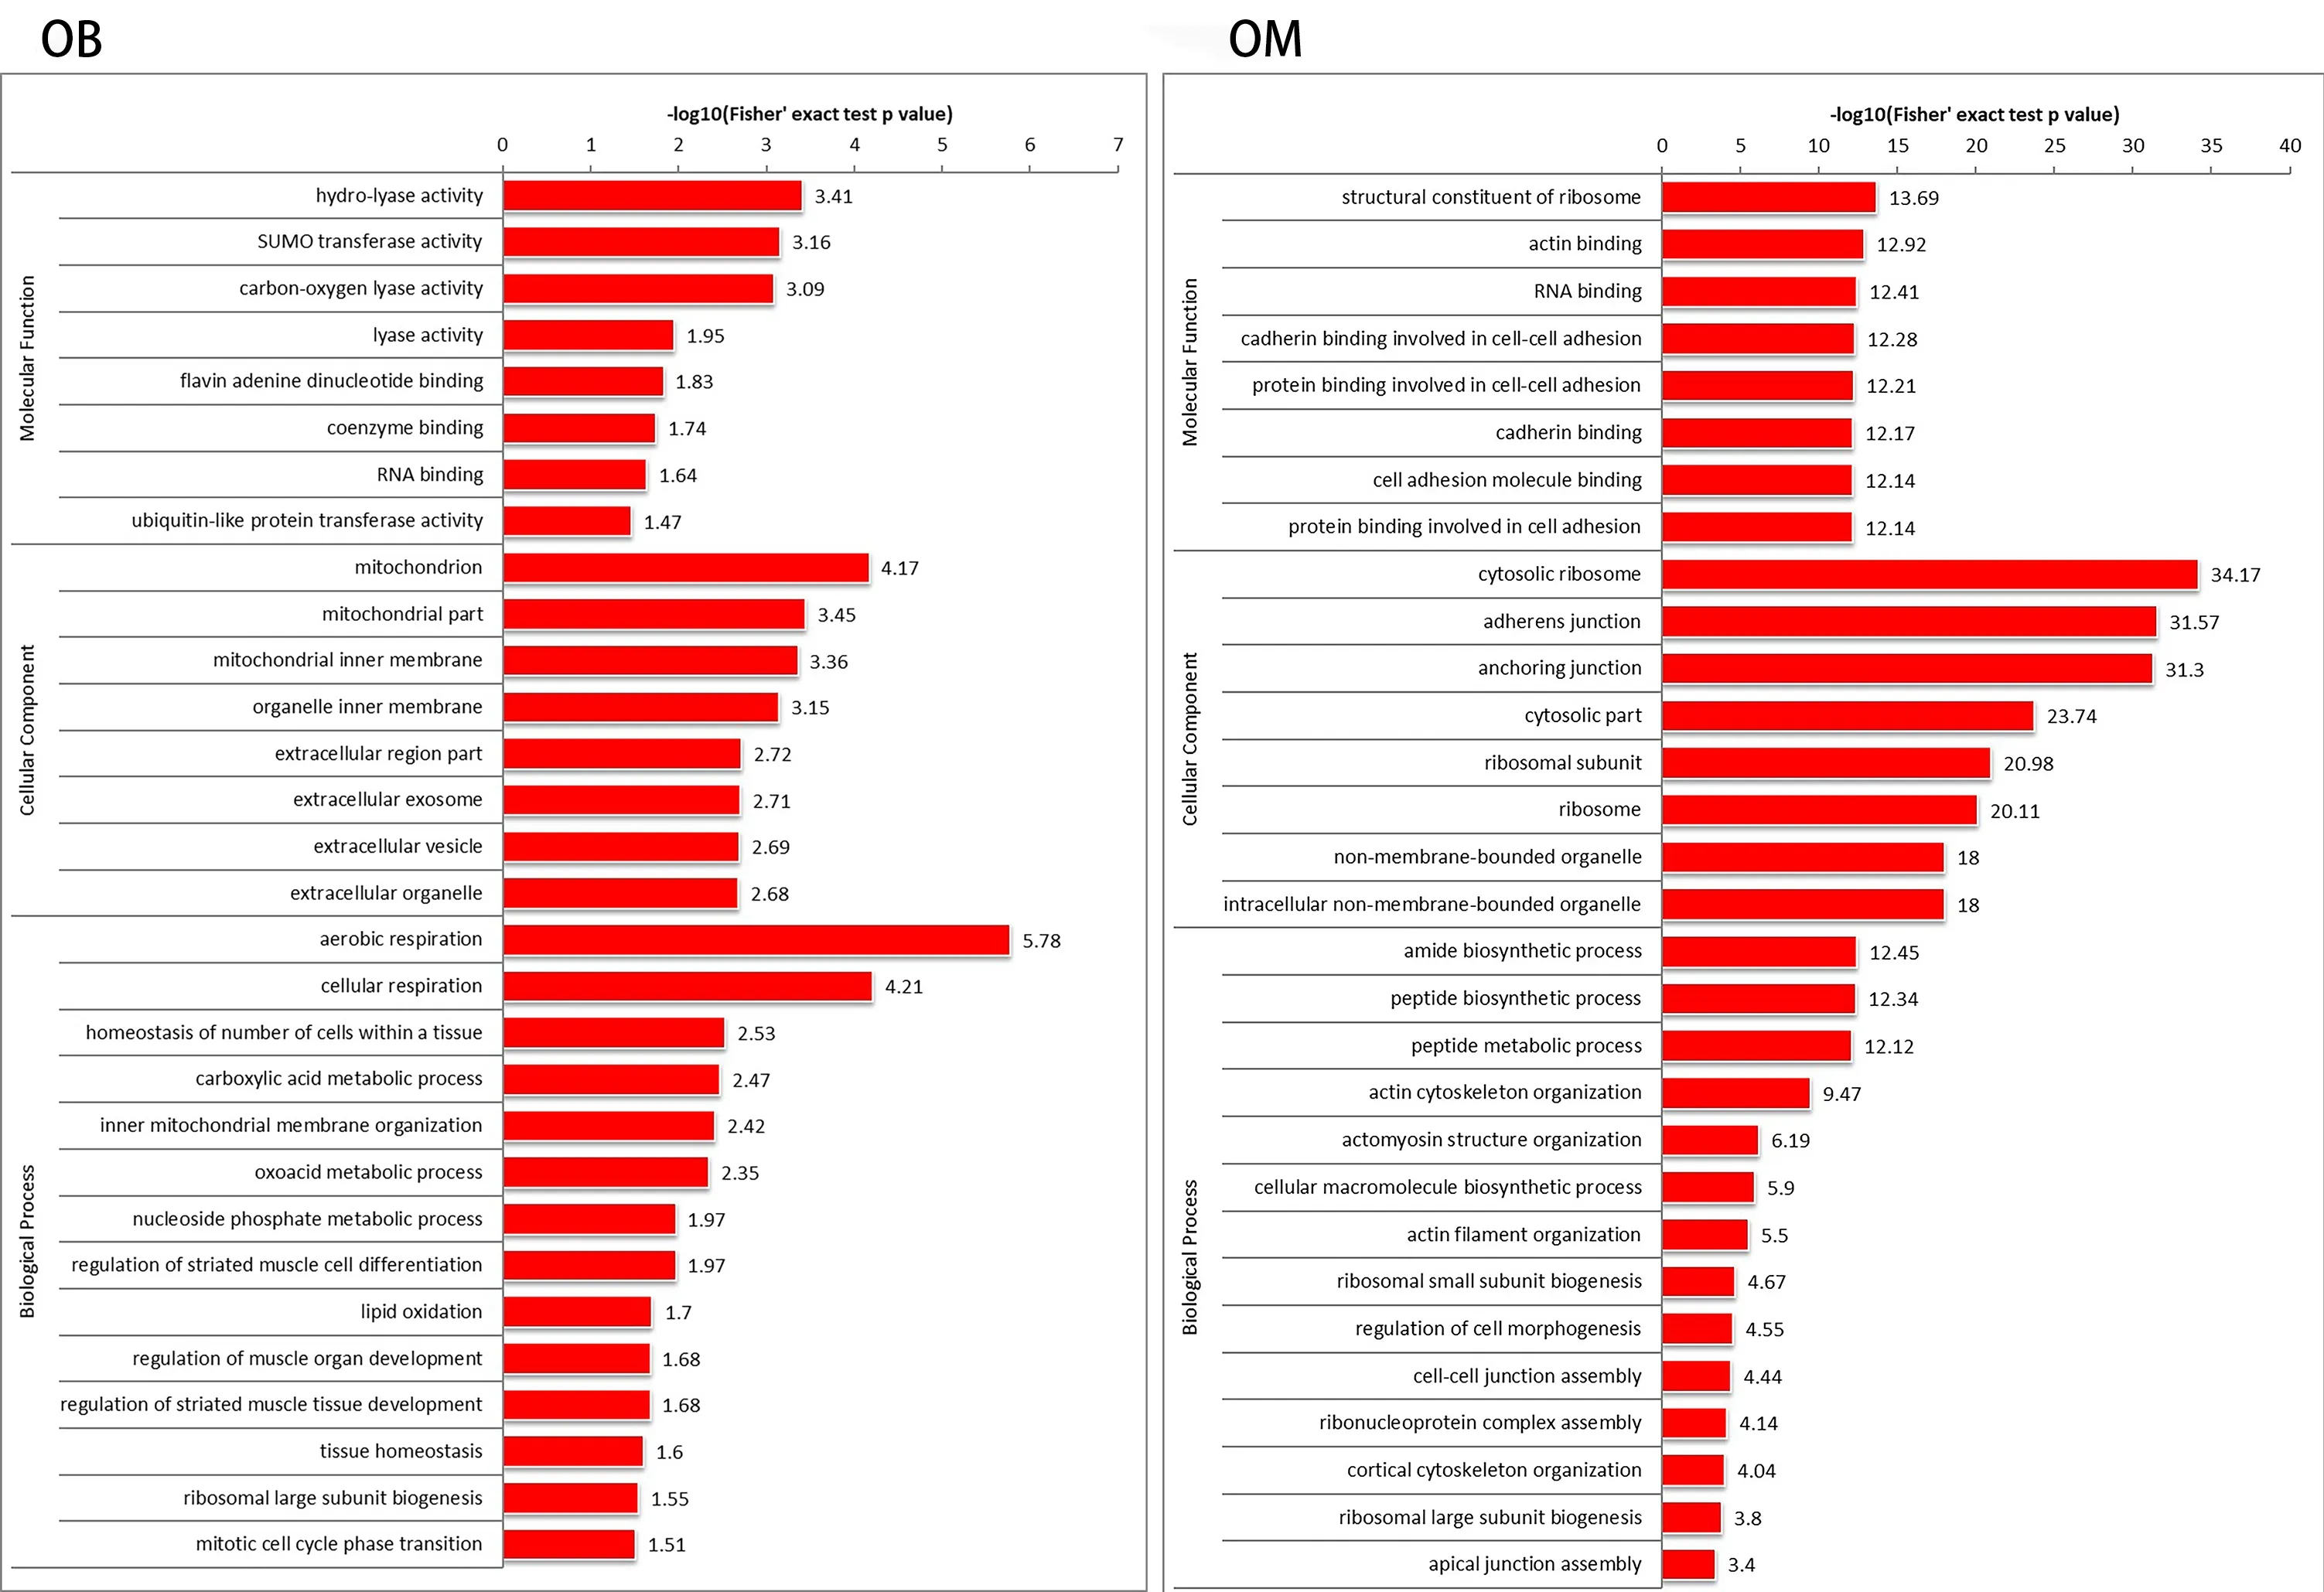
Figure 4|Functions of OB and OM differentially expressed proteins in GO.
We conducted parallel reaction monitoring verification onAtp6v1a,Cfl1,Dpysl2andYwhaeof most interest,obtained relevant data for analysis,confirming that these four proteins were indeed highly expressed in OECs,further confirming the results of our protein screening (Table 5).
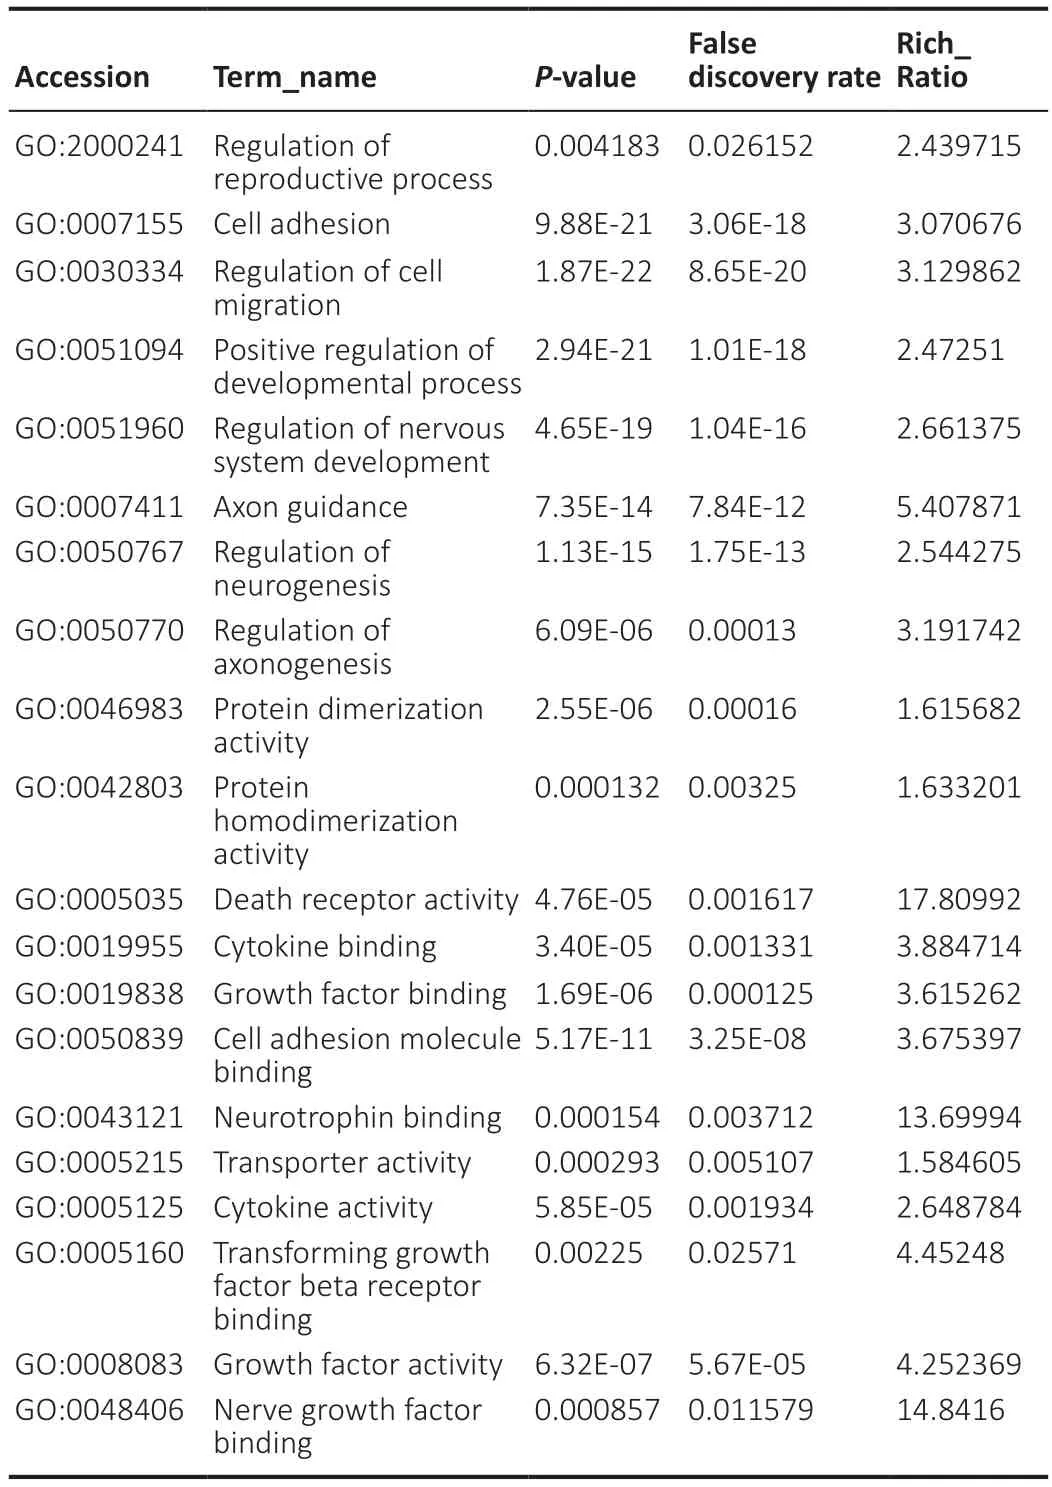
Table 1|GO iterms with significantly enriched differentially expressed genes of OB and OM
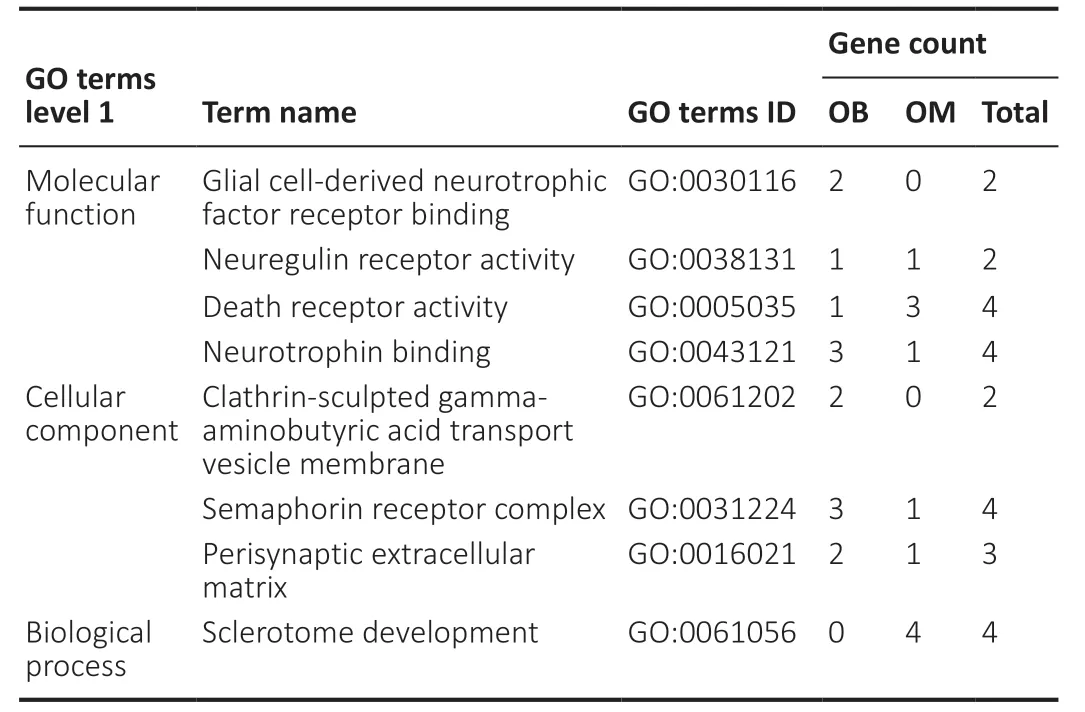
Table 2|Distribution of OB and OM differentially expressed genes in GO enrichment analysis
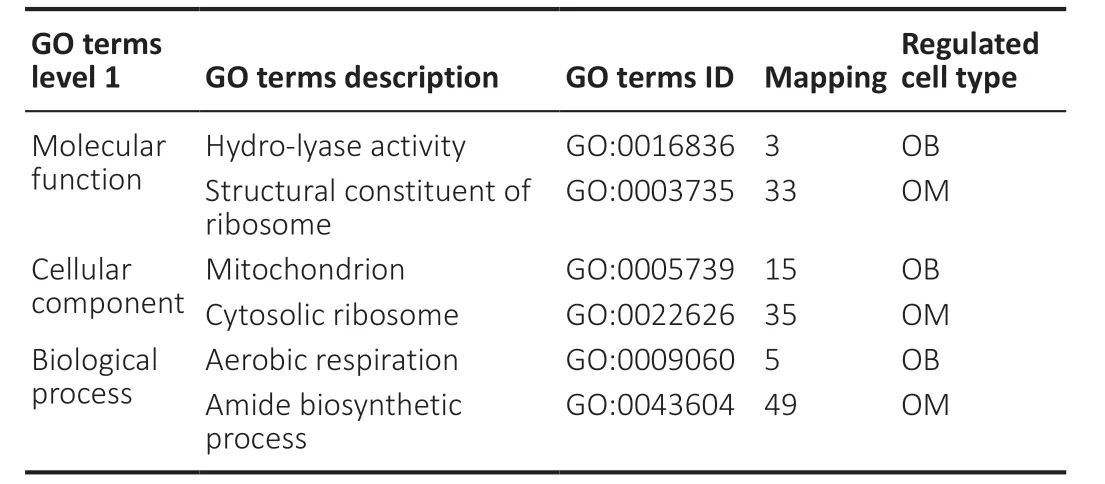
Table 3|The quantitative distribution of OB and OM differentially expressed proteins in GO enrichment analysis
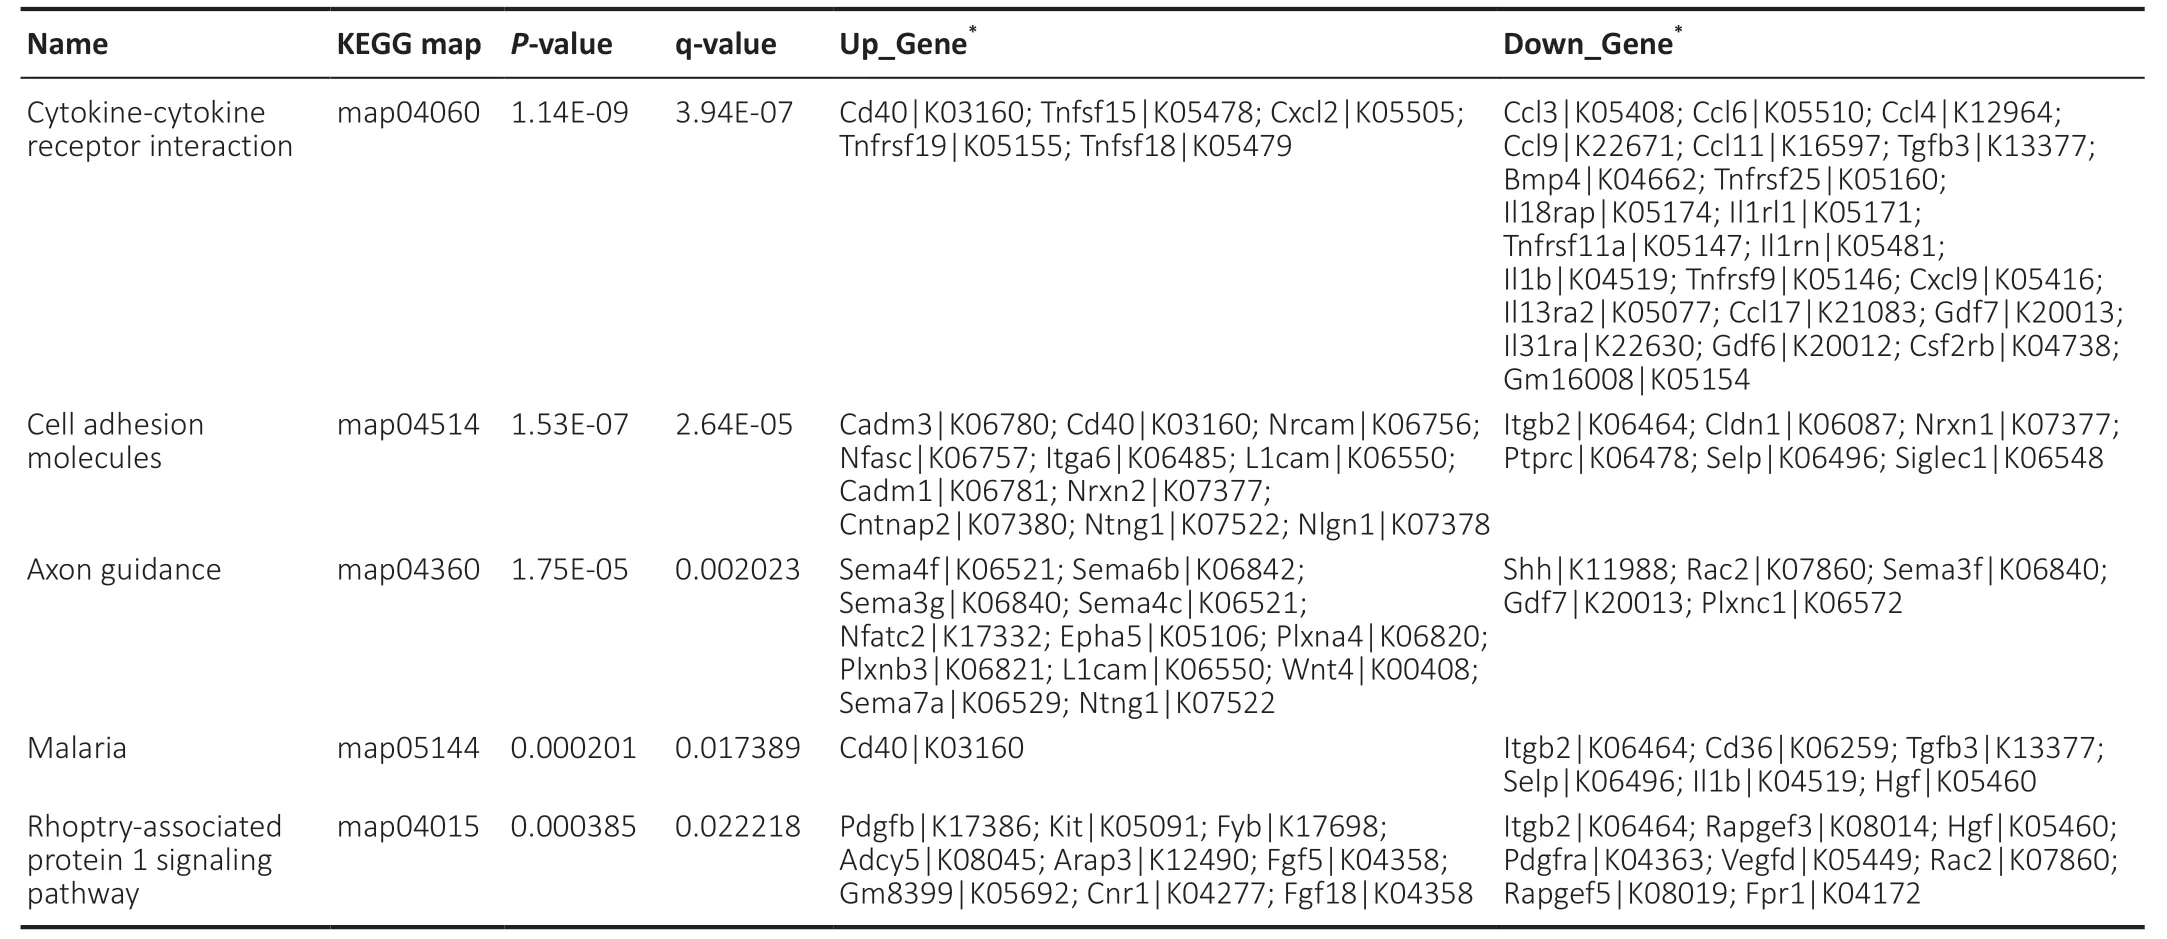
Table 4|Quantitative enrichment analysis of differentially expressed genes of OB compared with OM in KEGG signaling pathway

Table 5|Parallel Reaction Monitoring quantitative analysis results from the unique peptide of the selected protein
Discussion
We identified many highly expressed genes and proteins in OB and OM using GO analysis. For example,OB overexpresses nerve growth factor receptor (Ngfr),which plays a key role in apoptosis,nerve growth factor binding,axon guidance,central nervous system development,nerve development and positive regulation of apoptotic processes (Ramli et al.,2019; Chen et al.,2020b; Sanders et al.,2020). Neurotrophic receptor tyrosine kinase 2 (Ntrk2),overexpressed by OB,can regulate central nervous system neuron development,positive regulation of axonogenesis,cell proliferation and neuron projection development (Chen et al.,2019; Badurek et al.,2020; Pattwell et al.,2020). There is evidence that Ntrk2 plays a protective role in prodromal Huntington’s disease (Ciarochi et al.,2018). Insulin-like growth factor binding protein 3 (Igfbp3),overexpressed by OB,is related to positive regulation of apoptotic processes and regulation of cell growth (Arab et al.,2020; Tan et al.,2020). Semenova et al. (2020) found that Igfbp3 plays a significant role in propagation of stress-induced senescence in human endometriumderived mesenchymal stem cells. Igfbp3 is a multifunctional protein that can stimulate cell growth or promote apoptosis. Kinase insert domain receptor (Kdr),overexpressed by OB,is related to blood-vessel endothelial-cell differentiation and cell migration,positive regulation of angiogenesis,cell migration,cell proliferation,focal adhesion assembly and positive regulation of vasculogenesis (Borowczyk et al.,2019; Li et al.,2019; Dono et al.,2020). These genes and proteins are highly expressed in OB,and the function of these genes explains why transplantation of OB-derived OECs after nerve damage can help animals or humans restore part of their nerve function (Voronova et al.,2019; Li et al.,2020) and demonstrates the important potential of OECs as a candidate for the treatment of nerve damage.
OM overexpresses sonic hedgehog,which is involved in spinalcord motor-neuron differentiation,stem cell development,vasculogenesis,cell development,cell proliferation and other related processes (Yuan et al.,2019; Gredler et al.,2020; Hamdi-Rozé et al.,2020). Previous studies have shown that sonic hedgehog plays essential roles in developmental events such as cell-fate specification and axon guidance (Yam et al.,2009). Lowry et al. (2008) reported that transplantation of endothelial-expanded neural stem cells that were treated with sonic hedgehog during the expansion phase into an adult mouse SCI model resulted in significant recovery of sensory and motor function.
OM overexpresses bone morphogenetic protein 4 (Bmp4). Bmp4 plays an important role in angiogenesis,endothelial cell migration and blood vessel development and is a positive regulator of apoptotic processes,cell migration and the vascular endothelial growth factor-receptor signaling pathway (Peng et al.,2019; Kobayashi et al.,2020). This suggests that OM cells can promote the development of endothelial cells; wound healing is accompanied by the development of new endothelial-lined blood vessels. Taha et al. (2016) demonstrated that Bmp4 signaling and serum composition play significant roles in the differentiation of mouse embryonic stem cells towards the endodermal lineage.
OM overexpresses tumor necrosis factor receptor superfamily member 25 (Tnfrsf25). Tnfrsf25 participates in the inflammatory response,regulation of apoptotic processes and regulation of cell proliferation. A previous study demonstrated that a two-pathwayin vivostrategy targeting Tnfrsf25 [with tumor necrosis factor superfamily cytokine TNF-like protein 1A (TL1A-Ig)] and interleukin-2 receptor (with low-dose interleukin-2) can elicit strong increases in regulatory T cell numbers and functions (Copsel et al.,2020). This means that OM can enhance the body’s immune response to fight against inflammation caused by nerve damage.
Other growth factors were also overexpressed. Transforming growth factor beta 3 (Tgfb3) is closely related to the activation of mitogen-activated protein kinase activity,cell development,cell growth,wound healing and positive regulation of apoptotic processes (Sarper et al.,2018; Galimberti et al.,2019; Meaburn and Misteli,2019). Plateletderived growth factor receptor alpha (Pdgfra) plays a key role in cell migration,platelet aggregation,positive regulation of cell migration,wound healing and positive regulation of cell proliferation (Urbini et al.,2019; Shi et al.,2020). The genes or proteins highly expressed by OM play an important role in the inflammatory response,blood vessel growth and wound repair. Recovery of wounds treated with OM-derived OECs has been shown to be faster compared with the OB-derived OECs comparison group (Li et al.,2020); therefore,OMderived OECs are cells with great potential for use as a clinical treatment of nerve injury in the future.
By analyzing the data related to the KEGG pathway from OB-derived and OM-derived OECs,we found that the metabolic pathways identified from the two sources of cells are consistent with our GO enrichment analysis results. OM is enriched for differentially expressed proteins related to cytokine interaction,cell adhesion and tight junctions,such as C-C motif chemokine ligand 3 and C-C motif chemokine ligand 4. These proteins function as positive regulators of inflammatory response,cell migration and endothelial cell proliferation (Pelisch et al.,2020). Indraswari et al. (2009) found that the expression of dihydropyrimidinase-like 2 (Dpysl2) and cofilin-1 indicates an early neuronal defense mechanism leading to active neuronal repair,regeneration and development because these genes are involved in neurite outgrowth and plasticity. OB has an increased number of differentially expressed proteins related to axon growth and extension,such as neuronal cell adhesion molecule (Nrcam),which is related to neuron cell-cell adhesion and calciumdependent cell-cell adhesion via plasma membrane cell adhesion molecules (Charoy et al.,2012). Neurofascin is related to axon guidance,protein localization to the paranode region of the axon,and transmission of nerve impulses (Thaxton et al.,2010; Monfrini et al.,2019). ATPase H+transporting V1 subunit A and 14-3-3 protein epsilon have been associated with epileptic encephalopathies (Kadwa,2020; Romano et al.,2020). Collectively,through gene and protein analysis,this study shows that these highly expressed genes and proteins in OECs contribute to the inhibition of progressive tissue damage and functional impairment in nervous system disease.
The role of OECs is often underestimated,but as more studies reveal their promise in functional applications (Mackay-Sim and St John,2011; Collins et al.,2019),it is necessary to better understand their gene and protein components and related functions. Compared with previous research on the difference between OB-derived and OM-derived OECs (Guérout et al.,2010; Alizadeh et al.,2019; Smith et al.,2020),our study identifies genes and proteins in mouse OB and OM based on MS analysis and analyzes the data by bioinformatics methods. In a previous study (Guérout et al.,2010),57 overexpressed genes in OB and OM were identified; our study identified more than 800 overexpressed genes. We also detected significant differences in related proteins,providing more comprehensive data for future investigation.
Based on the genes and proteins we identified from OECs,we selected several proteins of interest for parallel reaction monitoring verification,Atp6v1a,Cfl1,Dpysl2andYwhae. We confirmed that these proteins are indeed differentially expressed in OECs.In vivoexperiments will be useful to perform in the future. Current research (Pastrana et al.,2006) shows that the expression of olfactory ensheathing cellsin vivoandin vitrois not the same,which is closely related to their functional mechanism. For example,in the treatment of spinal cord injury,in vitro,OECs promote axonal growth as a source of neurotrophic growth factors;in vivo,they produce myelin,promoting remyelination of damaged axons (Pellitteri et al.,2014). We will explore the mechanisms of specific proteins of interest in OB-derived and OM-derived OECsin vitroin future research to understand the possible benefits for the treatment of neurological diseases and nerve injury after OEC transplantation.
In conclusion,OB expression is significantly related to aerobic respiration,cellular respiration and carboxylic acid metabolic processes. OB expression shows a stronger regulation of nerve regeneration and axon regeneration and extension processes,and these processes play key roles in transmission of nerve impulses and response to axon injury. Conversely,OM expression is significantly related to amide biosynthetic processes and peptide biosynthetic processes,and these processes play key roles in positive regulation of inflammatory response,positive regulation of defense response,cytokine binding,cell migration and regulation of wound healing. OECs from OB and OM overexpress genes and proteins involved in cell growth,proliferation and apoptosis,which are closely related to their role in treating nerve injury. The significantly differentially overexpressed genes and proteins identified herein may lead to further understanding of the different therapeutic effects of OB compared with OM for nerve injury. Therefore,our research will help to gain insights into the molecular activity of OECs,add further information to the relevant transcriptome and proteome maps,and could also aid in the discovery of biomarker proteins for diseases related to OECs in the future. Our research focused on the expression of OB-derived and OM-derived OECsin vitro,and failed to elaborate on the similarities,differences and mechanisms of expressionin vivo. We believe that in the future,the systematic study of the gene and protein expression of olfactory ensheathing cells from two sourcesin vivoandin vitrowill better explain the different reasons for their functions,and will greatly promote the clinical application of olfactory ensheathing cells.
Acknowledgments:We thank Jingjie PTM BioLabs (Hangzhou,China) for supporting Label Free and parallel reaction monitoring proteomics analysis.
Author contributions:Design and concept of the study: YXL,PY,HCX,LBW; experiment conduction: YXL,PY,ZZ,LJZ; background analysis and manuscript preparation: YXL,HCX,LBW; manuscript editing: YXL,NY. All authors approved the final manuscript.
Conflicts of interest:The authors declare no conflicts of interest.
Financial support:This work was supported by Key Research Projects of the Ningxia Hui Autonomous Region of China,No. 2018BCG01002 (to HCX) and the Natural Science Foundation of Ningxia Hui Autonomous Region of China,No. NZ17150 (to PY). The funding sources had no role in study conception and design,data analysis or interpretation,paper writing or deciding to submit this paper for publication.
Institutional review board statement:This study was approved by the Animal Experiment Ethics Committee of the General Hospital of Ningxia Medical University (approval No. 2017-073) on February 13,2017.
Copyright license agreement:The Copyright License Agreement has been signed by all authors before publication.
Data sharing statement:The original data including transcriptome and proteome are shown in iProX with ID proteome: PXD024046. RNA-seq data are openly available in GenBank of NCBI (https://www.ncbi.nlm.nih.gov/) under the accession. The associated BioProject,SRA,and Bio-Sample numbers are SAMN17975094,SAMN17975093,PRJNA702555,respectively.
Plagiarism check:Checked twice by iThenticate.
Peer review:Externally peer reviewed.
Open access statement:This is an open access journal,and articles are distributed under the terms of the Creative Commons Attribution-NonCommercial-ShareAlike 4.0 License,which allows others to remix,tweak,and build upon the work non-commercially,as long as appropriate credit is given and the new creations are licensed under the identical terms.

- 中国神经再生研究(英文版)的其它文章
- Deciphering the role of PGC-1α in neurological disorders: from mitochondrial dysfunction to synaptic failure
- Dying by fire: noncanonical functions of autophagy proteins in neuroinflammation and neurodegeneration
- Transcranial magnetic stimulation in animal models of neurodegeneration
- SYNGR4 and PLEKHB1 deregulation in motor neurons of amyotrophic lateral sclerosis models: potential contributions to pathobiology
- Cholesterol synthesis inhibition or depletion in axon regeneration
- Challenges in developing therapeutic strategies for mild neonatal encephalopathy