
Effect of intravitreal ranibizumab on fibrovascular membranes in patients with proliferative diabetic retinopathy
2022-10-24 09:22ZeYuLiangYiPengWangJingLiWenChaoYangYongFangTuYueZhangSongChen
Ze-Yu Liang, Yi-Peng Wang, Jing Li, Wen-Chao Yang, Yong-Fang Tu, Yue Zhang,Song Chen
1Tianjin Eye Hospital, Tianjin Eye Institute, Tianjin Key Lab of Ophthalmology and Visual Science, Nankai University
Affiliated Eye Hospital, Tianjin 300020, China
2Anyang Eye Hospital, Anyang 455000, Henan Province,China
Abstract
● KEYWORDS: proliferative diabetic retinopathy;ranibizumab; fibrovascular membranes; glial-mesenchymal transition; microvessel density
INTRODUCTION
In patients with proliferative diabetic retinopathy (PDR),fibrovascular membranes (FVMs) are characterized by abnormal neovascularization, combined with extracellular matrix (ECM) containing infiltrated cells[1]. The remodeling and pathology of FVMs can be understood as a scar-like repair procedure, involving multiple interactions among processes,including angiogenesis, glial activity, inflammatory cell infiltration, matrix metalloproteinases, and fibrosis[2-3]. Glial or fibrocyte-like cells originating from the retina or posterior vitreous cortex are components of the FVM in PDR[4-5].Compared with active FVMs, inactive fibrosis epiretinal membranes exhibit more fibrotic stroma combined with less angiogenesis or proliferation, and are the indicator of less active condition of PDR and lower levels of inflammation, in which condition the vitrectomy was performed more easier[6-7].Several factors can be used to evaluate FVM activity. First,autocrine vascular endothelial growth factor (VEGF) in Müller/glial cells is activated by tractive force or fluctuations caused by the FVM, influencing VEGF concentration in vitreous fluid in PDR[8]. Abnormally high expression of VEGF combined with other cytokines in the vitreous cavity can stimulate Müller/glia cells to express high levels of glial fibrillary acidic protein (GFAP) in turn. Thus, GFAP levels in the FVM or retina can indicate the active state of PDR[9-10]. Furthermore, the density of infiltrated lymphocyte cells is correlated with inflammation of FVM in PDR[11]. Therefore, microvessel density, infiltrated cells, and GFAP expression in FVMs are positively correlated with the PDR stage.
There are pathological conditions that involve the transformation of active FVMs into inactive membranes. This transformation of cells into myofibroblasts is the classic pathology of fibrosis in FVM, and myofibroblasts are key cells accumulated in the ECM, while α-smooth muscle actin (α-SMA), which contributes to the contractive force of FVMs on the retina, is a classic and reliable marker of mesenchymal and myofibroblast differentiation[12-13]. Similar to the canonical concept of angiofibrotic transformation, where vascular endothelial cells are transformed into myofibroblasts by the pathological endothelial to mesenchymal transition (EMT) of vessels in FVM[14], glial cells in FVM are also involved in fibrogenic dedifferentiation,defined as glial-mesenchymal transition (GMT). The GMT is characterized by down-regulation of GFAP expression and upregulation of α-SMA, and is considered a subcategory of EMT involving glial cells that contribute to fibrosis in FVM[15]. In summary, the transformation of glial activation into fibrotic proliferation in the FVM participates in FVM remodeling;hence, by evaluating the relative expression levels of GFAP and α-SMA, we can analyze the degree of shift of glial activity towards fibrosis in FVMs.
Pretreatment by intravitreal injection of VEGF inhibitor drugs as an adjunct to vitrectomy in PDR patients with activated FVM has highlighted the ability of this approach to facilitate surgical interventions or improve the outcomes of vitrectomies and has already been proved for not aggravating tractional retinal detachment in short time[16-17]. Previous research has focused mainly on the pathogenesis or histology of angiogenesis in epiretinal membranes of patients with PDR;however, questions arise as to whether short-term inhibition of VEGF accelerates the glial-fibrotic change in FVMs of patients with PDR. The aim of this study was to explore the effect and underlying mechanisms of intravitreal injection of ranibizumab, a monoclonal antibody fragment that binds to the VEGF-A isoform, on angiogenic and glial activity in FVMs, with a particular focus on GMT, in tissues excised from patients with PDR.
SUBJECTS AND METHODS
Ethical ApprovalThe research protocols for this randomized clinical control study were approved by the institutional review board of Tianjin Eye Hospital and the study adhered to the tenets of the Declaration of Helsinki for the collection of both specimens and clinical data for subsequent analysis. All of the patients included in this study provided informed consent.
Study PopulationFrom October 2019 to August 2020, all patients with PDR with tractional retinal detachment (TRD)requiring vitrectomy were included in the study, provided that the details of the fundus could be clearly visualized and FVMs were present. Patients were excluded if they had quiescent epiretinal membrane fibrosis (no obvious vessels) fibrosis of epiretinal membranes, any previous history of intravitreal injection of anti-VEGF drugs, a history of surgery, pan-retinal photocoagulations during the last three months, or any poorly controlled systematic disease.
Patient Examination and Sample CollectionAll of the 42 patients with PDR (42 affected eyes) included in this study received best-corrected visual acuity (BCVA) by standard logarithmic visual acuity chart, slit lamp examination,fundus examination, and intraocular pressure measurement before pars plana vitrectomy (PPV). Patients were grouped based on whether they received an intravitreal injection of ranibizumab (IVR) prior to vitrectomy surgery by the principle of voluntariness: Patients in the IVR group received ranibizumab (0.5 mg) 5d before vitrectomy and the control group with not any an intravitreal injection. The FVM tissues were surgically removed from the vitreous cavity using endgripping forceps and fixed in buffered 4% paraformaldehyde and then embedded in paraffin for at least 24h. Paraffinembedded tissues were cut into at least five 4-μm sections, of which one was selected for hematoxylin-eosin (H-E) staining and the remaining four serial sections were used equally to perform immunohistochemical staining for CD31 and dual immunofluorescence histochemistry staining for GFAP and α-SMA.
Histological AnalysisThree serial fields were captured in one section at the stated magnification by light microscopy for subsequent analysis. The method described by Jiaoet al[18]was used to quantify the density of nucleated cells in H-E stained FVM sections under high-power (×400) microscopy with Image J software. Colored images were converted to 8-bit grayscale and all images were subjected to the same threshold and binary images analysis. Image areas were measured in mm2, with pixel conversion according to the scale and magnification of the light microscope. Nucleated cell density is expressed as the mean number of cells per mm2(/mm2).
Immunohistochemical AnalysisFor immunohistochemistry,tissue sections were incubated overnight at 4℃ with mouse monoclonal anti-CD31 antibody (1:50, Abcam). First sections were deparaffinized, dehydrated, and any endogenous peroxidase activity was eliminated by incubating in 3%H2O2in methanol, and subjected to heat-induced antigen retrieval, and then incubated with diluted normal rabbit serum (1:10) overnight at 4℃. The following day, sections were incubated in biotinylated secondary antibody for 1h and the bound antibody was visualized using the peroxidase substrate, diaminobenzidine, according to the manufacturer’s instructions. Hematoxylin was used as a counterstain. Images were captured using an Olympus BX41 light microscope.
Evaluation of Microvessel DensityEvaluation of microvessel density (MVD) was based on the method of Weidner[19]. The microvessel outlines were visualized by staining for CD31, a marker of vascular endothelial cells. Capillaries were located in low power fields (10×10), then at least three representative fields were selected for high-power examination (HP, 40×10;area, 0.24 mm2; number of fields, 22) to count the number of microvessels covering the entire stromal area, excluding large vessels with lumen diameter >50 μm. Any single layer of brown-stained endothelial cells separated from other microvessels or connective tissues was considered a countable microvessel. MVD was calculated as the mean number of vessels per HP area (/mm2). Two investigators were blinded to the details of the groups, their combined their data was used for statistical analysis.
Dual-color Immunofluorescence StainingGFAP and α-SMA, as markers of activated glial cells and myofibroblasts,respectively, were analyzed by dual-color immunofluorescence staining to detect their co-localization and relative expression levels. Cells positive for both GFAP and α-SMA were considered glia-derived myofibroblasts undergoing GMT[15].The GMT index (GI) of FVM was calculated as the ratio of the relative expression of GFAP and α-SMA expression to semiquantify GMT activity in FVMs.
Indirect immunofluorescence was analyzed according to the method described by Jiaoet al[18]. The sections were deparaffinized and dehydrated and then incubated with each of the following primary antibodies sequentially for 60min:mouse-anti-α-SMA (1:100; Abcam) and rabbit-anti-GFAP(1:100; Abcam). Next, the samples were washed three times for 5min with phosphate buffered saline (PBS) and incubated with Alexa Fluor 647 goat anti-mouse IgG (1:100; Abcam)and Alexa Fluor 488 goat anti-rabbit IgG (1:100; Abcam).The sections were then washed three times with PBS after each incubation step and then mounted with 4’,6-diamidino-2-phenylindole (1:1000; Abcam). All images were examined and photographed within 24h to prevent fluorescence quenching,using a fluorescent microscope under the same parameters(Leica DM4000 B LED, Germany). At least three exposures for both antigens were evaluated for each sample.
The mean marked tissue-associated gray value, calculated as the ratio of the integrated density to the area of the image[20],was conducted to provide a semi-quantitative analysis of protein expression. Colored images were converted to 8-bit type and Red-Default mode, so that the positive area stained red on a dark background. The built-in Image J Colocalization Finder software was used to evaluate the colocalization of the two proteins stained by dual color immunofluorescence and was assess using the Pearson’s correlation coefficient (PCC)for the correlation between the intensity of the pixel count intensity of the two markers. PCC values closer to 1 indicated a stronger colocalization of the pixel intensities of markers[21].Statistical AnalysisStatistical analyses were performed using SPSS 24 software. Quantitative data are presented as mean±standard deviation (SD) or median, according to their distribution. Comparisons of sample rates were performed using the Chi-square test. The Student’st-test was used to compare differences between two groups if data were normally distributed with equal variance. Data were analyzed by Mann-WhitneyUtest for populations with non-normal distributions or unequal variance.Pvalues <0.05 were considered statistically significant.
RESULTS
Demographic and Clinical Characteristics of the Study GroupsThere were no significant differences with regard to relevant clinical data between the two groups (allP>0.05;Table 1).
Morphometric Analysis, Cell Intensity, and Microvessel Density EvaluationH-E staining showed that all FVM tissue samples from both groups were vascularized with numerous microvessels or scattered stromal cells in fibrotic membranes.The microvessels exhibited irregular vascular structures,combined with a single layer of perivascular cells with large nuclei (Figure 1).
The mean cell density of FVM in the control group was(1095.38±160.00)/mm2, which was slightly higher than that of the IVR group (1037.46±144.49)/mm2, although the difference was not significant (P>0.05; Figure 1, Table 2).
The mean MVD values in the control and IVR groups were(142.25±19.16) and (130.62±15.46)/mm2, respectively,representing significantly higher MVD in the IVR group(P<0.05; Figure 2, Table 2).

Figure 1 Histological analysis of fibrovascular membrane samples from patients with proliferative diabetic retinopathy H-E stained sections of the control group (A) and the IVR group (B) showing FVM visualized by light microscopy (×100; scale bar, 100 μm) and changes in the histological morphology of FVMs in patients treated with or without ranibizumab. Arrows indicate microvessels and many cells are visible infiltrated in the stroma. There was no significant difference in infiltrated cells between the two groups (P>0.05). IVR: Intravitreal ranibizumab;FVM: Fibrovascular membrane; H-E: Hematoxylin-eosin.

Table 1 Clinical and demographic characteristics of study participants

Table 2 Comparison of cell density and MVD of FVM in the two groups
Glial-Mesenchymal Transition in Fibrovascular MembranesAll tested sections from both groups were strongly immunostained for both GFAP and α-SMA. The mean PCC values of the two markers in the control group were 0.764±0.08 and 0.783±0.06, respectively. There were no significant differences between the two groups, and the two markers were strongly co-localized in both groups (P>0.05).Areas of positive staining for GFAP and α-SMA were mainly cells scattered within the stroma, but there was also staining of vessel walls. These data support the hypothesis that GMT is involved in the pathology of FVM (Figure 3).
Effect of VEGF Inhibition on Glial-Mesenchymal Transition of Fibrovascular MembranesThe expression of GFAP and α-SMA expression differed significantly between the two groups, with the expression of GFAP significantly lower (P<0.05) and α-SMA significantly higher in the IVR group (P<0.05; Figures 4 and 5). The mean GI in the IVR group was 1.10±0.10, which was significantly lower than in the control group (1.21±0.12,P<0.01), indicating that the IVR can down-regulate glial activity and accelerate fibrosis in FVM through GMT pathology (Figure 6).
DISCUSSION
In this study, we confirmed that activated glial cells and GMT participate in the formation of FMVs in PDR. Additionally, we discovered that IVR has positive effects on vessel regression by reducing MVD, downregulating glial activity, and promoting GMT, thus alleviating GI; however, no change in cell density was observed in FVM in response to inhibition of VEGF.
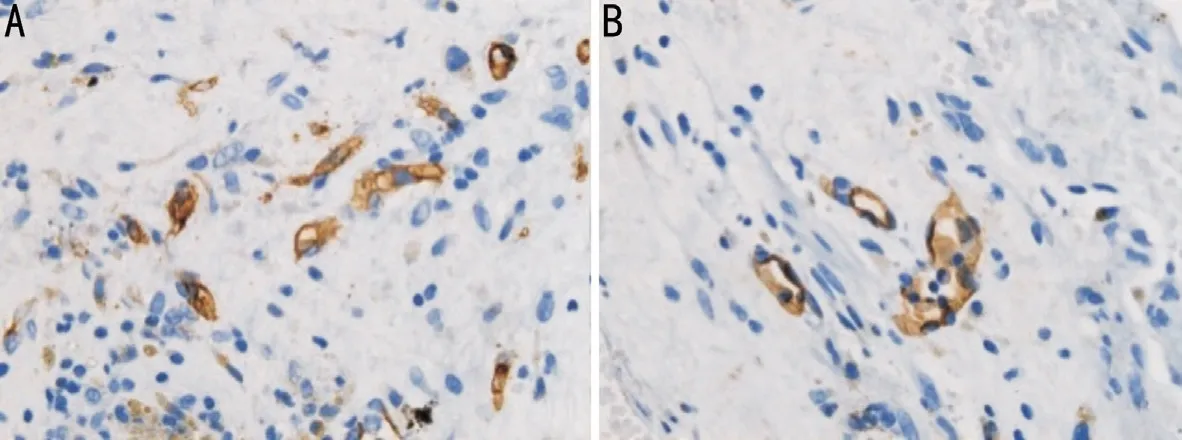
Figure 2 Immunohistochemical analysis by light microscopy Differences in MVD between the control group (A) and IVR group (B).Microvessel outlines are highlighted by staining for the vascular endothelial cell marker, CD31. MVD was evaluated in areas containing the most discrete vessels by counting the number per 400× field (×400; scale bar, 25 μm). IVR: Intravitreal ranibizumab; MVD: Microvessel density.

Figure 3 Expression and colocalization of two markers of the glial-mesenchymal transition in FVM samples from patients with proliferative diabetic retinopathy GFAP (A, green) and α-SMA (B, red), were strongly immunostained and co-localized in the FVM (D).Nuclei were labeled with DAPI (C, blue). GFAP+/α-SMA+ cells were spindle-shaped and distributed in the stroma; however, there was also positive staining of the vessel walls (×200; scale bar, 50 μm). FVM: Fibrovascular membrane; GFAP: Glial fibrillary acidic protein; α-SMA:α-smooth muscle actin.

Figure 4 Immunofluorescence analysis of markers of the glial mesenchymal transition in fibrovascular membrane samples from patients with proliferative diabetic retinopathy A: ×200; scale bar, 50 μm; B: ×400; scale bar, 25 μm.
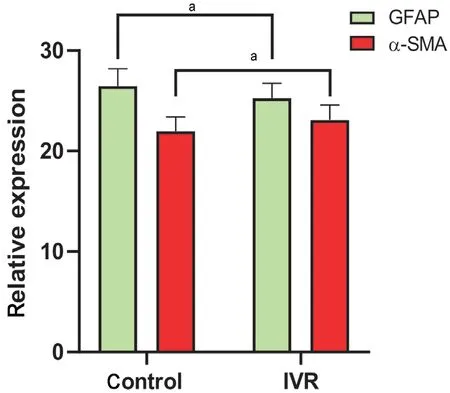
Figure 5 Differences in the relative expression levels of GFAP and α-SMA in the two groups Relative expression of GFAP was significantly higher, and that of α-SMA significantly lower, in the control group relative to the IVR group. Student’s t-test was used for statistical analysis, aP<0.05. IVR: Intravitreal ranibizumab; GFAP:Glial fibrillary acidic protein; α-SMA: α-smooth muscle actin.
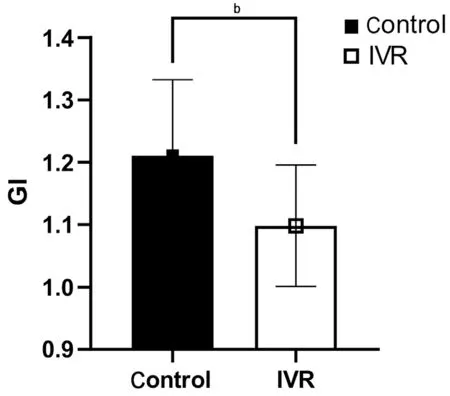
Figure 6 Comparison of the glial-mesenchymal transition index(GI) between the two groups The mean GI in the IVR group was(1.10±0.10), which was significantly lower than in the control group(1.21±0.12). bP<0.01. IVR: Intravitreal ranibizumab.
Anti-VEGF agents can down-regulate inflammatory cell infiltration by restoring tight junctions between vascular endothelial cells or pericytes in the retina or cornea during pathological conditions[22-23]. Jiaoet al[18]demonstrated that bevacizumab, an anti-VEGF agent, induces apoptosis of cells within FVMs, while cell counts were not significantly alleviated, consistent with our conclusion. We did not detect any effect of IVR on FVM cell density, likely because cell density was evaluated by H-E staining, which shows only cell nuclei, rather than apoptotic cells. Furthermore, in FMV tissues, local cells were mainly hyalocytes, myofibroblasts,fibroblasts, and an abundance of glial cells migrated from the posterior vitreous cortex or the superficial retina, rather than leaking from the capillaries or micro vessels in retina or FVMs[4,24].
VEGF concentration in vitreous fluid is a classic marker for evaluating angiogenesis activity in PDR[25]. MVD, a quantitative index of neovascularization used to evaluate angiogenesis activity and tumor intravasation[26], has also been applied to assess FVM activity in PDR[27]. We selected CD31 as a marker of mature vascular endothelial cells, rather than CD34, which is used to identify mesenchymal-derived vascular endothelial progenitors or peripheral hematopoietic cells[28-29],to outline vessels and calculate MVD. In our study, we found that the mean MVD in the control group was (142.25±19.16)/mm2,while Abu El-Asraret al[27,30]reported MVD values in FVM of 122.5±44.6 or 70.0±14.3 in an area of 0.33×0.22 mm2in patients with active PDR and neovascularized optic discs, which are relatively high compared to our findings. Furthermore,Tsanouet al[9]reported MVD values of 10.8 per high-power magnification (×400) in FVMs. These differences probably reflect variation in the proliferative stage of the PDR when tissues were collected.
Nakaoet al[31]revealed that intravitreal injection of bevacizumab(IVB) alleviated blood density by decreasing the intraluminal area of blood vessels compared to untreated FVM. Regarding the mechanism underlying the inhibitive effect of anti-VEGF therapy on the MVD of FMV, they concluded that VEGF inhibition can induce vessel contraction, rather than vessel regression. Our study also showed that MVD decreased after inhibition of VEGF, revealing that ranibizumab can alleviate angiogenesis activity in FVM, similar to the conclusions of previous studies that intravitreal injections of anti-VEGF drugs can reduce VEGF expression or vascular density in active FVM of patients with PDR[32-34]. Kohnoet al[35]showed that IVB 2d before vitrectomy regress vessels by inducing vascular endothelial cell apoptosis in FVMs of patients with PDR. In addition to histological observations, Huet al[36]quantified the regression of neovascularization using optical coherence tomography angiography and observed a plateau of blood flow regression 3d after intravitreal injection of conbercept, another anti-VEGF drug. Contrary to our approach, Nakaoet al[31]selected CD34 to evaluate MVD of MVD of FVM in patients with PDR and found no significant reduction in MVD 4 to 14d after IVB; however, VEGF immunoreactivity decreased significantly in FVMs after IVB, relative to control eyes treated with PRP only. Thus, the authors speculated that inhibition of VEGF temporally reduces blood flow in new vessels and alleviates vessel leakage by reducing fenestrations between vascular endothelial cells, rather than reducing the structures of detectable capillaries described histologically[31]. Furthermore,the conclusions of Pattwellet al[37]also did not support the phenomenon of vessel regression in FVM after IVB, and their findings revealed that side effects of the vasoconstrictive response to anti-VEGF therapy can increase the constrictive force of FVM. These authors observed that blood-containing lumens were still present after IVB; however, they did not assess the number of vessels and did not provide details of the patient’s history of pan retinal photocoagulation therapy. Based on all the findings discussed above, we speculate that the shortterm effects of IVR on FVM angiogenesis include temporary reduction in blood flow combined with alleviation of MVD,likely through vessel vasoconstriction and reduced expression of CD31 caused by EMT, combined with induction of vascular endothelial cell apoptosis in FVM[14].
GFAP immunoreactivity is positively correlated with glial activity or epiretinal membrane gliosis[4]. Consequently,activated Müller cells have the potential to transform into myofibroblasts, characterized by downregulation of GFAP combined with increased de novo α-SMA expression,demonstrating that GMT participates in fibrotic transformation and contributes to the formation of contractive forces in the retina[38-39]. We also found that GMT participates in the pathology of FVM in patients with PDR, based on the strong colocalization of GFAP and α-SMA. We did not investigate further the origins of GFAP-positive cells in FVMs. A previous study showed that GFAP-positive cells in epiretinal membranes (ERM) were not pure glial cells and that some of them expressed progenitor cell markers, indicating the potential for self-renewal[40]. Regarding the phenotype of glial cells, previous studies have demonstrated that GFAP immunoreactivity is observed primarily in activated Müller cells or glial cells, and generally not in microglia cells, as these originate from macrophages that do not express GFAP in FVMs of patients with PDR[41-42].
Our findings indicate that IVR reduces glial activity, promotes GMT, and leads to the maturation of FVM in PDR, by alleviating GI. The mean GI value of active FVM in controls was 1.21±0.12, on the contrary, the GI was 1.10±0.10 in IVR group, revealing an accelerated glial-fibrotic shift in FVMs after anti-VEGF therapy. In an evaluation of the degree of GMT and influencing factors, Krishna Chandranet al[43]reported that vitreous components play a critical role in GMT in idiopathic ERMs (iERMs). They classified iERM into two forms according to the relative expression of GMT genes, and demonstrated that iERM undergoing partial GMT were associated with more severe clinical and Spectral domain-optical coherence tomography (SD-OCT) features than those undergoing complete GMT, with upregulation of genes encoding cell proliferation and a lack of clear regulation of genes encoding mesenchymal markers, such as α-SMA, in complete GMT, with consistent downregulation ofGFAP-encodingMüller cell/glial markers, in parallel with upregulation of myofibroblast markers[43]. Thus, we infer that elevated α-SMA expression is correlated with less proliferative or glial activity and greater improvement of epiretinal membrane pathology. In this study, we found that FVMs tended to be closer to complete GMT after IVR therapy.Regarding the underlying mechanism, the promotion of gliosis of activated glial cells into fibrosis is induced by cytokines or profibrotic factors in the microenvironment[44-45]. Anti-VEGF agents cause structural protein abnormalities in cultured Müller cells, with decreased levels of GFAP and vimentin, probably due to the VEGF family receptors expressed in Müller cells[46-47]. Another way in which IVR can promote GMT is the neutralizing influence of VEGF on the inductive effects of released profibrotic factors, such as transforming growth factor(TGF)-β[48-49], which is supported by previous studies showing that α-SMA or fibronectin in myofibroblasts depends on profibrotic cytokines, and that GMT in diabetic fibrovascular proliferation is driven by autoinduction of TGF-β in Müller glial cells[15,50].
In conclusion, our study describes the histological changes in FVM in patients with PDR after IVR and demonstrates that IVR can reduce FVM angiogenesis and glial activity by alleviating MVD and stimulating GMT characterized by regulation of the gastrointestinal system. A deeper understanding of these processes could shed light on molecular signaling pathways or profibrotic cytokines involved in the promotion of GMT.
ACKNOWLEDGEMENTS
Foundation:Supported by the Tianjin Key Medical Discipline(Specialty) Construction Project (No.TJYXZDXK-016A).
Conflicts of Interest:Liang ZY,None;Wang YP,None;Li J,None;Yang WC,None;Tu YF,None;Zhang Y,None;Chen S,None.
 International Journal of Ophthalmology2022年10期
- International Journal of Ophthalmology的其它文章
- Lacrimal sac lymphoma: a case series and literature review
- Age-related changes of lens thickness and density in different age phases
- Therapeutic potential of pupilloplasty combined with phacomulsification and intraocular lens implantation against uveitis-induced cataract
- Prophylaxis with intraocular pressure lowering medication and glaucomatous progression in patients receiving intravitreal anti-VEGF therapy
- Optimal timing of preoperative intravitreal anti-VEGF injection for proliferative diabetic retinopathy patients
- Prognosis value of Chinese Ocular Fundus Diseases Society classification for proliferative diabetic retinopathy on postoperative visual acuity after pars plana vitrectomy in type 2 diabetes