
Phylogenetic Relationships among Chinese Rice Frogs within the Fejervarya limnocharis Species Complex (Amphibia: Dicroglossidae)
2023-01-05 03:03KunYANGYubinWOGangSHAOPinghuLIAOHaojieTONGRichardBROWNandYuantingJIN
Asian Herpetological Research 2022年4期
Kun YANG ,Yubin WO ,Gang SHAO ,Pinghu LIAO ,Haojie TONG ,Richard P.BROWN* and Yuanting JIN*
1 College of Life Sciences,China Jiliang University,Hangzhou 310018,Zhejiang,China
2 Ningbo Beilun District Center for Disease Control and Prevention,Ningbo 315000,Zhejiang,China
Abstract We present a molecular assessment of the widely-distributed rice frog (Fejervarya limnocharis)which provides many new samples that add to knowledge of their phylogeography within China and considers genetic support for five Chinese species within this complex.Two mtDNA fragments from 270 individuals and eight nuclear DNA loci (105 individuals) were sequenced from specimens sampled from across China.Data from nine specimens from China,Indonesia and Japan were also retrieved from previous studies.MtDNA was informative about population divergence within China and indicated one major clade (with four subclades) from South China and the Zhoushan Archipelago,Zhejiang,China,and a second major clade (with eight subclades) from other parts of China.Recent demographic expansions (less than 50ka ago) were detected within three of these 12 subclades,potentially associated with lowered sealevels after marine transgressions.Notably,most frogs from the previously unstudied Zhoushan Archipelago(eastern China) were found to be closely related to Japanese populations.BPP and STACEY species delimitation analyses of the multilocus data favoured five candidate species within the complex.Previous work had described Fejervarya multistriata and F.kawamurai from the Chinese mainland although here we detected considerable genetic divergence within the latter and found that this may be indicative of two species.One of these corresponds to the Zhoushan Archipelago,Zhejiang,China and Japan,and the other from most parts of Chinese mainland.This study provides a large multilocus dataset that contributes to the systematics of this species complex.
Keywords amphibian,Asia,genetic structure,phylogeography,population expansion,Zhoushan Archipelago
1.Introduction
Systematics studies at the species level are important not only to determine the most fundamental taxonomic units but also to provide important insights into the historical biogeography of different regions.There has been a significant number of phylogeographic and systematics studies of intraspecific genetic variation in eastern Asia over the last 15 years,which have largely focused on specific regions such as the Qinghai-Tibet Plateau or the north-west Pacific (Favreet al.,2015;Muellner-Riehl,2019;Niet al.,2014).However,there is generally less known about intraspecific patterns than in some other regions,such as Europe and North America.Moreover,very few studies have addressed widespread terrestrial animals that are found across major geographical areas.
Analyses that use the multispecies coalescent to analyze groups of sequences are useful tools for detecting population or species splits as well as examining the relationships between them (Heled and Drummond,2010;Leachéet al.,2019;Yang and Rannala,2010).Irrespective of differences in interpretation about whether groups represent divergent populations or valid species,they allow probabilistic assessment of several important characteristics of the species (or population) tree including its topology,the likely number of species and the times at which different species (rather than DNA sequences) diverged.They have been used to help reveal new species or hidden evolutionary significant units (ESUs) in systematic biology studies (Behroozet al.,2018;Casacciet al.,2014).They can greatly complement traditional morphological taxonomy studies by providing robust insights into population/species divergence histories,therefore allowing improved assessment of species proposals.
Here we examined the Asian rice frogs,a species complex generally known asFejervarya limnocharisGravenhorst,1829.The species is distributed widely across central and southeastern China,southeast Asia and Japan (Zhonget al.,2008;Djonget al.,2011;Kotakiet al.,2010).Interestingly,there is considerable morphological variation within the rice frog which has led to taxonomic debate (Matsuiet al.,2007;Veith,2001).Using mtDNA control region (D-loop) sequences,analyses of this group revealed two distinct lineages within China: the Yangtze River lineage and the southern lineage (Zhonget al.,2008).
Four species have been proposed within the rice frog complex on the basis of morphological or molecular divergence:(1)F.kawamuraiDjong,Matsui,Kuramoto,Nishioka,Sumida,2011;found on the Japan and possibly throughout northern and central China,and western Taiwan,China;(2)F.sakishimensisMatsui,Toda,and Ota,2008;from the Iriomote and Ishigaki islands (southern Ryukyus) of Japan and eastern Taiwan,China (Djonget al.,2011);(3)F.multistriataHallowell,1861;from southeast Asia and adjacent areas in southern China (Djonget al.,2011;Feiet al.,2002;Matsuiet al.,2007);(4) populations from the Orchard and Green islands in southeastern and eastern Taiwan,China seem to form a monophyletic group and could represent a distinct species (discussed by Djonget al.,2011 who described them as “Fejervaryasp.”).
In addition to their taxonomic uncertainty,very few studies have addressed the distributions of the four recognized lineages (Zhonget al.,2008).Within China,Zhonget al.(2008)investigated the mtDNA phylogeography of all Chinese populations,which they considered to beF.multistriata,following Feiet al.(2002).They did not obtain well-supported phylogenetic trees but detected two lineages: a Yangtze lineage(within the drainage system of the Yangtze River) and a southern China lineage (Zhonget al.,2008).It has since become apparent that the Yangtze lineage could be grouped with central Chinese and Japanese populations (i.e.,F.kawamurai) while the southern Chinese lineage corresponds to the south AsianF.multistriata(see discussion in Djonget al.,2011).Nonetheless,there is still uncertainty about populations from unstudied areas,such as the Zhoushan Archipelago (and adjacent coastal areas in eastern China).These islands are of biogeographical interest because they harbor differentiated lineages of several groups,e.g.,the Zhoushan cobra (Linet al.,2008),the batPipistrellus abramus(Weiet al.,2010) and the toadBufo gargarizans(Tonget al.,2017).It is also rather notable that three of the proposed species (F.kawamurai,F.multistriataandFejervaryasp.) within the complex have been detected within the relatively small region of Taiwan,China,and its neighboring islands (Djonget al.,2011).Hence,despite considerable previous work on the complex (e.g.,Djonget al.,2011;Matsuiet al.,2007;Zhonget al.,2008),more systematics research is required to establish relationships within this group (Kotakiet al.,2010).
In this study,we contributed a large amount of newly generated mtDNA and nuDNA sequence data from Chinese populations to the existing data from the rice frog complex.The aims were to: 1) examine the phylogeography of the Chinese populations within this complex,2) assess the overall lineage diversity of these populations relative to other members of complex,3) examine whether the multilocus data provided statistical support for delimitation of divergent groups into distinct species.
2.Materials and Methods
2.1.SamplingGenetic data were obtained from 270 individuals from sites in China (obtained between July 2016 and September 2017) which comprised (1) Zhoushan Archipelago: 119 individuals from 25 sites,(2) Hainan: 4 individuals from one site and (3) other regions of China: 147 individuals from 20 sites (see Supplementary Table S1 and Figure S1).Tissue samples (mostly muscle from toes) were stored in ethanol immediately after sampling,and subsequently maintained at 4℃.Fieldwork and tissue sampling authorization were performed in accordance with guidelines from the China Council on Animal Care and approved by the Ethics Committee of Animal Experiments at China Jiliang University.
DNA sequences from 9 additional specimens were retrieved from GenBank (from Kotakiet al.,2010),and comprised rice frogs from the following areas: China,Indonesia and Japan,and labelled asFejervarya limnocharis(also referred to asFejervaryasp.by Djonget al.2011) (n=4),F.sakishimensis(n=2),andF.multistriata(n=2) (see Supplementary Table S1 and Figure S1).Sequences from an outgroup taxon (Fejervarya triora) were also used for some analyses based on phylogenetic relationship within theFejervarya genus(Kotakiet al.,2010).
2.2.DNA extraction,amplification,and sequencingTotal DNA was extracted from the 270 Chinese rice frog tissue samples with a universal genome extraction kit (Sangon Biotech (Shanghai) Co.,Ltd.) following the manufacturers protocol.Two pairs of primer were designed for amplification of two mtDNA regions: i)ND1-ND2containing subunits one and two of the NADH dehydrogenase (ubiquinone) complex and ii)Cytb-CRcontaining cytochrome b,tRNA and control region sequences (see Supplementary Table S2).A cytochrome b region situated withinCytb-CRwas also available for the Genbank specimens.Eight modified pairs of primers that have been described previously (Bossuyt and Milinkovitch,2000;Kotakiet al.,2008,2010) were used for amplification of the following eight nuclear loci: i) C-X-C Motif Chemokine Receptor 4 (CXCR4),ii) Tyrosinase (Tyr),iii) Rhodopsin (Rhod),iv) 3’ portions of recombination activating 1 (3RAG-1),v) 5’portions of recombination activating 1 (5RAG-1),vi) Brain Derived Neurotrophic Factor (BDNF),vii) sodium-calcium exchanger (NCX1),viii) recombination activating 2 (RAG-2) (see Supplementary Table S2).These loci were amplified in 105 specimens selected from all localities to cover a wide geographical area and all mtDNA lineages.PCR products were sequenced by Sangon Biotech (Shanghai) Co.,Ltd.These loci were selected as they were homologous with those in nine Genbank specimens (Supplementary Table S1).Sequencing chromatograms were spliced using SeqMam software in DNAstar v.7.10 (Nystuen,2001) and aligned using ClustalX(Thompsonet al.,1997).Nuclear sequences were phased using DnaSP v5 (Librado and Rozas,2009) to allow phylogenetic analyses of alleles detected at each locus.
2.3.MtDNA analyses of Chinese rice frogsThe mtDNA sequences (Cytb-CRandND1-ND2,from 270 individuals,plus the outgroupF.cancrivorafrom Genbank EU652694) were used to investigate phylogeographic and demographic patterns within previously poorly sampled regions of the eastern China including Zhoushan Archipelago.Although nuclear loci were available for 105 specimens they showed relatively few variable sites within China and so were not used.The sequences were divided into the following five data partitions: 1st and 2nd (cp1 and 2) and 3rd (cp3) codon positions within theND1andND2gene codon sites,cp1 and 2 and cp3 within theCytbgene,tRNA and control region (see Table S3).Gene trees were inferred using both the Bayesian approach implemented in MrBayes v.3.2.6(Ronquist and Huelsenbeck,2003) and the maximum likelihood(ML) approach in RAxML v.8.2.11(Stamatakis,2014).
The best DNA substitution model for each partition was assessed using MrModeltest v.2.3a (Nylander,2004) and then implemented within MrBayes.Details on prior setting and substitution models are listed in Supplementary Table S3.Markov chain Monte Carlo (MCMC) analyses were run for 9 million generations,trees were sampled every 500 generations and the first 1800 sampled trees were discarded as burn-in.
The ML tree was obtained using the raxmlHPC-PTHREADS command in RAxML.Following the use of MrModeltest,the GTRGAMMA model of DNA substitution was the most suitable available model for each partition.A total of 1000 bootstrap replicates were generated.
Historical demographic changes within five identified Chinese mtDNA groups that contained over ten individuals for each group were analyzed using two approaches.First,the mismatch raggedness indices (Excoffier and Schneider,1999),Tajima’sD(Tajima,1989) and Fu’sFsvalues (Fu,1997)were obtained using 1000 simulations (Program: Arlequin v.3.5) (Excoffier and Lischer,2010).Second,coalescent Bayesian skyline plots (BSPs) were generated using BEAST v1.8.2.A substitution rate of 0.957% per lineage per million years was used for this analysis based on an estimated divergence date of 10Ma for theND2divergence between European and AsianBufotoads (from Maceyet al.,1998).This rate appeared reasonable given the relative homogeneity ofND2rates across reptile and amphibian lineages (Maceyet al.,2001).Also,for greater reliability,the analyses used only sites that were homologous with theND2fragment analysed by Maceyet al.(1998).
23 Who knows what may not happen before that? thought the miller s daughter; and besides, she saw no other way out of it,24 so she promised the manikin what he demanded,25 and he set to work once more and spun the straw into gold
2.4.Species delimitation analysesThe general aim was to use the 279 nuclear and mtDNA sequences for multispecies coalescent species delimitation analyses (sequences are listed in Supplementary Table S1).These analyses examined levels of genetic support for the four previously-proposed rice frog species within the complex (Djonget al.,2011;Kotakiet al.,2010;Matsuiet al.,2007;Zhonget al.,2008) although one of these was also separated into two candidate species.We therefore examined support for a total of five candidate species (described below) using the eight nuclear loci plus the mtDNA locus.
Prior to these species tree analyses,we assessed mitonuclear discordance through analyses of nuclear and mtDNA gene trees.The same sequences (collapsed into haplotypes) that were used in the species delimitation analyses described below were used although the outgroup (Fejervarya triora: Supplementary Table S1)was also included.ML trees were estimated using haplotypes identified for: i) all eight phased nuclear loci (unpartitioned),ii) homologous mtDNA (Cytb,partition by codon position)sequence present in new specimens (note that we only usedCytbsequences because they were homologous with sequences used in previous studies that we wished to include).In both cases,partitioning was guided by PartitionFinder (Lanfearet al.,2017).The raxmlHPC-PTHREADS command within RAXML (Stamatakis,2014) was used,with the GTRGAMMA substitution model.Statistical support for nodes was derived from 1000 bootstrap replicates.
The five specified candidate species that were tested in the multispecies coalescent analyses were mainly based on previously proposed species and the same names are used wherever possible (see Introduction for general details on these species).The candidate species were: i) rice frogs from the Iriomote and Ishigaki islands of Japan,and those from northeastern Taiwan,China (here,all described as “F.sakishimensis”),ii) rice frogs from Orchard and Green islands of southeastern Taiwan,China (Fejervaryasp.),iii) rice frogs from Thailand,Cambodia,Malaysia,Indonesia and adjacent areas in southern China (here,F.multistriata),iv) populations from the Hiroshima,Japan,and the Chinese Zhoushan Archipelago and some peripheralF.kawamuraiareas of south-central eastern China (such as Guangzhou and Guangxi),which includes populations that seem to have been assigned toF.multistriata(Djonget al.,2011) (here;F.kawamurai-ZS),v) north-central China populations,formerly described asF.kawamurai(here;F.kawamurai-NCC).The justification for splittingF.kawamuraiinto two candidate species (F.kawamurai-ZSandF.kawamurai-NCC) followed from the initial mtDNA analyses of Chinese populations which showed a major/deep well-supported basal split (see later).Rather than ignore this split,we examined more general genetic support for it using all nine loci in our species tree analyses.
Species trees were analyzed using the Bayesian multispecies coalescent approaches implemented within the programs BPP v4.30 (Yang,2015) and STACEY v.1.2.5 (Jones,2017).All nine loci were used,i.e.,the mtDNA (Cytb) and eight nuclear loci.The analyses used all new specimens sequenced in this study,for which all loci were available (n=105),together with sequences(from eight individuals) that originated from Kotakiet al.(2010).BPP and STACEY allow assessment of support for different numbers of species,and the historical relationships among them,but implement quite different algorithms.Both programs allow specified candidate species to be lumped with one another but not split into additional species.
BPP analyses (using the A11 configuration) provided posterior probabilities for different numbers of species and tree topologies.Unlike STACEY,it implements a reversible jump algorithm that allows the MCMC chain to move between species trees with any number of tips,up to the maximum number of candidate species proposed,which leads to changes in the parameterization of the species tree.BPP requires specification of priors on population sizes and divergence times.Inverse-gamma (INVG) priors were used to accommodate scenarios that implied different population sizes(θ) and divergence times (τ).Preliminary estimates suggested the most appropriate prior specification was: θ INVG (1.2,0.006),τ INVG (1.2,0.0005) and this was run in triplicate (from different starting positions) to ensure convergence on the same posterior(50000 post burn-in samples taken from a chain run for 2.5 million steps).Additional analyses with different priors were used to ensure that the results were not overly-sensitive to the population size and divergence time priors,as follows: i) smaller population size with more recent divergence time,θ INVG (1.2,0.0006),τ INVG (1.2,0.00005);ii) larger population size with longer divergence time,θ INVG(1.2,0.06),τ INVG(1.2,0.005);iii)larger population size but more recent divergence time,θ INVG(1.2,0.06),τ INVG (1.2,0.00005);iv) smaller population size with longer divergence time,θ INVG (1.2,0.0006),τ INVG (1.2,0.005).
Equivalent analyses were carried out using STACEY combined with the associated SPECIESDELIMITATIONANAL YSER (Jones,2017).STACEY was implemented within BEAST ver2.6 (Bouckaertet al.,2014).A primary difference from BPP is that the problem of different numbers of parameters arising under different species delimitations is overcome using a particular birth-death model for the species tree that allows effective collapse of node heights close to zero.These collapsed nodes continue to exist,leaving the parameter space unchanged despite effective changes to the number of tip species.Another difference is that population size parameters are constant along each branch and integrated out,rather than being sampled.These aspects,together with newly-developed operators seem to allow good convergence,particularly when compared with *BEAST species tree analyses (Jones,2017).Here,the tree prior was specified from a Birth-Death-Collapse model,with a collapse height of 1×10⁻⁴(which specified the upper limit at which the node height is considered to be zero) the difference between birth and death rate,μ-λ=100,and the death rate relate to birth rate,μ/λ=0.5.The Jukes Cantor substitution model (as implemented in BPP) was used for all loci,except mtDNA where the HKY model was used to accommodate greater sequence divergence.The strict clock model was used for all loci,with priors specified from an inverse gamma distribution with parametersα=10,β=1.Collapse weight for species was specified as uniform using a Beta distribution,with both parameters set to 1,giving equal weight to any number of species between 1 and 5.Finally the popPriorScale prior was specified from a lognormal distribution with mean of–7 and standard deviation of 2.The MCMC was run for 2.5×10⁸steps and sampled every 104steps (three replicates).
3.Results
3.1.SequencingMtDNA and nuclear sequences were obtained for all 270 Chinese specimens.The total aligned lengths/numbers of variable positions for individual loci were as follows: 2596/392 bp for mtDNA (ND1-ND2869/97 bp,Cytb-CR1729/295 bp) and for nDNA: 731/32 bp (3RAG-1),877/64 bp (5RAG-1),441/7 bp (BDNF),651/19 bp (CXCR4),770/9 bp(NCX1),869/41 bp (RAG-2),290bp/1 (Rhod) and 661/43 bp (Tyr).
The first of these included four well-supported groups from the following regions in China: Guangxi (A);Guangzhou (B);Pinghu,Zhejiang (ZJPH) (C);the Zhoushan Archipelago (the majority of samples from this area) and the adjacent Hangzhou Bay area,Zhejiang (two samples) (D) (Figure 1).The second major mtDNA subgroup consisted of eight major subgroups(of which seven were well-supported by posterior probabilities>0.98 from the Bayesian analysis but only two were supported by bootstrap values >70% from the ML analysis) from the following regions in China: Hainan (E);Zhejiang province in eastern China along with some samples from the Zhoushan Archipelago (Jintang Island and the Dongji islands) that did not overlap with subgroup D (F);coastal areas of Zhejiang province and Jintang Island along with two individuals from Henan province,west of Zhejiang (G);Henan and Anui Provinces,and some western areas of Zhejang province (H);Hunan province(south of Zhejiang and Henan) (I);Guizhou (east of Hunan) (J);Henan (Xinyang) (K);Zhejiang and Shanghai Lucao,Anhui,Jiangxi and Hunan,which are close to Zhejiang,along with an individual from Henan (Tanghe) (L) (Figures 1 and S2).Groups,F,G and H showed overlapping distributions in Zhejiang province.
Non-coalescent demographic analyses were only carried out on the more diverse mtDNA lineages,B,D,G,H and L,within which the sequence data contained a reasonable number of informative sites.This indicated rapid recent expansion within three of these: D,G and L (see Table 1 for details).The coalescent skyline test also suggested recent population demographic expansions 25~35 ka ago in D and L and a slightly more recent expansion in G (Figure 2).
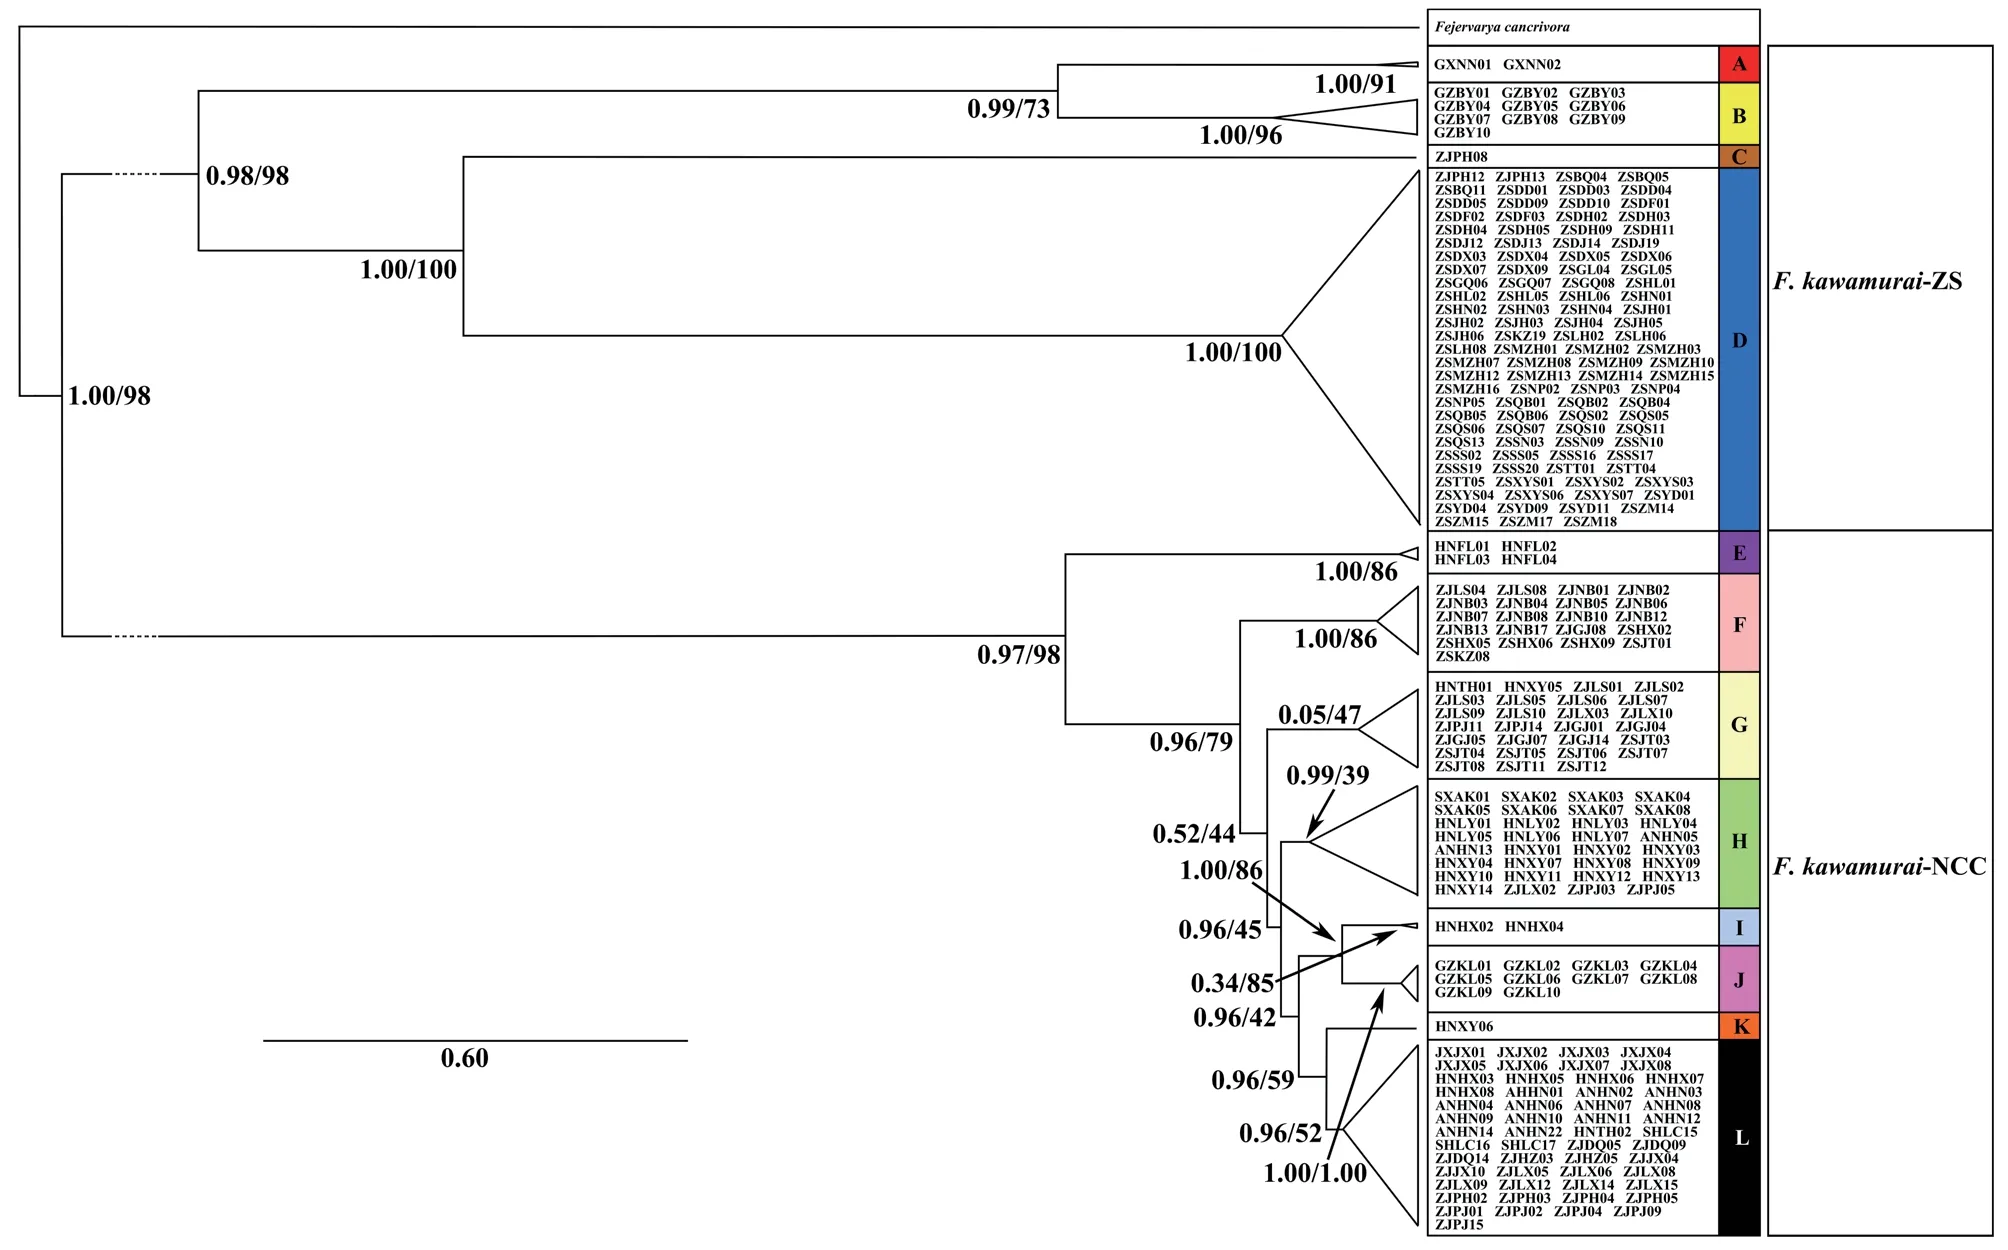
Figure 1 Phylogenetic trees of Chinese Fejervarya limnocharis from partitioned analyses using mtDNA haplotypes (Cytb-CR and ND1-ND2).Specimens found within each mtDNA group (A-L) are labelled and correspond to the full list provided in Table S1.Values on branches represent MrBayes posterior probabilities/RAxML bootstrap support values,respectively.
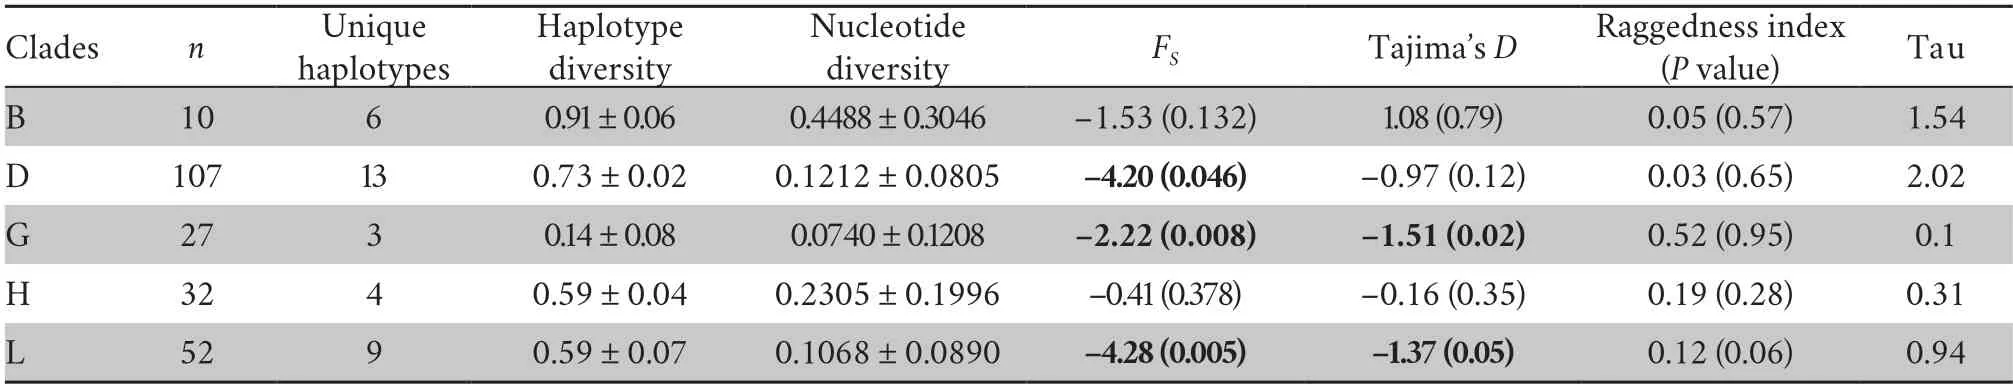
Table 1 Summary statistics for Chinese mitochondrial clades.Haplotype diversity,nucleotide diversity,FS,Tajima’s D and raggedness indices were estimated from ND1-ND2 sequences.
3.3.Species delimitation analysesPreliminary analyses of gene trees for the individual loci used for the species tree provided generally low levels of support (bootstrap value <50 for most nodes) and did not support general phylogenetic discordance between nuclear and mtDNA markers (Figures S3–S4).Concatenation of rice frog nuclear sequences revealed 92 haplotypes (excluding theF.trioraoutgroup) (Table S4).The nuclear tree using concatenated sequences was poorly resolved with low bootstrap support on the nodes (Figure S3).Only two major nodes had support over 70%: support for the ancestral node forF.sakishimensisandFejervaryasp.was 96%,while a large group of sequences with low divergence,comprising allF.kawamurai-ZS and the majority of theF.kawamurai-NCC haplotypes had 72% bootstrap support (Figure S3).MtDNA sequences were collapsed into 26 ingroup haplotypes and the ML tree showed generally higher node support than the nuclear tree (Table S5 and Figure S4).The net uncorrected cytochrome b divergences between the five candidate species are provided in 2.In the mtDNA tree (Figure S4),Fejervaryasp.(also referred to asF.limnocharisfrom Orchard Island in Djonget al.,2011) mtDNA haplotypes formed an outgroup to all other rice frog haplotypes,withF.sakishimensishaplotypes also forming an outgroup relative toF.kawamuraiandF.multistriatahaplotypes.Remaining haplotypes fall into two groups with bootstrap support for the respective ancestral nodes of 96% and 82%,although the node ancestral to both these groups is only weakly supported (40%).The first of these groups comprises eleven haplotypes and includesF.kawamurai-NCC and allF.multistriataindividuals,withF.multistriataoriginating from the more basal nodes within the group.There is a tendency for Hainan haplotypes to group with theseF.multistriatahaplotypes,reflecting a weak pattern that is also observed (but with low support) in the concatenated nuclear tree.The second of these two groups contains twelve haplotypes,which include all remainingF.kawamurai-NCC and allF.kawamurai-ZS haplotypes.
The BPP species tree analysis revealed strong statistical support for the five candidate species that we tested within the rice frog complex,independent of different priors placed on population size and divergence times.Posterior probability(PP) support for a five species delimitation was PP=0.966 for our preferred analysis with θ specified as INVG (1.2,0.006),and τ specified as INVG (1.2,0.0005).We favored this analysis in part because prior and posterior means were very similar,both for θ (0.030 and 0.032,respectively) and τ(0.0025 and 0.0029,respectively) (this was not the case for the other exploratory analyses of the sensitivity of the analysis to these priors).The preferred specification provided very high individual delimitation PPs for each of the five proposed species (PP>0.990 forF.kawamurai-ZS,F.kawamurai-NCC andF.multistriata;PP>0.967 forF.sakishimensisandFejervarya sp).A five species delimitation had greatest support (PP=0.967)in both above analyses and other analyses specifying small population sizes,although we note that overall support for five species was diminished when larger population sizes were specified (PP=0.434 for longer divergence times;PP=0.555 for shorter divergence times).The most strongly favored species tree topology in all analyses presented a ((F.kawamurai-ZS,F.kawamurai-NCC),F.multistriata) lineage that was reciprocally monophyletic with a (F.sakishimensis,Fejervaryasp.) lineage (Figure 3).The only exception to this finding was the aforementioned long divergence time/large population size analysis,in whichF.sakishimensisandFejervaryasp.were grouped as one species.Posterior support for the (((F.kawamurai-ZS,F.kawamurai-NCC),F.multistriata),(F.sakishimensis,Fejervarya sp)) topology was PP=0.750 in our preferred analysis with intermediate priors.
The STACEY analyses also revealed greatest posterior support (PP=0.954) for the five species delimitation.Four species delimitations received much lower support,with a four species delimitation in whichF.sakishimensisandFejervaryasp.were joined as a single cluster being the most strongly favoured of these,but with a PP of only 0.046.The maximum clade credibility tree revealed an identical species tree topology to that favored by BPP.Highest PPs (1.000) were obtained for two nodes: i) the most basal node,representing the split betweenF.multistriataand the remaining species,and ii) the (F.kawamurai-ZS,F.kawamurai-NCC) node.Support for the most recent common ancestor (MRCA) ofF.sakishimensis,Fejervaryasp.was PP=0.910.The node with lowest posterior support (PP=0.548)was that representing the MRCA ofF.kawamurai-ZS,F.kawamurai-NCC andF.multistriata.
4.Discussion
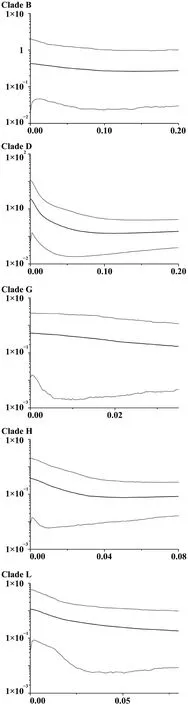
Figure 2 Bayesian skyline plots showing the population growth history of F.limnocharis.Horizontal axis corresponds to time (Ma),and vertical axis represents the product of female effective population size (Ne) and generation time(τ,years × 10−6).
The analyses presented here throw new light on phylogeographical relationships among rice frog populations in China.Our species tree analyses suggest greater genetic diversity within theF.limnocharisspecies complex than previously described.In particular,our sampling across China allowed detection of a deep mtDNA split within the previously proposed speciesF.kawamurai(Djonget al.,2011) and,based on eight nuclear loci and the mtDNA locus,provided initial support for its future delimitation into two new sister species.One of these corresponds to Japan,the Zhoushan Archipelago and some regions close to the coasts of eastern and southern China (here denotedF.kawamurai-ZS),and the other is found in the centre and eastern coast of China,including two of the Zhoushan Archipelago (here denotedF.kawamurai-NCC).
Genetic data also provided evidence that supported full species recognition of the previously-describedF.sakishimensisfrom the Japanese Iriomote and Ishigaki islands,close to Taiwan,China (Djonget al.2011).Furthermore,this group was found to be most closely related to,but distinct from,another proposed species that Djonget al.(2011) referred to as“Fejervaryasp.” from the Orchid and Green islands to the south-east of Taiwan,China.Finally,we find some evidence (albeit weaker)that most Chinese mainland (and Japanese) populations are more closely related to other Asian populations than they are to populations from islands in the East China Sea.Our findings are further supported by the finding of very substantial net pairwise mtDNA divergences of around 7.3% and 9.8% between most pairs of candidate species,with the exception ofF.multistriata/F.kawamurai-NCC (see below).
Mitochondrial control region sequences previously showed that Chinese mainland populations ofF.limnochariswere split into northern Yangtze River basin and southern groups(Zhonget al.,2008).However,this study does not appear to have included sampled sites withinF.kawamurai-ZS,which might explain why it detected just two major mtDNA groups in China (the groups we refer to asF.kawamurai-NCC andF.multistriata).Wider sampling by Zhonget al.(2008) would have revealed that their southern mtDNA group also included populations from the Zhoushan Archipelago,Zhejiang,China and Japan.
We are also able to substantially advance the findings of Kotakiet al.(2010) who provided an impressively wide sample distribution from across Asia,but did not sample any other sites except Husa (adjacent to southeast Asia) within China.This likely explains why they did not detect theF.kawamurai-NCC andF.kawamurai-ZS groups.These two sister groups are separated by a net mtDNA divergence of 10% (Table 2),which is greater than expected within most vertebrate species.It is therefore surprising that the non-sister lineagesF.kawamurai-NCC andF.multistriataare separated by only 1% mtDNA divergence (Table 2).This relationship within the species tree appears to be strongly driven by the nuclear loci:F.kawamurai-NCC andF.multistriataactually show some of the greatest general nuclear divergence between candidate species pairs,similar to that betweenF.multistriataandF.sakishmensis.This cytonuclear discordance may have originated from mtDNA introgression betweenF.kawamurai-NCC andF.multistriata.This is one of several questions for future studies that are raised here.Future genomic and morphological analyses that examine the different major groups that we have identified in greater depth analyses will provide more definitive conclusions.

Figure 3 BPP species tree showing posterior support for nodes.The five species delimitation was supported with a posterior probability of PP=0.967.
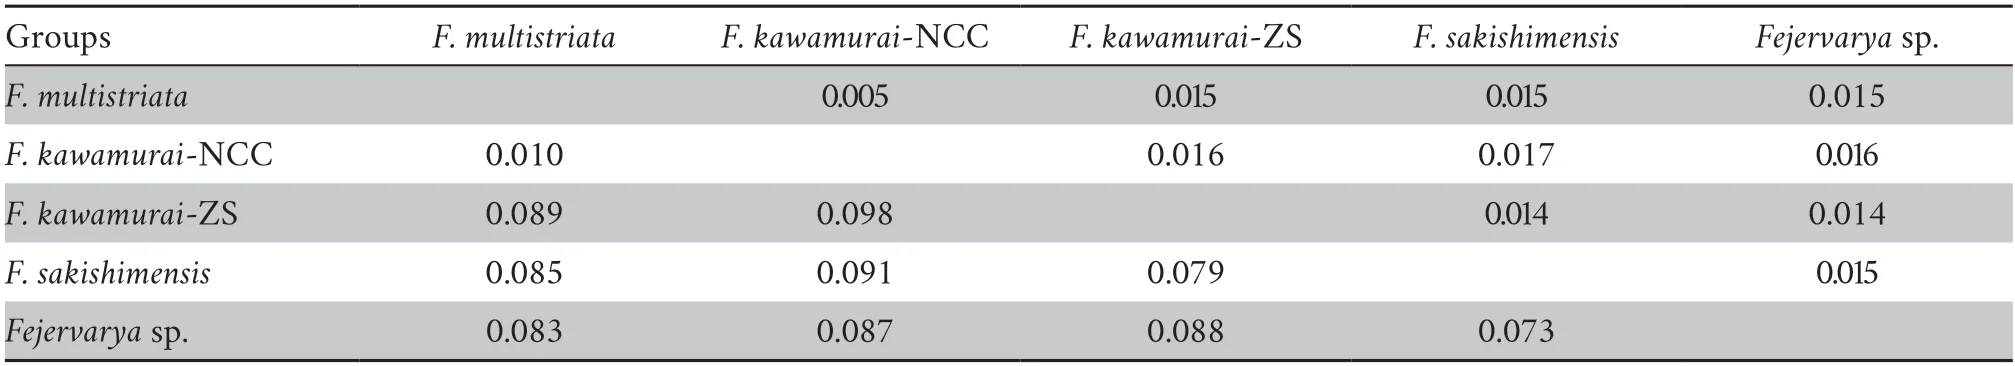
Table 2 Net mtDNA divergence (cytochrome b) between candidate species (lower diagonal) with associated bootstrap standard error estimates (upper diagonal).
Demographic coalescent analyses suggest quite rapid increases in population size within mitochondrial groups from i) neighboring Zhejiang,Jiangxi,Shanghai and Anhui regions close to the east coast of Chinese mainland and neighboring regions and ii) the adjacent Zhoushan Archipelago beginning around 25 000–35 000 ka.There were several late Pleistocene/early Holocene marine transgressions that might have affected the demographics of populations in this area.For example,the Ge Hu marine transgression (starting~40 ka ago) which flooded the area was followed by a drop in temperature,when sea-levels may have reached an all-time low (Linet al.,2012;Wanget al.,1980;Zhanget al.,2008).Large areas of marshland subsequently appeared in what is now the East China Sea and this likely provided opportunities for population expansion for these Zhejiang and Zhoushan groups.Other studies have related marine regression events to the rapid expansion ofPelophylaxfrogs (Dai,2009) andBufo gargarizans(Tonget al.,2017) in the same region.
5.Conclusion
We have added to knowledge of the biodiversity within theF.limnocharisspecies complex by detecting two lineages within the Chinese mainland.These are found withinF.kawamurai,although they included some individuals that would previously have been considered to be within the area occupied byF.multistriata.Overall the species delimitation approach favours five species within the complex,four of which (including“Fejervaryasp.”) have been proposed by previous studies(including two morphology studies).Areas of uncertainty clearly remain,which could be clarified by future studies.More complete sampling of the entire range of the rice frog and analysis of a larger proportion of the nuclear genome will provide more detailed insights into relationships and introgression between Rice frog groups.Nonetheless,this study establishes a new framework for understanding the population history of the rice frog and may help establish a stable taxonomy within this widely-distributed species complex.
AcknowledgmentsThis work was supported by the Natural Science Foundation of Zhejiang Province,China(LY21C040002),and partially by the National Natural Science Foundation of China (41541002).We wish to thank Guowo DING for local specimen contribution.
Appendix
The Tables S1–S5 and Figures S1–S2 can be downloaded from the website https://pan.baidu.com/s/1DOWuYN7qMFeSiDvCjme_QQ?pwd=1407 (access code: 1407).

Figure S3 Cladogram of F.limnocharis from RAxML based on nuclear DNA.Concatenation of rice frog nuclear sequences revealed 92 haplotypes (excluding the F.triora outgroup).The values labelled at the tree nodes show the RAxML bootstrap values.
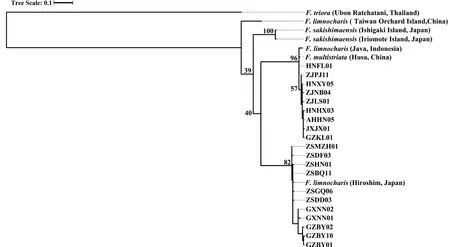
Figure S4 Cladogram of F.limnocharis from RAxML based on MtDNA sequences.MtDNA sequences were collapsed into 26 ingroup haplotypes.The values labelled at the tree nodes show the RAxML bootstrap values.
 Asian Herpetological Research2022年4期
- Asian Herpetological Research的其它文章
- Three New Species of Diploderma Hallowell,1861 (Reptilia: Squamata:Agamidae) from the Shaluli Mountains in Western Sichuan,China
- Application of eDNA Metabarcoding for Detecting Anura in North China
- Lineage Diversification and Niche Evolution in the Chinese Cobra Naja atra(Elapidae)
- Metagenomic Analysis of Mangshan Pit Viper (Protobothrops mangshanensis) Gut Microbiota Reveals Differences among Wild and Captive Individuals Linked to Hibernating Behaviors
- Endocast Morphological Variation and Its Driving Forces in Scutiger boulengeri
- Desertification Drives the Shift in Egg Size-Number Trade-Off in an Agamid Lizard