
Determination of egg and milk allergen in food products by liquid chromatography-tandem mass spectrometry based on signature peptides and isotope-labeled internal standard
2023-01-23 09:14SufngFnJunmeiZhuoLiuYweiNingMeicongCoQingLiYnZhng
食品科学与人类健康(英文) 2023年3期
Sufng Fn, Junmei M, Zhuo Liu, Ywei Ning, Meicong Co, Qing Li,*, Yn Zhng,*
a Hebei Food Safety Key Laboratory, Key Laboratory of Special Food Supervision Technology for State Market Regulation, Hebei Engineering Research Center for Special Food Safety and Health, Hebei Food Inspection and Research Institute, Shijiazhuang 050227, China
b College of Bioscience and Bioengineering, Hebei University of Science and Technology, Shijiazhuang 050018, China
Keywords:Liquid chromatography-tandem mass spectrometry Egg and milk allergen Signature peptides Isotope-labeled internal standards
A B S T R A C T The aim of this work was to develop a liquid chromatography-tandem mass spectrometry method for the determination of milk allergen and egg allergen in food products. Signature peptides GGLEPINFQTAADQAR,VGINYWLAHK, VLVLDTDYK, FFVAPFPEVFGK, and NAVPITPTLNR were conf irmed and synthesized asthe quantitative peptide ofovalbumin, α-lactalbumin,β-lactoglobulin, αS1-caseinand αS2-casein,the relative isotope-labeled internalstandards were used in thequantitativeanalysis.Linearrangewasinthe range of 0.5-5 000.0 nmol/L for egg and milk allergen in bread, cake, cookie, rice crust and wheat f lour samples with free from egg and milk, the limits of detection of milk allergens and egg allergen were in the range between 0.94 mg/100 g and 56.71 mg/100 g, limits of quantif ication of milk allergens and egg allergen were in the range between 2.36 mg/100 g and 141.78 mg/100 g. The recoveries ranged from 76.7% to 122.8%, the relative standard deviations were in the range of 1.60%-15.60%. The developed method has been successfully used for the detection of egg and milk allergen in various food samples.
1. Introduction
Food allergy is an immunoglobulin E (IgE)-mediated immune disorder caused by food allergens, which is an important food safety issue. We are paying more and more attention to food allergy for its lethal effects on allergic consumers [1-3]. There are allergens in many everyday foods, such as milk, soy, egg, peanut [4], tree nuts [5], wheat, f ish, and shellf ish, the presence of allergens may be intentionally added to foods or present in foods due to cross-contact at any stage of food production [6,7].Five percent of the adult and 8% of young children suffer from food allergies when allergenic food components are inhaled or ingested,and food allergy is becoming a health risk to allergic consumers [8,9].Cow’s milk plays a key role in the human diet as a valuable ingredient,due to its abundance in proteins, peptides, fatty acids and minerals [10].Meanwhile, cow’s milk is one of the most common food allergens,especially to young children [11,12]. The allergen proteins in cow’s milk include caseins, lactalbumin, lactoglobulin, immunoglobulin and bovine serum albumin [13]. Eggs are rich in dietary proteins and well-known for their nutritional value, however, there are allergen proteins in egg white such as ovalbumin (OVA) [14,15].The best way to avoid the offending of these allergens for consumers is to keep away from the allergic food. Legislation on food labeling has been established in many countries to protect consumers from offending [16,17], there are “milk-free” or “egg-free” labels in some specif ic products [18]. In Europe, 14 food allergen ingredients must be indicated on labels when they are present in food, the allergen including milk, peanut, egg, soybean, fish, crustaceans, cereals containing gluten, tree nuts, celery, lupin, mustard, sesame, mollusks,and sulfur dioxide [19,20].
There are several analytical approaches for the detection of food allergens, including immunochemical techniques, enzyme linked immunosorbent assay (ELISA) [21,22], gel electrophoresis (GE) [23],capillary electrophoresis (CE) [24], sequence-specific DNA analysis [25], and liquid chromatographic techniques [26]. However,immunochemical techniques and the ELISA technique could be affected by cross reactivity, leading to false-positive results. GE and CE methods are relatively fast and suitable for routine screening,but they are not amenable to protein identification. HPLC method is the well-documented method in protein determination but it usually suffers from insufficient resolution and sensitivity when the analyte is in low concentration [27]. In recent years, mass spectrometry has been successfully used in the detection of allergens in food due to its high sensitivity and accuracy [28,29], high performance liquid chromatography or nano-liquid chromatography-tandem mass spectrometry has been used to determine the intact protein or signature peptides after protein digestion [27,30,31].
The aim of this work was to develop a liquid chromatographytandem mass spectrometry (LC-MS/MS) method for the determination of milk allergen and egg allergen in food products. Signature peptides of ovalbumin,α-lactalbumin (α-La),β-lactoglobulin (β-Lg),αS1-casein (αS1-CN) andαS2-casein (αS2-CN) were identified and synthesized for further analysis, isotopically labeled internal standards for quantification peptides were also synthesized.
2. Materials and methods
2.1 Chemicals and reagents
Ammonium bicarbonate (NH4HCO3), dithiothreitol (DTT),iodoacetamide (IAA), calcium chloride (CaCl2), OVA (≥ 98%, from egg white),α-La (≥ 85%, from bovine milk),β-Lg (≥ 90%, from bovine milk),α-casein (≥ 70%, from bovine milk),β-casein (≥ 98%,from bovine milk) were purchased from Sigma-Aldrich (St. Louis,MO, USA).n-Hexane, acetonitrile and formic acid were HPLC grade and purchased from Merck (Darmstadt, Germany). Trypsase (for HPLC purification) was purchased from AB Sciex. All experimental water was distilled water (Watsons, Hongkong, China).
Bread, cake, cookie, rice crust and wheat flour samples (no milk and egg in the food label) used for the method investigation were purchased from the local market.
2.2 Synthetic peptide standards
The signature peptide LTEWTSSNVMEER (LR-13),GGLEPINFQTAADQAR (GR-16), and ELINSWVESQTNGIIR(ER-16), isotopically labeled IS GGL*EPINFQTAADQAR (13C615N)from tryptic OVA, signature peptide VGINYWLAHK (VK-10),LDQWLCEKL (LL-9), isotopically labeled IS V*GINYWLAHK(13C515N) fromα-La, signature peptide VLVLDTDYK (VK-9),TPEVDDEALEK (TK-11), isotopically labeled IS VL*VLDTDYK(13C615N) fromβ-Lg, signature peptide FFVAPFPEVFGK(FK-12), HQGLPQEVLNENLLR (HR-15), YLGYLEQLLR(YR-10), isotopically labeled IS FFV*APFPEVFGK (13C515N)fromαS1-CN, signature peptide NAVPITPTLNR (NR-11),FALPQYLK (FK-8), TVYQHQK (TK-7), isotopically labeled IS NAV*PITPTLNR (13C515N) fromαS2-CN, were synthesized by Qiangyao biotechnology company (Shanghai, China). The purity of all the synthetic peptides was ≥ 95%.
2.3 Sample pretreatment
Solid samples were finely grounded, lipids should be removed from food samples before extraction. 1 g of the homogenized sample was weighed into a 15 mL centrifuge tube and 5 mL ofn-hexane was added, the sample was shaken for 10 min and centrifuged 10 min with 9 500 ×g, the supernatant was abandoned. Repeat the fat decrease step once, dry the samples using a gentle flow of nitrogen without heating.
2.4 Enzymatic digestion
Defatted sample (0.1 g) was diluted to 10 mL using distilled water, aliquots of 50 µL sample solution were spiked with 10 µL of 500 mmol/L stable isotope-labeled internal standard solution and then mixed with 10 µL of 100 mmol/L CaCl2solution and 660 µL distilled water. The mixture was reduced by adding 10 µL of 500 mmol/L DTT solution in 70 °C water bath for 30 min. Alkylation was performed with 10 µL 500 mmol/L IAA solution for 30 min at room temperature in the dark. 200 µL 500 mmol/L NH4HCO3solution and 40 µL of 200 µg/mL trypsin were added and incubated overnight at 37 °C in a water bath vibrator. 10 µL of 0.1% formic acid was added to terminate the digestion. The sample was centrifuged at 13 000 ×gfor 10 min at room temperature, and 500 µL supernatant solution was transferred into a 10 kDa ultrafiltration tube, the supernatant solution was collected for determination after centrifuging 20 min at 14 000 ×g.
2.5 Apparatus
Allergen identification was carried out using a quadrupole/electrostatic field orbitrap high resolution mass spectrometer(Q Exactive) system equipped with a nano-liquid chromatography system (Easy-nLC 1000) (Thermo Fisher Scientific, USA). Pre-column(C18, 5 µm, 120 A, 100 µm × 4 cm), analytical column (C18, 5 µm,120 A, 75 µm × 15 cm) were supplied by Beijing Lerunfeng Technology Co., Ltd. The injection volume was 2 µL and the flow rate of sample pickup was 20 µL/min, the volume of sample loading was 20 µL. Mobile phase A was water with 0.1% formic acid and mobile phase B was acetonitrile. Pre-column equilibration was conducted by 8 µL mobile phase A, analytical column equilibration was carried out by 6 µL mobile phase A. Gradient elution was adopted, the elution program was a linear gradient from 3% B to 7% B in 3 min, gradient to 22% B in 38 min, gradient to 35% in 48 min, ramped to 90% B in 50 min, then held at 90% B for 10 min, and the flow rate was 300 nL/min. It takes 70 min to complete one analysis.
Q Exactive was used as a detector equipped with a nanoelectrospray ionization source (Thermo Fisher Scientific, USA). All data were acquired in full-MS and data-dependent scan (ddMS2)mode under the electrospray positive ion mode. Full MS conditions as follows: resolution, 70 000; AGC target was set as 1 × 10⁶, scan range was 350-1 800m/z. dd-MS2conditions as follows: resolution, 17 500;AGC target was set as 1 × 10⁵. The isolate window was 2.0m/z, fixed first mass was 120.0m/z, collision energy was 27 eV.
Allergen quantification was conducted on a Triple Quad 6500+LC-MS/MS (AB Sciex, USA). The separation of tryptic peptides was carried out on an LC-30AD UPLC system equipped with a binary solvent manager, sample manager, and column manager (Shimadzu,Japan). The column was Proteonavi (5 µm, 2.0 mm × 150 mm)(Shiseido, Japan). Mobile phase A was water with 0.1% formic acid and mobile phase B was acetonitrile. The mobile phase flow rate was 0.3 mL/min, the column temperature was 40 °C and the injection volume was 1 µL. Mobile phase B was maintained at 10% before 2.0 min, linear gradient from 10% to 20% in 3.0 min, gradient from 20% to 22% in 4.0 min, then gradient to 30% in 4.0 min, gradient to 75% in 5.0 min, then held 75% for 4.0 min, returned to 10% B in 0.01 min and equilibrated at 10% B for 3.0 min.
Data acquisition was performed on a Triple Quad 6500+MS equipped with an ESI source. The conditions of mass spectrometry were as follows: scan mode, multiple reaction monitoring (MRM);capillary voltage, 5.5 kV; pressure of atomizer (GS1): 50 psi; pressure of auxiliary gas (GS2): 55 psi; pressure of curtain gas: 30 psi;temperature of ion source (TEM): 500 °C.
2.6 Data analysis
Raw data of Q Exactive was analyzed using the software Thermo Proteome Discoverer 1.4 with the following settings: precursor selection, use MS1 precursor; minimum precursor mass, 350 Da;maximum precursor mass, 5 000 Da; minimum peak count, 1; protein database, chicken database and bovine database download from Uniprot (http://www.uniprot.org); enzyme name, trypsin (Full);maximum missed cleavage site, 2; minimum peptide length, 6;maximum peptide length, 144; precursor mass tolerance, 10 ppm;fragment mass tolerance, 0.02 Da; dynamic modification, oxidation(15.995 Da); static modification, carbamidomethyl (57.021 Da).
3. Results and discussion
3.1 Selection and synthesis of signature peptide for allergen protein
It is very important to select suitable signature peptides for the development of LC-MS/MS, the selected signature peptides could significantly affect the specificity and sensitivity of the method because the ionization and susceptibilities in mass spectrometry are different for various peptides [27]. In this experiment, trypsin was used for enzymatic hydrolysis of protein and the cleavage site of trypsin was specifically at the C-terminal of lysine and arginine [23].There are several principles to select signature peptides: peptides length usually between 7 and 16 amino acids, to avoid the susceptible amino acid such as cysteine and methionine to chemical modifications,the selected peptide should be reproducibly observed between sample preparations and detectable in every digested sample [12,32].It is considered that the specificity is poor when the length of peptide is lower than 5 amino acids, but the peptides are difficult and expensive to synthesize and may possess unfavorable properties for LC-MS/MS determination when the selected peptides are too long [27].
After enzymolysis of OVA,α-La,β-Lg, casein with trypsin,peptide fragments were separated by nano-liquid chromatography system and analyzed by Q Exactive. Raw data of Q Exactive was analyzed using the software Thermo Proteome Discoverer 1.4,amino acid sequences from 5 kinds of allergen proteins presented in Fig. 1. 13 peptides of OVA were identified, the coverage rate of characterized peptide sequence was 49.5%; 11 peptides ofα-La were identified, the coverage rate of characterized peptide sequence was 48.8%; 8 peptides ofβ-Lg were identified, the coverage rate of characterized peptide sequence was 40.4%; 12 peptides ofαS1-CN were identified, the coverage rate of characterized peptide sequence was 51.9%; 13 peptides ofαS2-CN were identified and the coverage rate of characterized peptide sequence was 56.3%. According to the principles of selection for signature peptide, no missed cleavage site, no modification amino acid, with appropriate peptide length and high abundance, should be unique for the selected protein,13 peptide sequences were identified, including three peptide sequences from OVA, two peptide sequences fromα-La, two peptide sequences fromβ-Lg, three peptide sequences fromαS1-CN and three peptide sequences fromαS2-CN. The selected candidate peptides are LTEWTSSNVMEER (LR-13), GGLEPINFQTAADQAR (GR-16),and ELINSWVESQTNGIIR (ER-16) for OVA, VGINYWLAHK(VK-10) and LDQWLCEKL (LL-9) forα-La, VLVLDTDYK(VK-9), TPEVDDEALEK (TK-11) forβ-Lg, FFVAPFPEVFGK (FK-12),HQGLPQEVLNENLLR (HR-15), YLGYLEQLLR (YR-10) forαS1-CN, NAVPITPTLNR (NR-11), FALPQYLK (FK-8), TVYQHQK(TK-7) forαS2-CN. GR-16, VK-10, VK-9, FK-12 and NR-11 were selected as quantitative peptides for OVA,α-La,β-Lg,αS1-CN andαS2-CN, respectively. All identified peptides were presented in Table 1.

Fig. 1 Amino acid sequence of OVA, α-La, β-Lg, αS1-CN and αS2-CN,peptides identified by Q Exactive mass spectrometry were highlighted in bold,signature peptides were underlined.
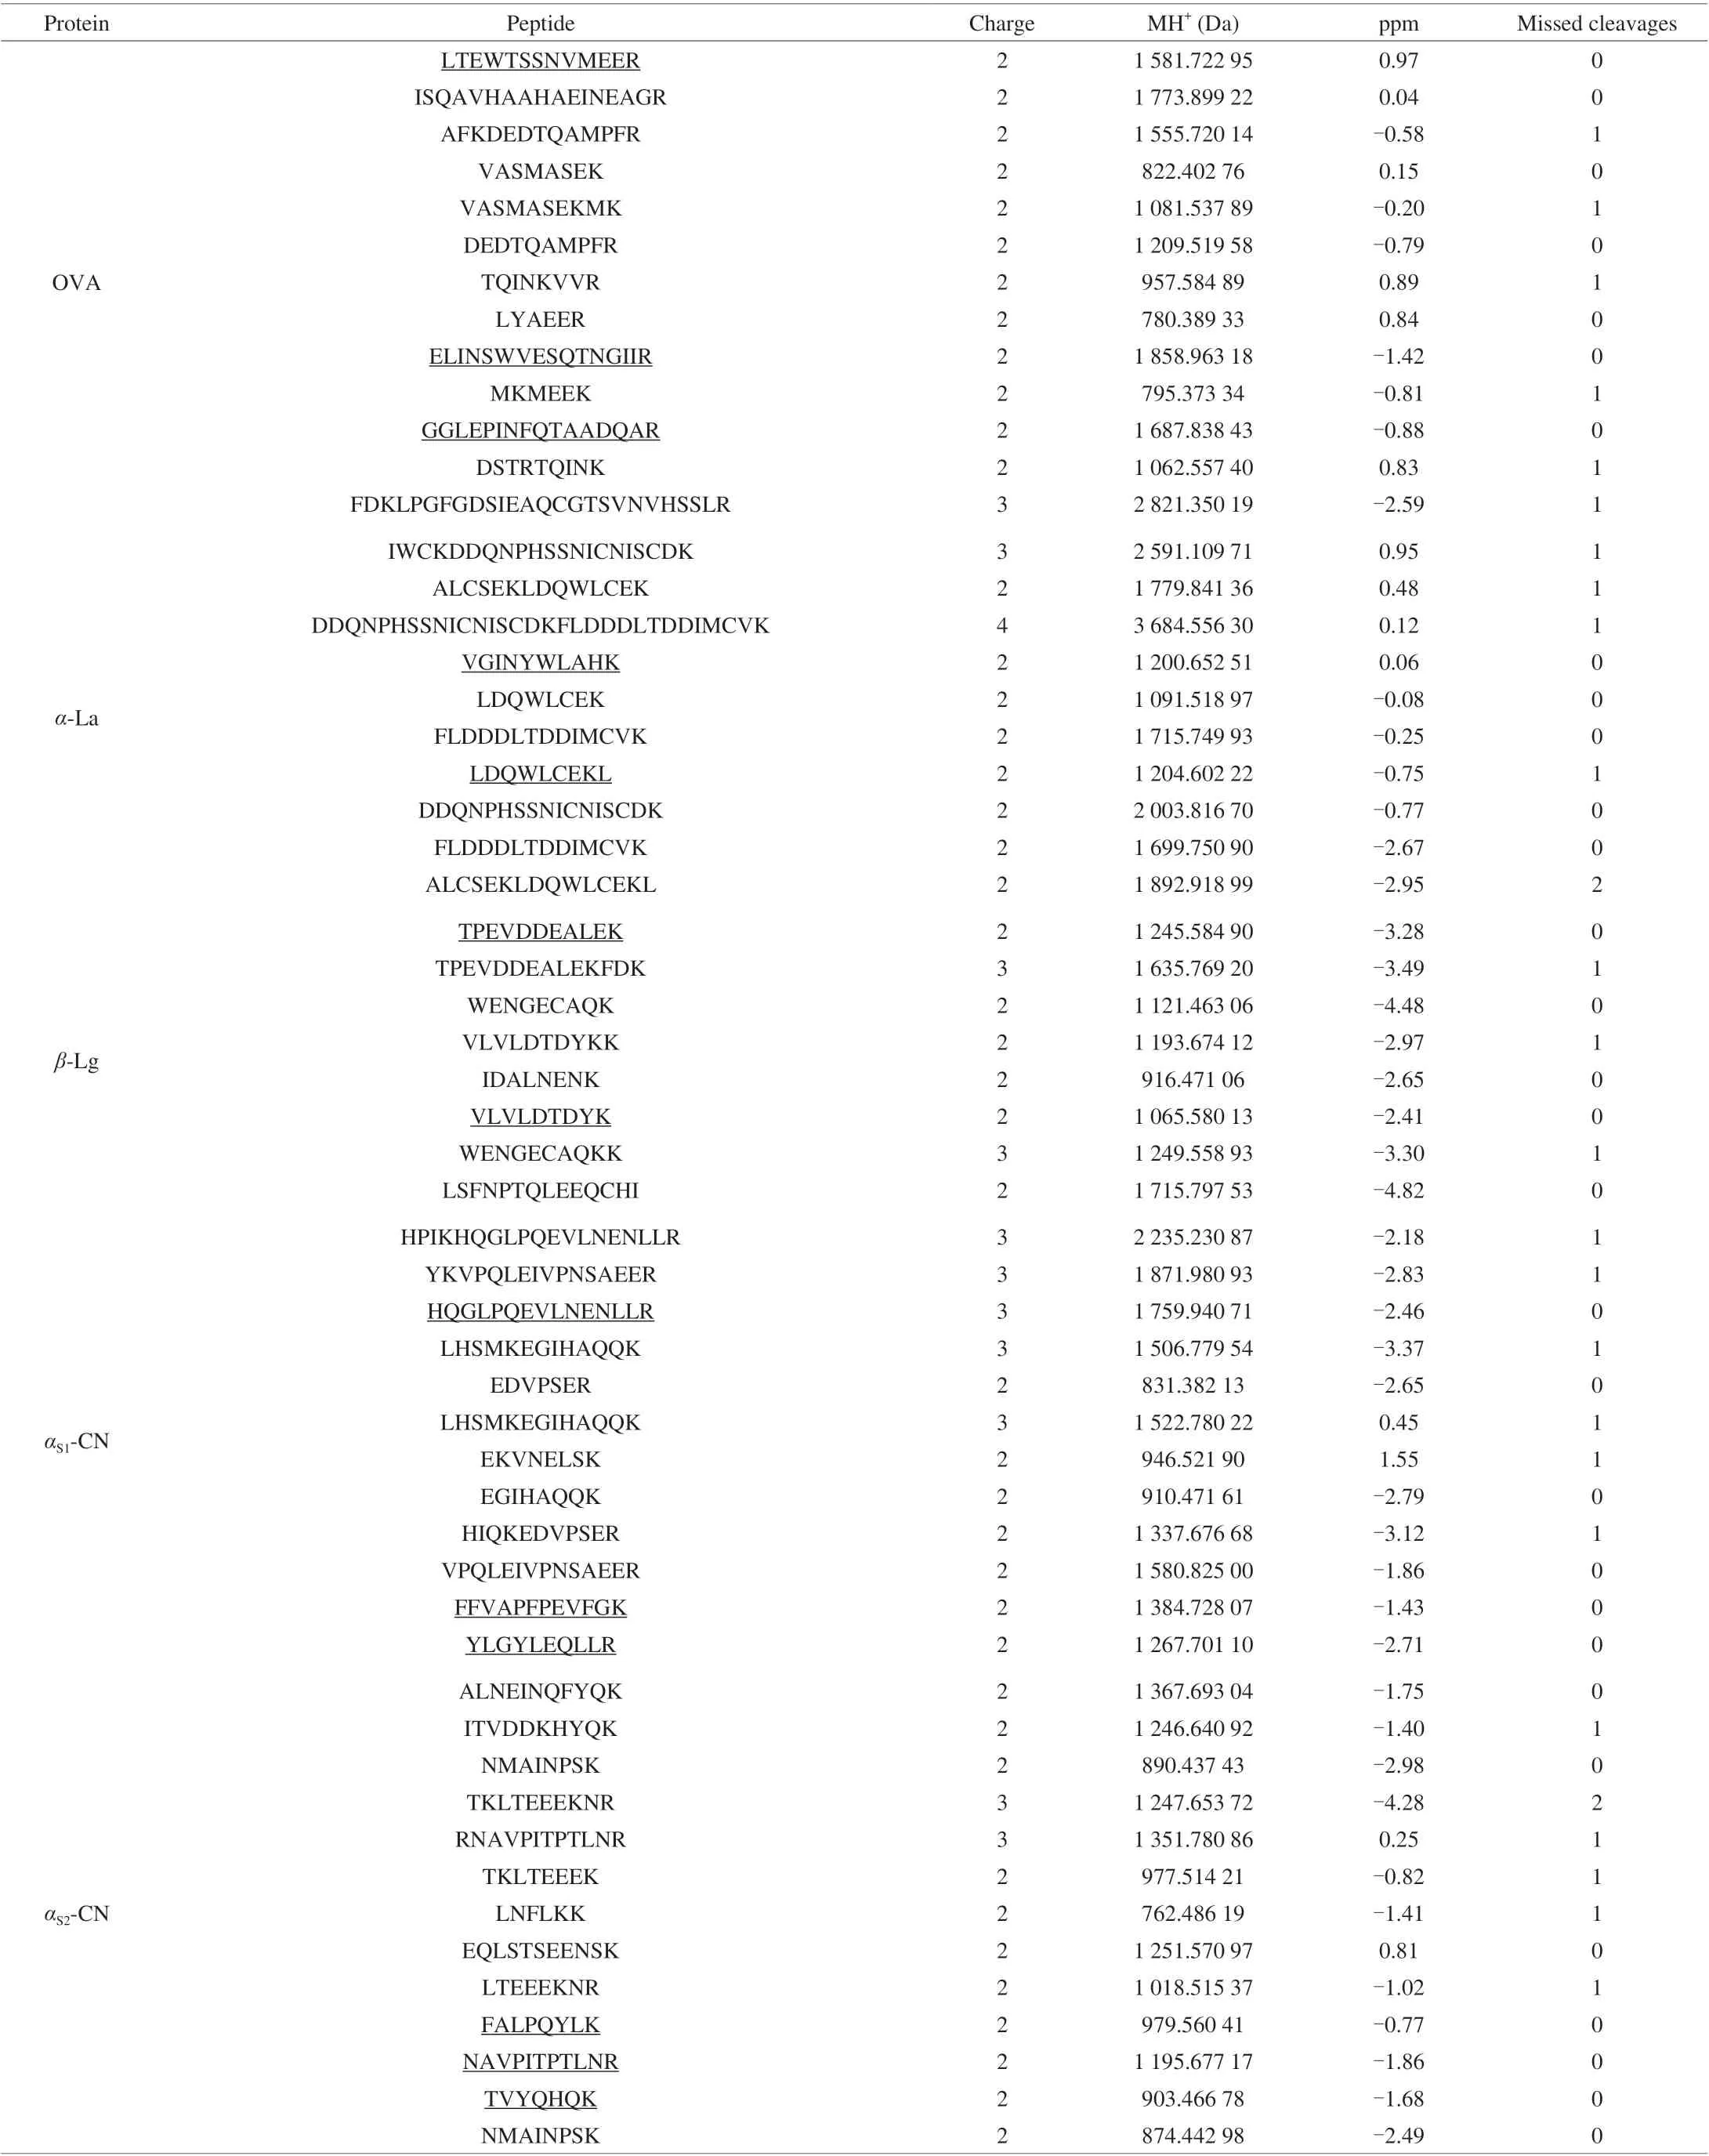
Table 1 All identified peptides.
3.2 Optimization of the isotope-labeled signature peptide
For the LC-MS/MS determination, the internal standard method is one of the effective ways to minimize the matrix effect.Internal peptides (IPs) were designed in our method. Based on the enzymatic digestion technique, the homologous peptide was employed as the IS for measuring milk and egg allergen protein. The isotopically labeled IS GGL*EPINFQTAADQAR (13C615N) for OVA,V*GINYWLAHK (13C515N) forα-La, VL*VLDTDYK (13C615N) forβ-Lg, FFV*APFPEVFGK (13C515N) forαS1-CN, NAV*PITPTLNR(13C515N) forαS2-CN were designed and synthesized in which all the carbon and nitrogen atoms in leucine (L) and valine (V) residues were labeled with13C and15N. It is well known that deuterated substances are much easier and cheaper to synthesize in many cases, but they are prone to breaking and losing when deuterium atoms exist in the acidic side chains of amino acids or otherwise exchangeable hydrogen atoms compared to13C and15N in the skeleton [13].
3.3 Optimization of MRM conditions
For optimization of mass spectrometric parameters, synthetic peptide standard solutions were directly injected into mass spectrometry by a syringe pump. The precursor ions of peptide fragments were confirmed in full scan mode, then the parameter of declustering potential was optimized, product ions were confirmed in product scan mode, collision energy for each product ion was optimized. Two stable and sensitive characteristic ions were selected, and MRM was used to monitor the precursor-to-product ion transitions. Under the optimized MRM conditions, the signature peptides were detected. Peptides with perfect abundance and stability were selected as quantitative peptides for each allergen protein.GR-16, VK-10, VK-9, FK-12 and NR-11 were selected as quantitative peptides for OVA,α-La,β-Lg,αS1-CN andαS2-CN, respectively.All parameters of MS were presented in Table 2. The extracted ion chromatograms of all analytes were shown in Fig. 2.

Fig. 2 The extracted ion chromatograms of all analytes.
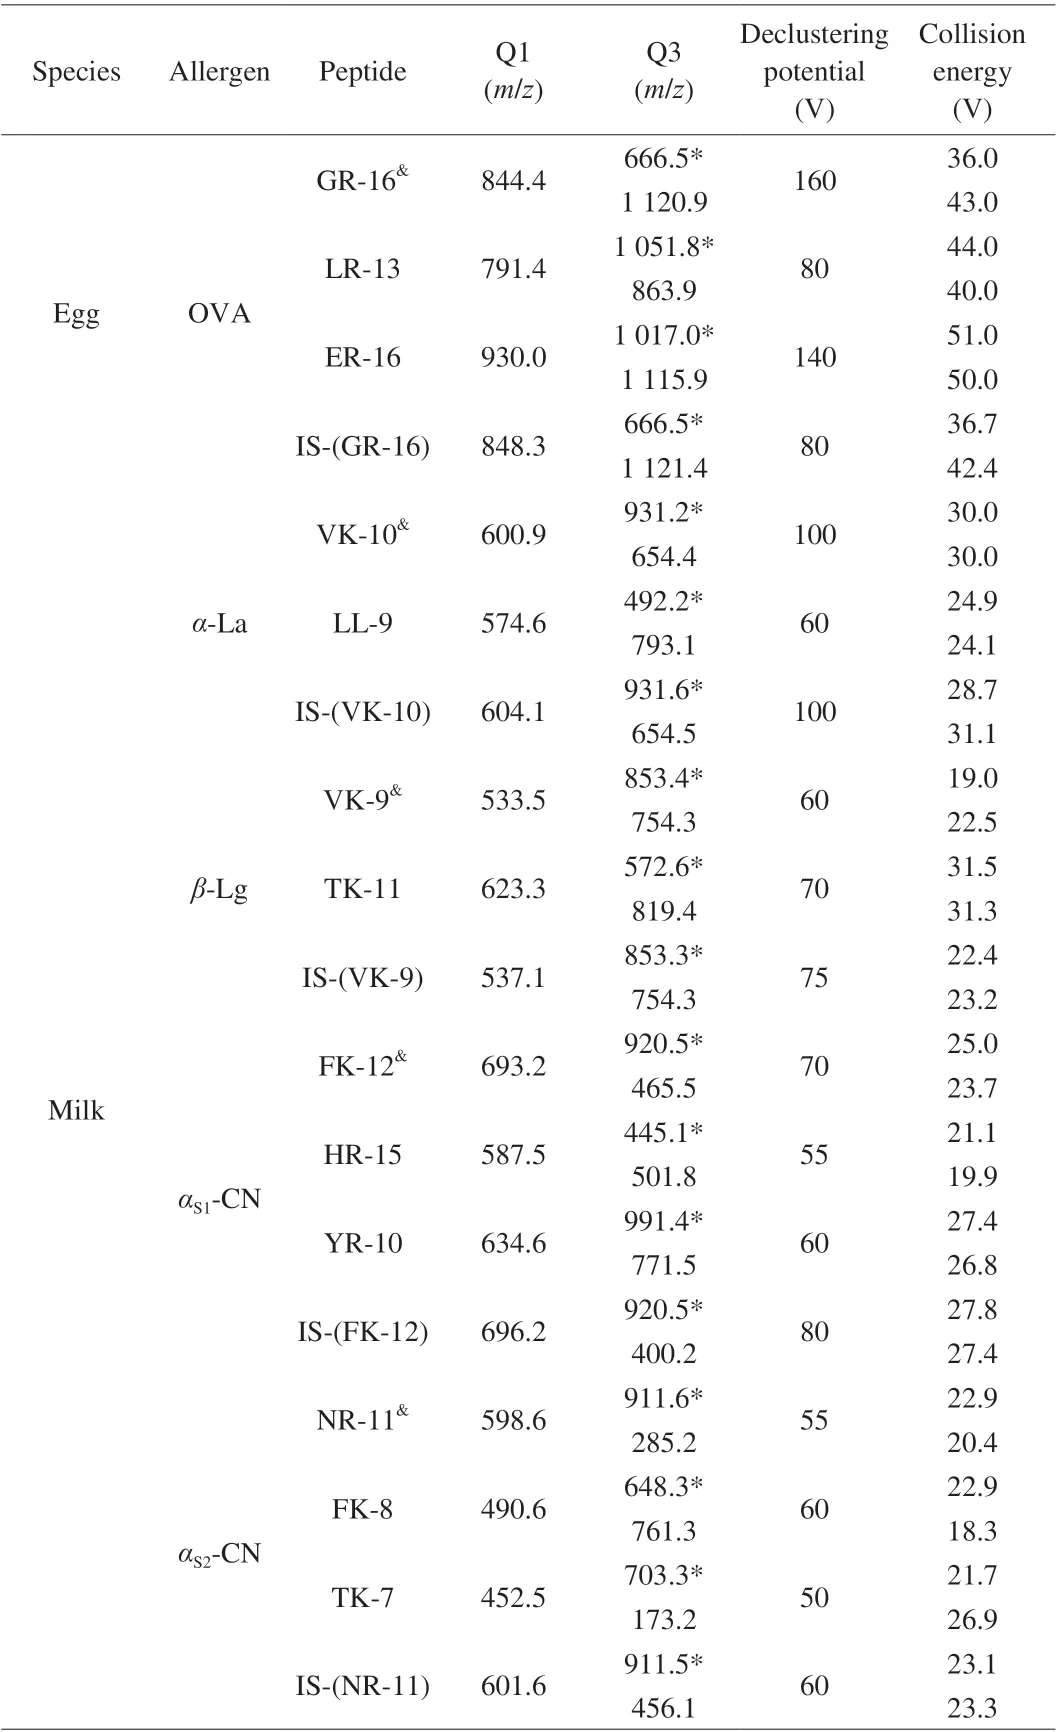
Table 2 Parameters of mass spectrometry.
3.4 Method validation
3.4.1 Specificity of the method
In order to determine the specificity of the method, the chromatograms of the peptide standards with the corresponding tryptic samples spiked with internal standards were compared. Both the synthetic peptide standards and the selected signature peptide from tryptic samples showed a sharp and symmetric peak, there were no peaks in samples without tryptic digestion at the same retention time. It showed that there were no interferences from the matrix components on the retention time of the peptide standards [32].
3.4.2 Linearity, limits of detection (LODs) and limits of quantification (LOQs)
The “free from milk and egg” samples including bread,cake, cookie, rice crust and wheat flour were used to method validation. The standard curves were fitted between the analyte/IS peptide area ratio (y) versus analyte/IS concentration ratio (x).The concentration sequences ranged 6-1 000 nmol/L of OVA,50-5 000 nmol/L ofα-La, 4-1 000 nmol/L ofβ-Lg, 0.5-1 000.0 nmol/L ofαS1-CN, 2-1 000 nmol/L ofαS2-CN in different matrices, with correlation coefficients (R2) higher than 0.99 in all cases. LODs and LOQs were evaluated using the spiked samples, LODs and LOQs of the target compound in samples were calculated by signalto-noise ratio of 3 and 10 (the ratio between intensity of signal of each compound obtained under MRM conditions and intensity of noise in a spiked sample). The level of the spiked sample selected for the determination of LODs and LOQs was chosen based on the spiked sample concentration nearest to these limits.The LOD of OVA was in the range of 17.71-35.43 mg/100 g,LOQ were in the range of 53.14-70.86 mg/100 g; LOD ofα-La were in the range of 28.36-56.71 mg/100 g, LOQ were in the range of 70.89-141.78 mg/100 g; LOD ofβ-Lg were in the range of 7.70-19.25 mg/100 g,LOQ were in the range of 30.80-53.90 mg/100 g; LOD ofαS1-CN were in the range of 0.94-14.17 mg/100 g, LOQ were in the range of 2.36-33.06 mg/100 g; LOD ofαS2-CN were in the range of 2.52-10.09 mg/100 g, LOQ were in the range of 10.09-30.27 mg/100 g in all cases. Data of linear range, regression equation, LOD and LOQ were presented in Table 3. LOD and LOQ were calculated according to the protein molecular weight.
3.4.3 Matrix effect
Matrix effect is defined as a change in the analytical signal caused by anything else in the sample other than the analyte [33].The occurrence of matrix effects is regarded as a signal suppression or enhancement of the analyte due to the co-elution of matrix components, which plays an important role in the quality of the quantitative data generated by the method [34-36]. The compounds brought from complex matrices of analytical samples, solvents,reagents, and materials used in sample preparation or solvents,buffers, and additives contained in mobile phase could cause matrix effect. The approaches to evaluate the matrix effect include postextraction addition, post-column infusion and comparison of slopes of calibration curves [37].
In this study, matrix effects were expressed as the ratio between the calibration curve slopes of matrix-matched and solvent-based standards. The signal enhancement would occur if the percentage of the difference between these slopes was larger than 100%.If it was lower than 100%, it would be indicative of signal suppression [38]. In our experiment, matrix effect was in the range of 82.17%-123.00%, matrix effect of OVA was in the range of 95.05%-113.70%, matrix effect ofα-La was in the range of 90.42%-128.10%, matrix effect ofβ-Lg was in the range of 100.40%-119.80%, matrix effect ofαS1-CN was in the range of 82.17%-102.30%, and matrix effect ofαS2-CN was in the range of 106.10%-123.00%. In general, signal suppression was not serious,and there were signal enhancements in some cases, the influence of the matrix effect was not significant. In other words, the internal standard method could overcome the influence of the matrix effect to a large extent. Data of matrix effect was given in Table 3.
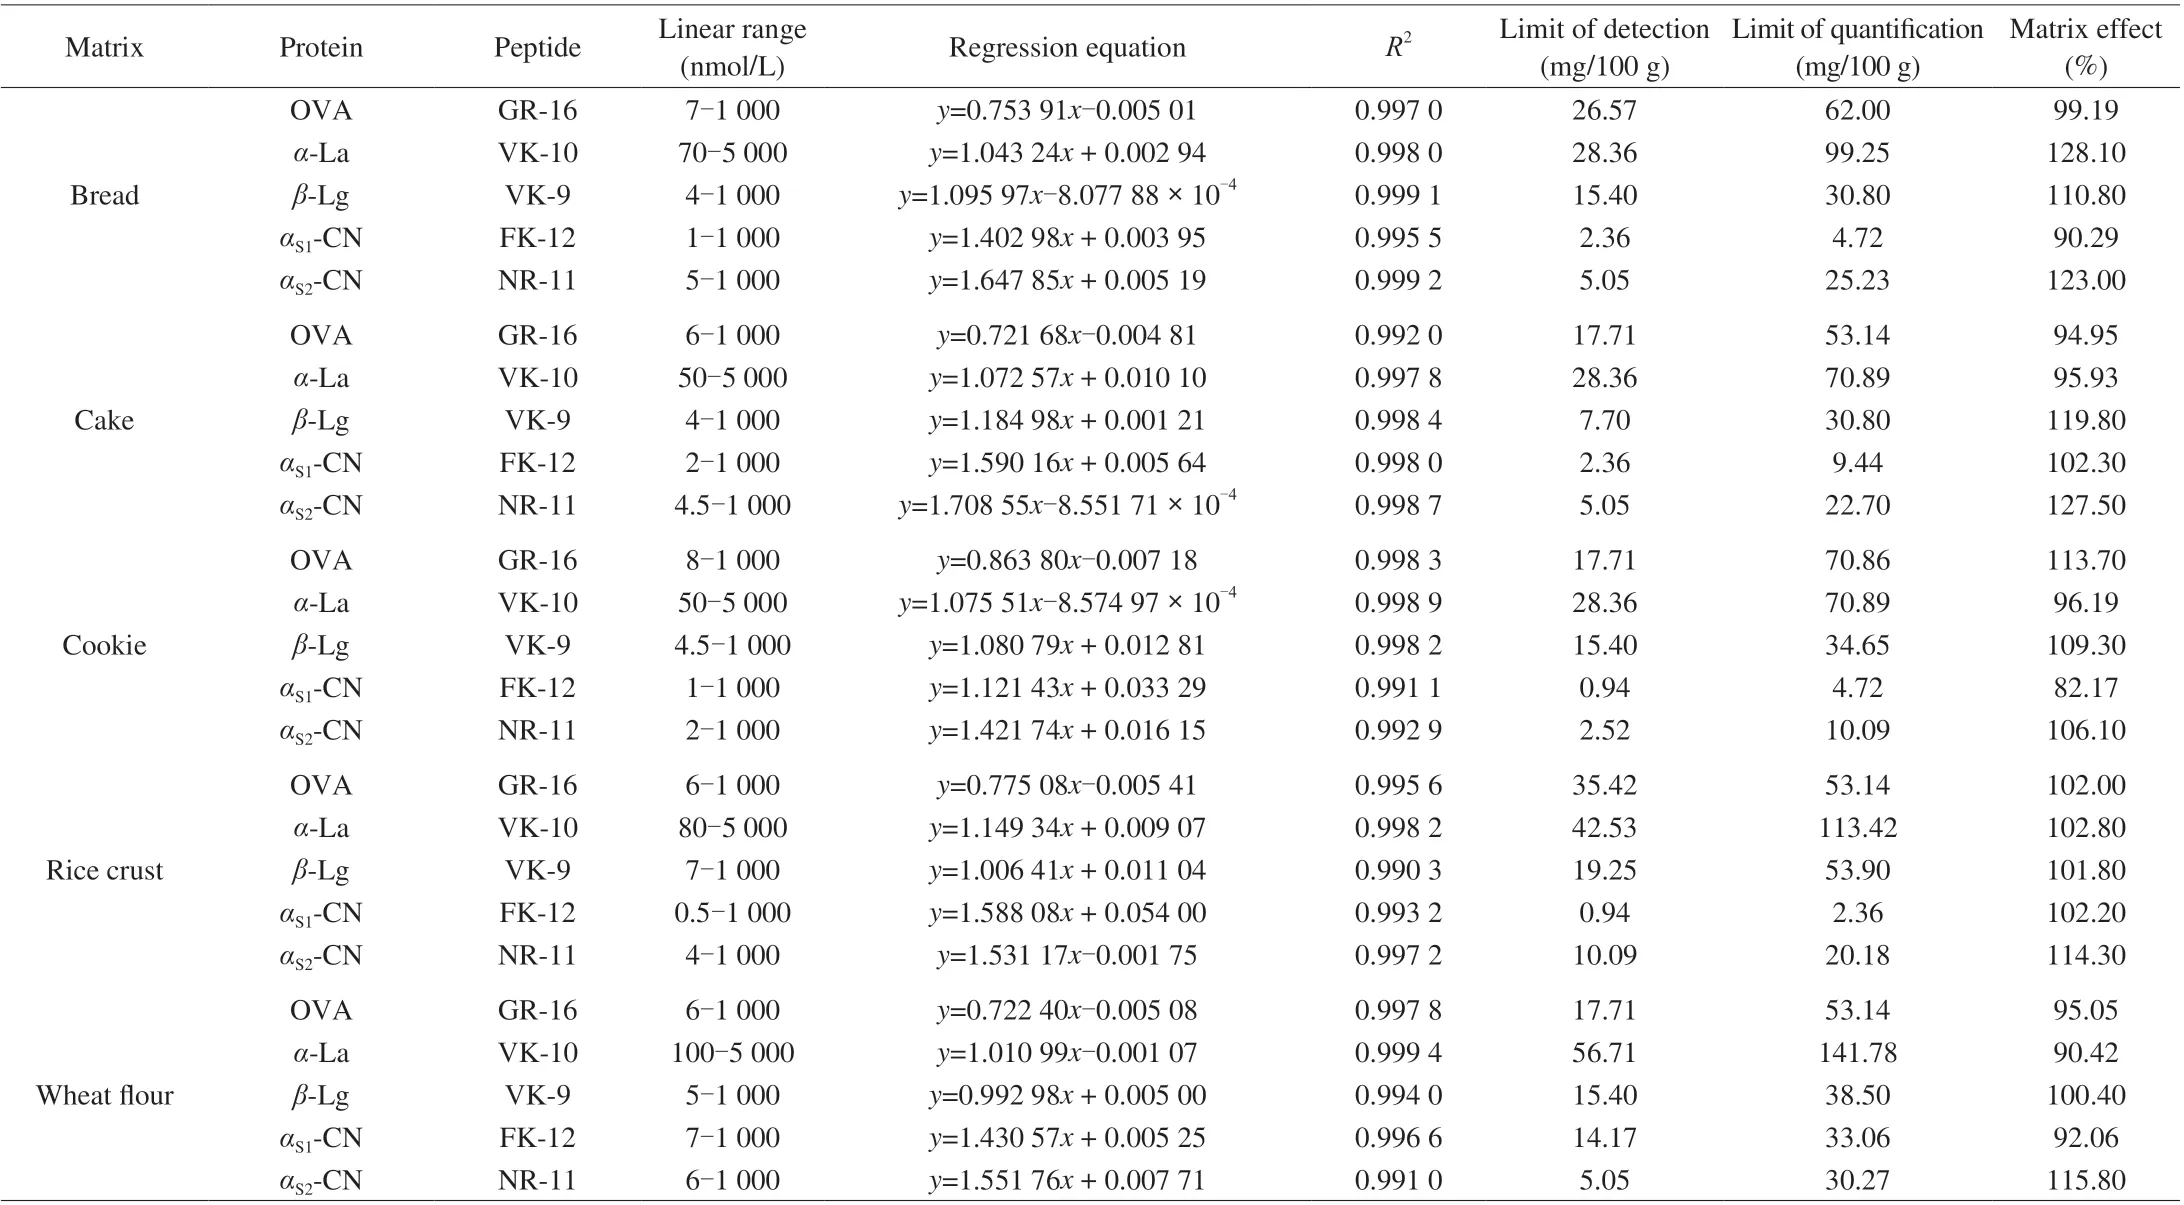
Table 3 Parameters of the method.
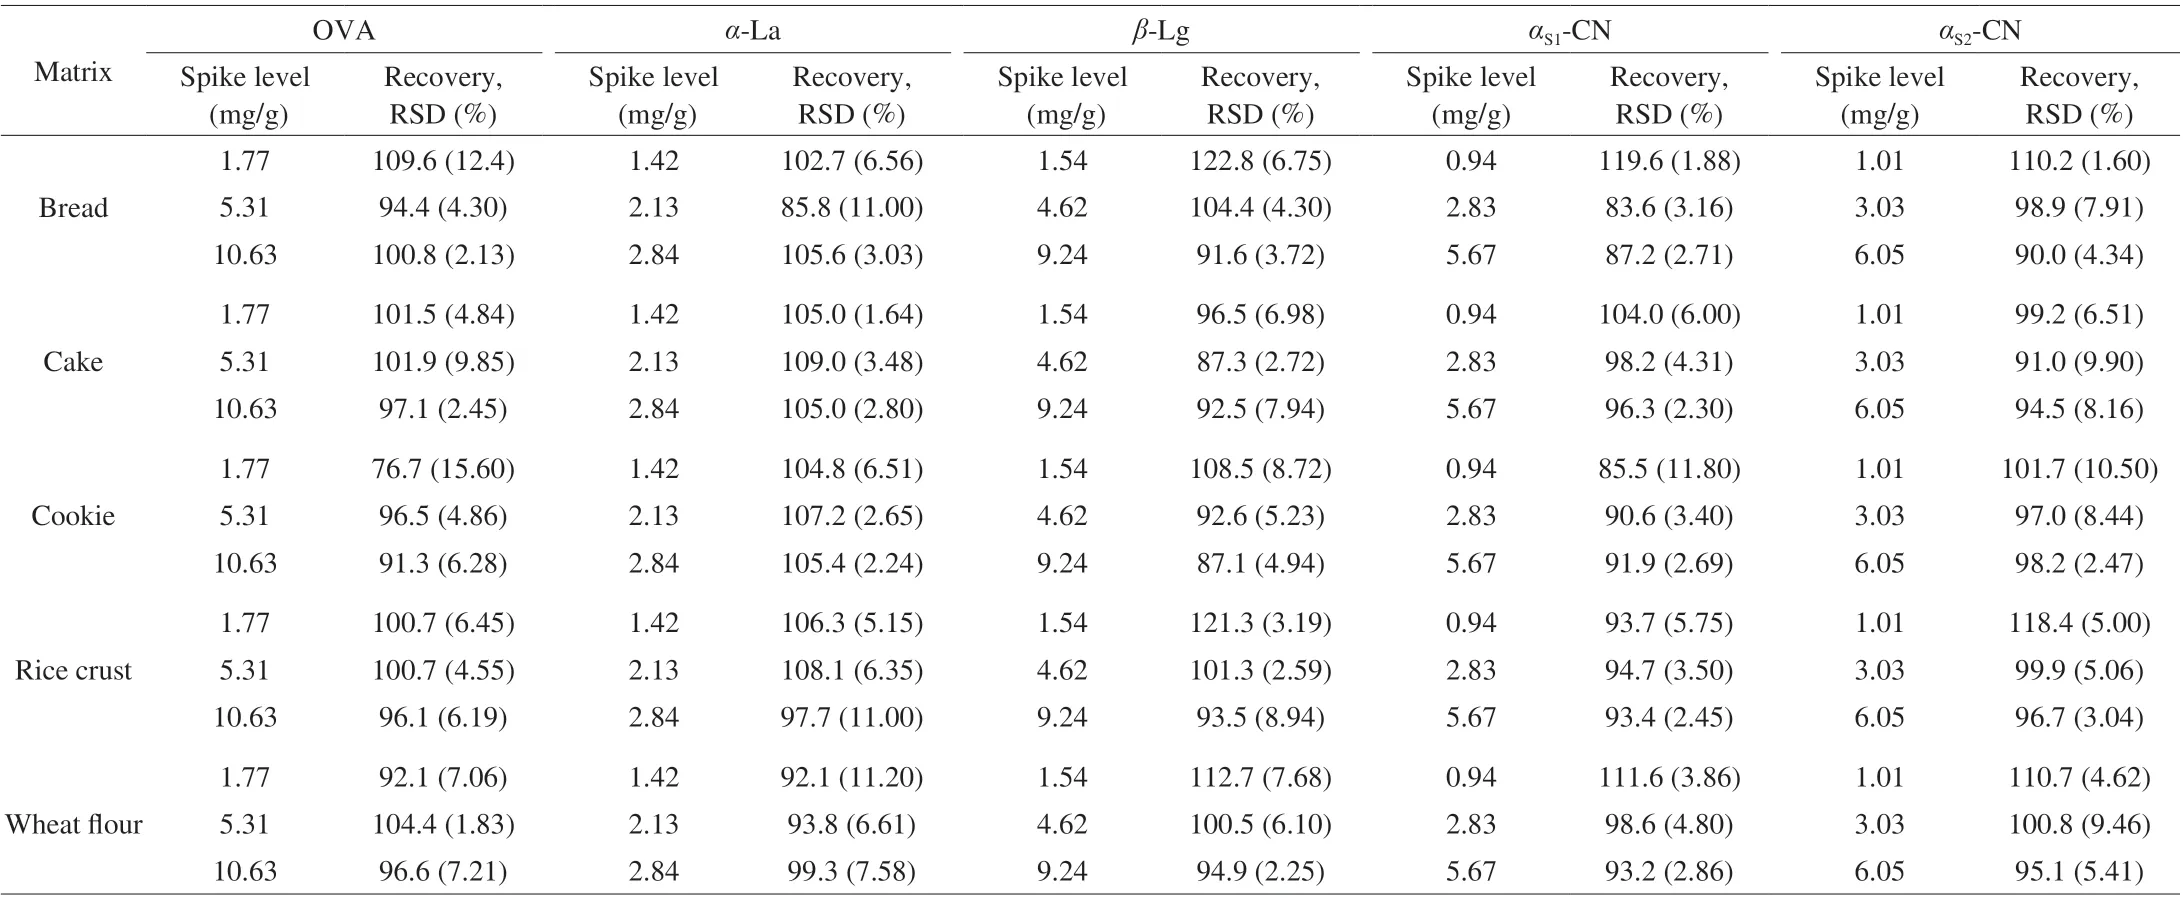
Table 4 Recovery and precision (n = 5).
3.4.4 Recovery and precision
The spike recovery was used for the evaluation of the method accuracy, the precision of the method was studied by carrying out 5 parallels of spike level. The precision of the method was expressed by the relative standard deviation (RSD). The recoveries of OVA for different matrices were calculated using the samples spiked at 1.77, 5.31 and 10.63 mg/g, the recoveries of OVA in the range of 76.7%-109.6%. The recoveries ofα-La were in the range of 85.8%-109.0% with spike levels of 1.42, 2.13 and 2.84 mg/g, the recoveries ofβ-Lg were in the range of 87.1%-122.8%with spike levels of 1.54, 4.62 and 9.24 mg/g, the recoveries ofαS1-CN were in the range of 83.6%-119.6% with spike levels of 0.94,2.83 and 5.67 mg/g, and the recoveries ofαS2-CN were in the range of 90.0%-118.4% with spike levels of 1.01, 3.03 and 6.05 mg/g. The RSDs were in the range of 1.60%-15.6%. The data of recovery and precision were given in Table 4.
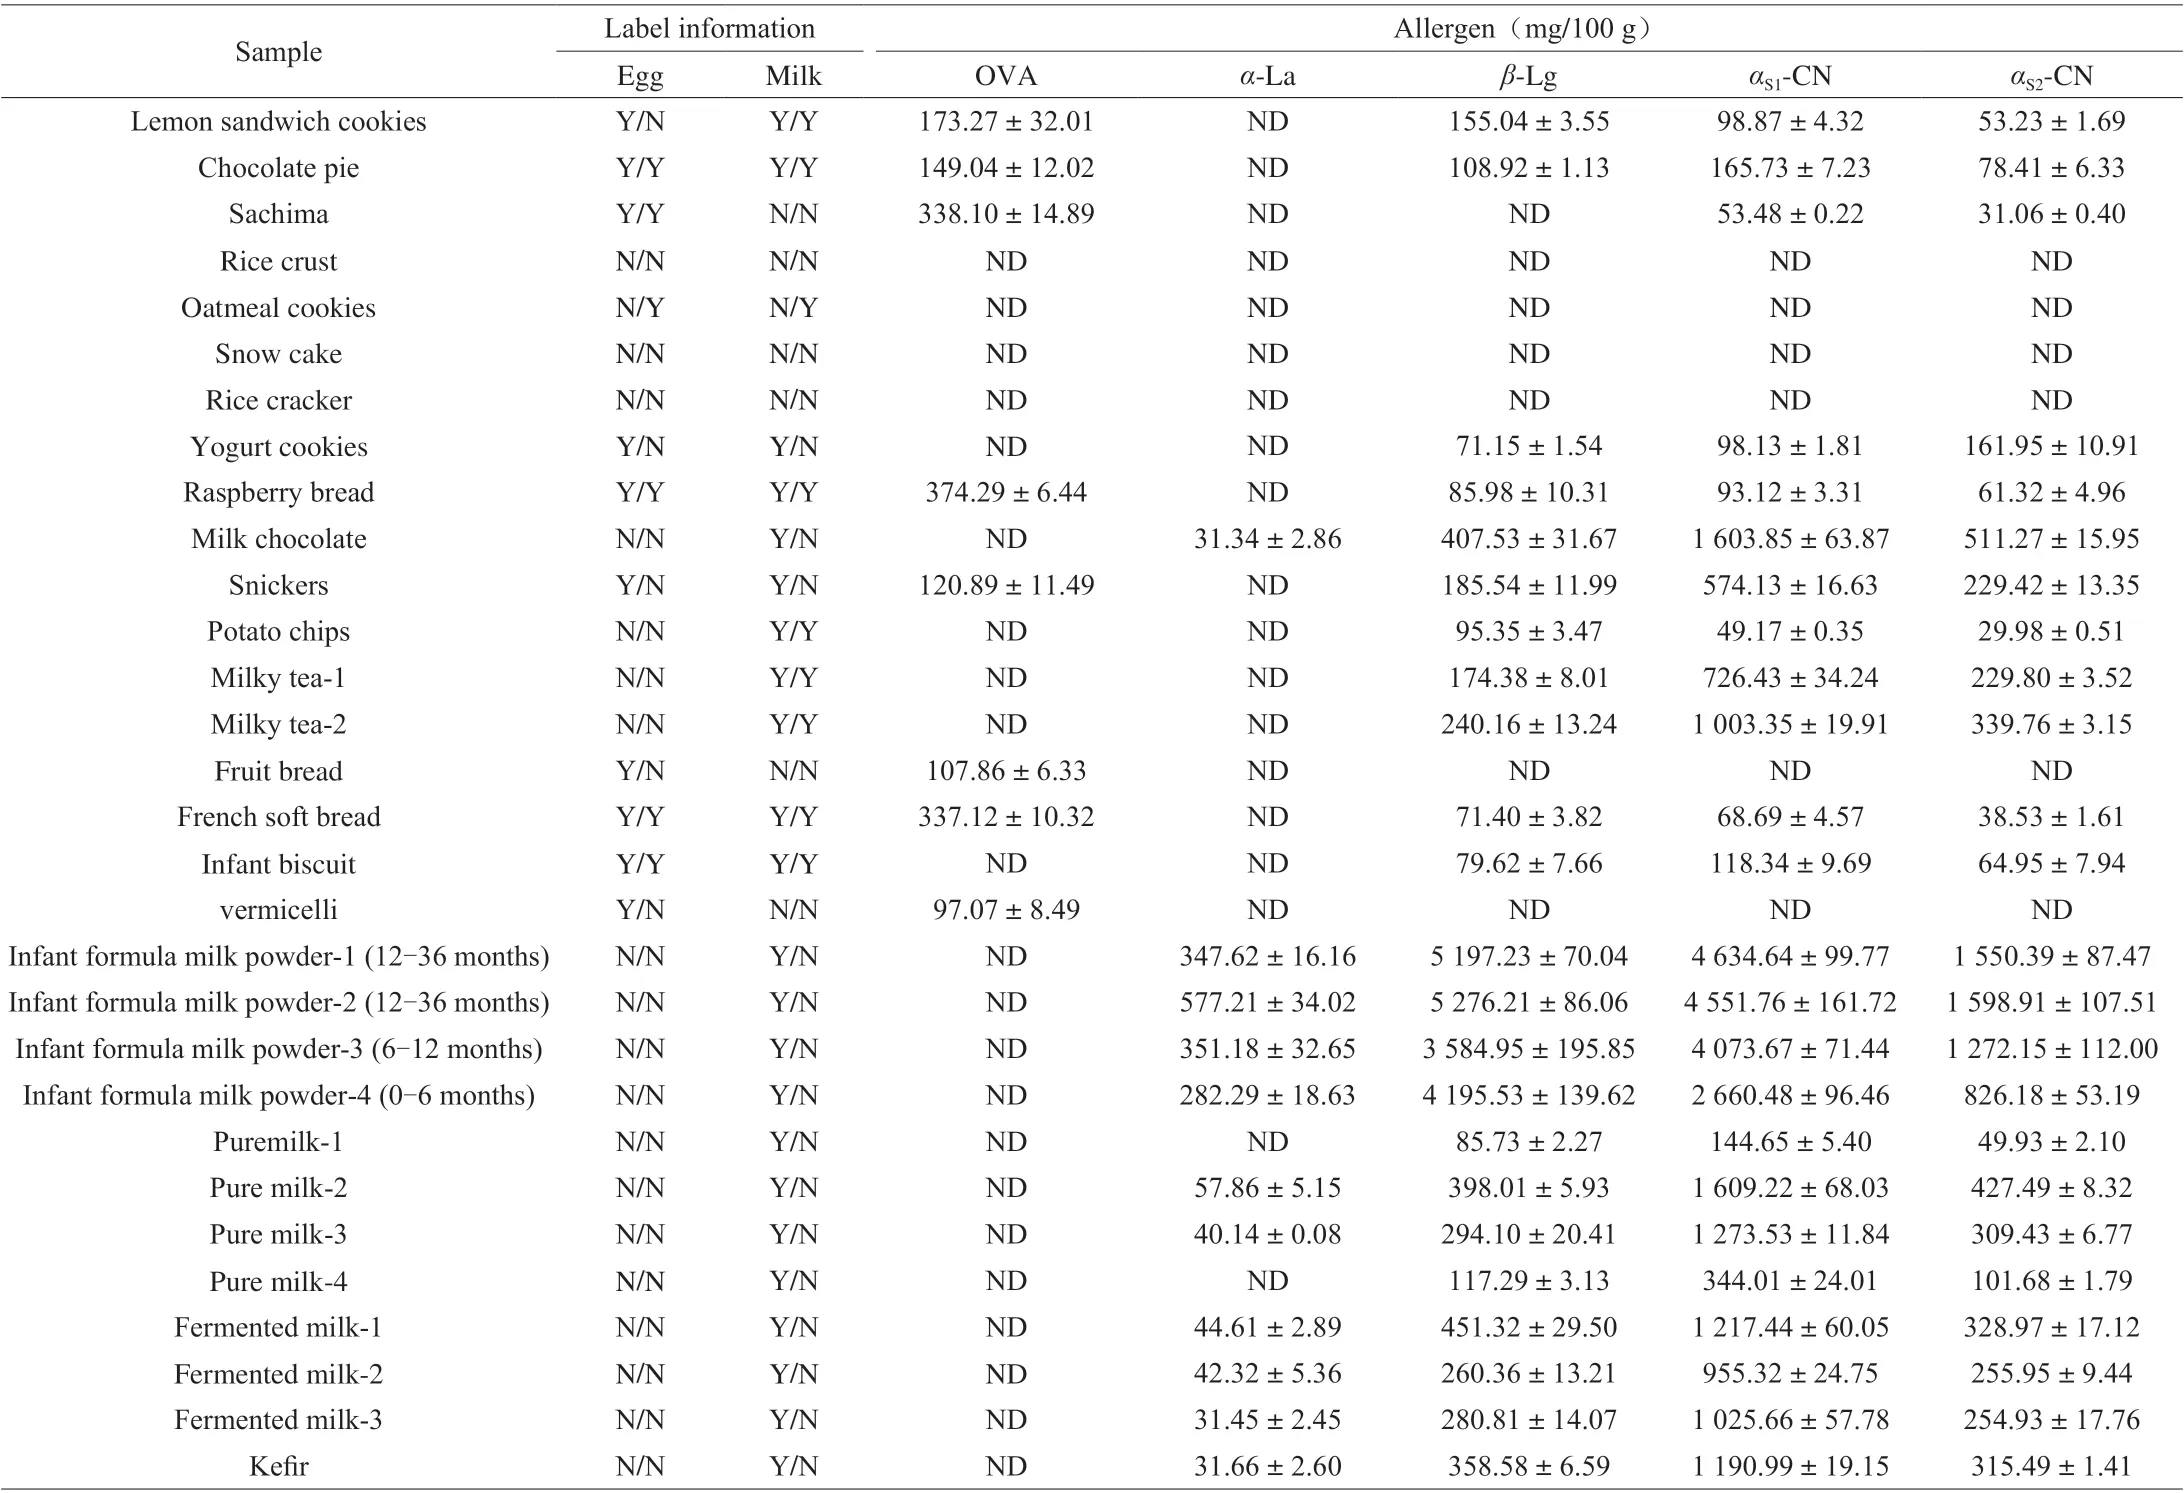
Table 5 Determination results of real sample (n = 5).
3.5 Sample analysis
In order to investigate the applicability of the method, 30 samples were purchased from local supermarkets. OVA were detected in Lemon Sandwich Cookies, Chocolate pie, Sachima, Raspberry bread, Snickers, Fruit bread, French soft bread and vermicelli samples with a concentration range of (97.07 ± 8.49) mg/100 g to(338.10 ± 14.89) mg/100 g. Theα-La were detected in 11 samples with a concentration range of (31.34 ± 2.86) mg/100 g to(577.21 ± 34.02) mg/100 g,β-Lg were detected in 23 samples with a concentration range of (71.15 ± 1.54) mg/100 g to(5 197.23 ± 70.04) mg/100 g,αS1-CN were detected in 24 samples with a concentration range of (49.17 ± 0.35) mg/100 g to(4 634.64 ± 99.77) mg/100 g,αS2-CN were detected in 24 samples with a concentration range of (29.98 ± 0.51) mg/100 g to(1 598.91 ± 107.51) mg/100 g. Determination results of real samples were shown in Table 5. The results were compared with the food label, which showed that most of the food labels could accurately reflect the food ingredients, but there were no egg ingredients detected in two samples although egg was indicated in the food label. The results showed that the developed method could be used for the determination of egg and milk allergen in different kinds of food samples.
4. Conclusions
A new LC-MS/MS method at the peptide level was developed to determine OVA,α-La,β-Lg,αS1-CN andαS2-CN in various food samples. GGLEPINFQTAADQAR (GR-16), VGINYWLAHK(VK-10), VLVLDTDYK (VK-9), FFVAPFPEVFGK (FK-12),NAVPITPTLNR (NR-11) was confirmed as the quantitative peptide of OVA,α-La,β-Lg,αS1-CN andαS2-CN and synthesized for the further process, and isotope-labeled internal standard was used in the quantitative analysis. The specificity, linearity, sensitivity, matrix effect, accuracy and precision of the method were investigated, the developed method has been successfully used for the detection of egg and milk allergen in various food samples.
Conflict of interest
The authors have declared no conflict of interest.
Acknowledgement
This work was supported by National Key Research and Development Program of China (2019YFC1606400), Science and Technology Project of State Administration for Market Regulation(2021MK023), Hebei Province High-level Talent Funding Program(A201901008) and Research Project of Hebei Administration for Market Regulation (2020ZD12).

- 食品科学与人类健康(英文)的其它文章
- The role of probiotics in prevention and treatment of food allergy
- Roles of fermented plant-, dairy- and meat-based foods in the modulation of allergic responses
- The role of gut microbiota and its metabolites short-chain fatty acids in food allergy
- Association of nutrients intake during pregnancy with the risk of allergic disease in offspring: a meta-analysis of prospective cohort studies
- Purif ication and immunoglobulin E epitopes identif ication of low molecular weight glutenin: an allergen in Chinese wheat
- An antifouling polydopamine-based f luorescent aptasensor for determination of arginine kinase