
Influence of magnetic field on power deposition in high magnetic field helicon experiment
2023-03-13 09:19YanZhou周岩PeiyuJi季佩宇MaoyangLi李茂洋LanjianZhuge诸葛兰剑andXuemeiWu吴雪梅
Chinese Physics B 2023年2期
关键词:诸葛
Yan Zhou(周岩) Peiyu Ji(季佩宇) Maoyang Li(李茂洋)Lanjian Zhuge(诸葛兰剑) and Xuemei Wu(吴雪梅)
1School of Physical Science and Technology,Soochow University,Suzhou 215006,China
2Collaborative Innovation Center of Suzhou Nano Science and Technology,Soochow University,Suzhou 215006,China
3The Key Laboratory of Thin Films of Jiangsu,Soochow University,Suzhou 215006,China
4School of Optoelectronic Engineering and Technology,Soochow University,Suzhou 215006,China
5Analysis and Testing Center,Soochow University,Suzhou 215123,China
Keywords: high magnetic field helicon experiment(HMHX),HELIC code,magnetic field,power deposition
1.Introduction
Helicon wave (H wave) is a kind of low-frequency electromagnetic wave that propagates in the high-conductivity medium excited by radio frequency (RF) antenna, and high-density plasma can be generated by using H wave ionization.[1]At a low pressure of 0.1 Pa,the density of HWP can reach 1013cm-3-1014cm-3,which is the maximum density that can be obtained by artificial methods so far under low pressure.[2]Compared with inductively coupled plasma(ICP)and capacitively coupled plasma (CCP), HWP can generate higher plasma density.[3]In the discharge of HWP,an external magnetic field is essential,which makes the ionization mechanism of HWP more complicated.[4]
Due to the external magnetic field, the ionization mechanism of HWP is more than complex, and the wave-particle energy coupling mechanism has not been fully appreciated up to now.[5]Since Aigrain[6]first proposed the concept of the H wave and Boswell[7]first realized the discharge of HWP,Chen,[8]Blackwell,[9]Shamrai,[10]and others had been dedicated to studying the power deposition mechanism of HWP.Although the current hypothesis of the Trivelpiece-Gould wave(TG wave)energy deposition mechanism has gradually become the mainstream consensus,[11,12]the research on the influence of magnetic field on the power deposition needs further discussion.In this regard,this article has launched a study on the effect of magnetic field on the power deposition based on HMHX.[13]
HELIC code is frequently used in the design of RF plasma sources,[14,15]Compared with other codes(such as ANTENA2 code,[16]SPIREs code,[17]ANAMANT code[18]), HELIC code calculates the energy deposition of H wave and TG wave and the distribution of electric field,magnetic field and current through electromagnetic field theory analysis.This code uses specific boundary conditions to solve 6 radially coupled differential equations to obtain two independent waves(H wave and TG wave).It is much faster than dividing the non-uniform plasma into layers and matching boundary conditions on each interface.In this paper, HELIC code is used to simulate the discharge in HMHX.Numerical simulations and discharge experiments are carried out by changing the magnitude of different magnetic fields to explore the influence of magnetic field on the power deposition.The results in this paper have certain guiding significance for the HWP discharge experiments in HMHX.
2.Theoretical formula and calculation model
2.1.Theoretical formula
HELIC code is composed of Maxwell’s equations for a radially non-uniform plasma with the standard cold-plasma dielectric elementsS,D,P(=εxx,iεxy,εzz).These equations can be manipulated to give the following set of coupled differential equations for the Fourier transformed variables:[19-21]
Here, a cylindrical coordinate system (r,φ,z) and first-order perturbation form of exp[i(mφ+kzωt)] have been chosen,withmazimuthal mode number,kaxial mode number andωwave frequency.The variablesEandBare wave electric field and wave magnetic field, respectively, andk0=ω/cwithcthe speed of light.S,D,Pare the three constituent elements of the cold plasma dielectric tensor.The dielectric tensor is expressed as follows:[19]
Among them, the three constituent elementsS,D,Pare expressed as follows:[20]
whereαis the type of particles(such as electrons,ions,etc.),ωpαis the plasma frequency,ωcαis the plasma cyclotron frequency, respectively, andvαis the effective collision frequency between particles.
For the value of each wave, the Eqs.(1)-(4) are programmed to solve, and four basic functions are generated,namelybr,bz,er, andez.In the cylindrical coordinate system,if the plasma is uniform,the basis functionb1,2;z(r)is the Bessel functionJm(T1,2r),where[21]
HereR,L=(S±D)/2.Equation(9)has one high root and one low root for the value ofT2.The lower valueT1is H wave located on the axis,and the higher valueT2is TG wave located at the edge of the plasma.The other componentsbandeand the imaginary number j can be easily found in Maxwell’s equations.When the plasma is not uniform,the wave that appears as a Bessel functionJm(T1r) near the origin is recognized as H wave,and the other root is recognized as TG wave.
Assuming that the antenna is an infinitesimal thin sheet carrying the thin layer currentJof ∇·J=0 atr=b(bis the radius of the antenna), its thickness is negligible.Thus, the power transmitted to the antenna by each wave numberkis
Since the energy flow is averaged according to time,the power on the antenna(Pant)is mainly composed of the resistance loss of the antenna material(Pcopper),the absorbed power of plasma(Pabs)and the power loss radiated to the vacuum by the antenna(Pspace),where
When HELIC code is used to study HWP discharge, it is in a closed vacuum space, and relevant boundary conditions are set for the computational domain.Any particles moving to the boundary of the reaction chamber will be reflected back because of this boundary condition, soPspace=0.In addition,in the process of calculation, the antenna is regarded as the ideal conductor by default, there is no resistance loss of the antenna material,soPcopper=0.Due to the above conditions,the power on the antenna is equal to the absorbed power of plasma,soPant=Pabs.
As for the absorbed power of plasma,the specific plasma power spectrum functionS(k)is defined as[5]
Here,Jplasmais the current density of plasma, which can be expressed in terms of the cold plasma tensor[5]
The electric fieldEand current densityJin real space are excited by an antenna whose spectrum isKφ(k')=δ(k'-k).SinceS(k)is even,it can be used to simplify the calculation
Therefore,the absorbed power fromkto(k+dk)and from-kto-(k+dk)is
Then the total absorbed power is
2.2.Calculation model
HMHX is independently designed and constructed by Plasma Technology Research Center of Soochow University.The schematic diagram of the device is shown in Fig.1.The device can be divided into a source area and a plasmamaterial interaction(PMI)area.The source area has an internal diameter of 22 cm and a length of 80 cm; the PMI area has an internal diameter of 40 cm and a length of 40 cm.The discharge experiment is carried out under low pressure(5×10⁻³Pa-10×10-3Pa).The RF source has a frequency of 13.56 MHz and a maximum power of 2 kW.The antenna is a right-handed helicon antenna (inner diameter is 3.5 cm;length is 18 cm).[22]There are some supporting diagnostic equipments, such as Langmuir probe (Hiden ESPION RE/DC), optical emission spectra (OES, AvaSpec-2048FT-8-RM) and electrostatic quadrupole plasma (EQP, Electrostatic Quadrupole Plasma-Hiden Analytical 1000).[23]Twelve water-cooled magnetic field coils are surround the source area to provide a stable axial magnetic field.The axial magnetic field is generated by an electric current flowing through a magnet coil via.The current controls the strength of the magnetic field.The simulation diagram of magnetic field configuration and magnetic field intensity in this experimental device are shown in Fig.2.The current level is 400 A, and the maximum magnetic field at the central antenna position can reach 6700 Gs.[24]The plasma parameters and boundary conditions are shown in Table 1.
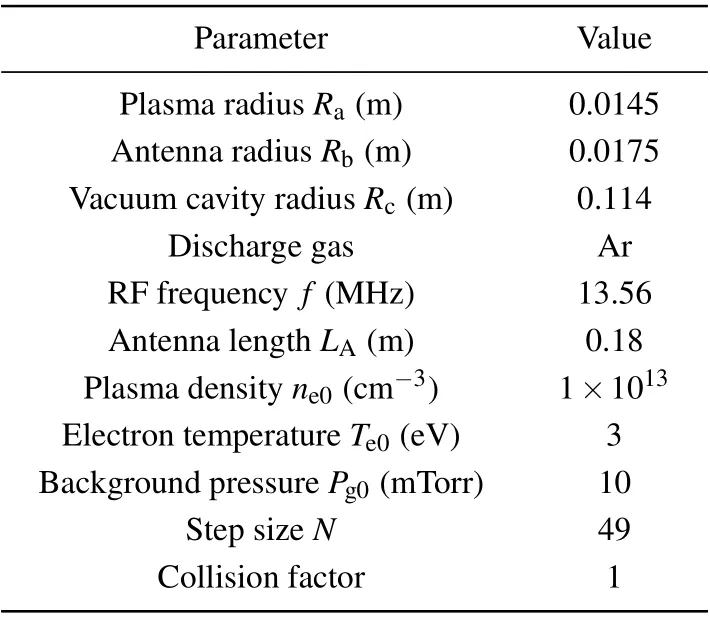
Table 1.Plasma parameters and boundary conditions.
The magnetic field density is uniform along the axial direction,and the density distribution of the particles is also uniform along the axial direction.The radial density can be determined by the following function:[5]
wheresandtare constants,farepresents the relative density atr=Ra,andne0is the density at the center of plasma.Iffa=0,thenω=Ra,the density function has only two parameters.Iffa/=0,the density function can be set to various density forms,such as parabolic functions[25]and Gaussian functions.

Fig.1.The schematic diagram of the device.[23]

Fig.2.Magnetic field configuration and magnetic field intensity.[24]
3.Results and discussion
3.1.Numerical simulation analysis
Based on the above theoretical formula and calculation model, this paper carries out a numerical simulation of HMHX.Construct two radial density structures:parabolic distribution (s= 2,t= 1,fa= 0.1) and Gaussian distribution(s=2,t=6,fa=0.01),[26]as shown in Fig.3.Although these two density distributions have the same peak in the axial direction,they have different density gradients in the radial direction.This has a more than important influence on the nonresonant mode conversion and energy absorption of H wave and TG wave.The total loading resistance for parabolic distribution drops quickly and is well below that of Gaussian distribution when the density increases overne0=1.8×1013cm-3.Therefore,forne0=1×1013cm-3in this study,parabolic distribution is better than Gaussian distribution in terms of power deposition effect.[15]Because of these, this article mainly takes the parabolic distribution as the research object.
First, the change of the magnetic field from 200 Gs to 800 Gs is studied with a sampling interval of 200 Gs, and the relative radial absorption power of plasma is calculated,as shown in Fig.4.
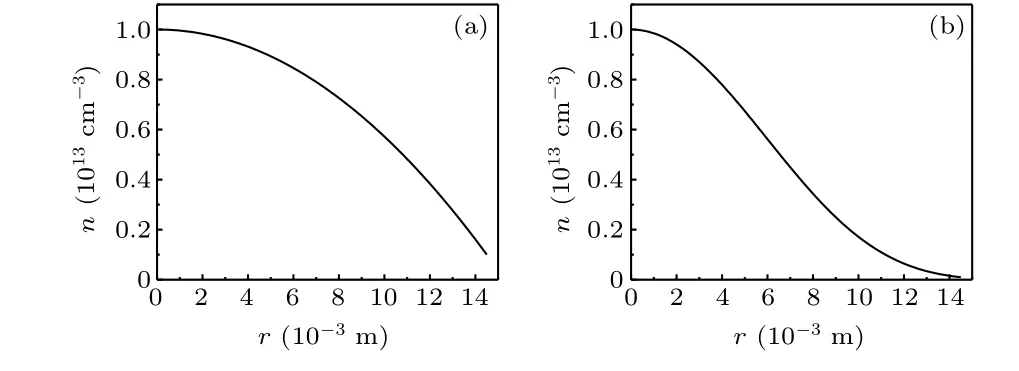
Fig.3.Plasma radial density distribution.(a) Parabolic distribution,(b)Gaussian distribution.
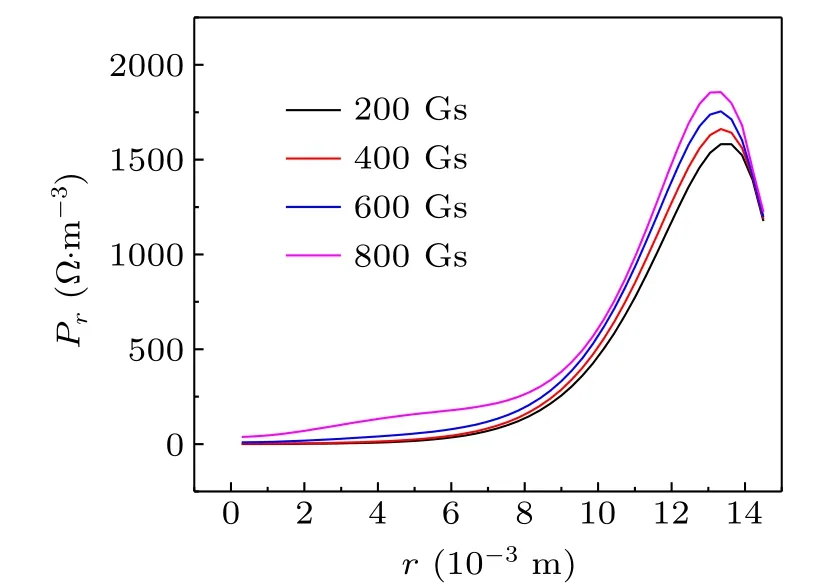
Fig.4.Relative absorption power of plasma under 200 Gs-800 Gs.
It can be seen from Fig.4 that between 200 Gs and 800 Gs,the relative absorption power corresponding to different magnetic fields is much larger at boundary than at center.This shows that when the magnetic field changes in this interval, it will not have much influence on the power deposition.The weaker relative absorption power at the center indicates that when the magnetic field is between 200 Gs and 800 Gs,a better effect of power deposition may not be produced,so the magnetic field still requires increasing.So choose to increase the magnetic field to 1000 Gs, and the relative absorption power is shown in Fig.5.It can be seen that, compared with 800 Gs, the relative absorption power at boundary is greatly increased, but at the same time the relative absorption power at center is also much larger than that at 800 Gs.This shows that when the magnetic field increases to 1000 Gs, the effect of power deposition changes significantly,and the increase of the relative absorption power at center indicates that the effect of power deposition is gradually getting better.The above analysis shows that for the discharge experiment in HMHX,a smaller magnetic field strength cannot produce a better deposition effect,so a magnetic field above 1000 Gs is selected for the experiment.
In order to further appreciate the influence of the magnetic field on the deposition effect in HMHX.Again the magnetic field range 1000 Gs-1800 Gs is selected for calculation and analysis, and the relative absorption power is shown in Fig.6.It can be seen from Fig.6(a) that when the magnetic field continues to increase from 1000 Gs to 1200 Gs, the relative absorption power at boundary is almost unchanged, but there is a significant addition at the center, which shows that the addition of magnetic field will make the deposition effect better.In addition, it is found that when the magnetic field strength continues to increase to 1400 Gs,the relative absorption power at center does not increase but decreases.This shows that in HWP discharge experiment,the magnetic field is not as large as possible.It is necessary to select the appropriate magnetic field according to different discharge conditions.As shown in Fig.6(b), when the magnetic field increased to 1600 Gs,the absorption power at center did not change significantly, but which at boundary showed an extremely obvious change.This may be because TG wave received a relatively high damping under a strong magnetic field.The short radial wavelength makes it difficult for TG wave to propagate in the plasma column,so influence range of TG wave is reduced from the radial full field to a very small range of the boundary.At the same time, the absorption of energy is gradually concentrated at boundary, indicating that a large magnetic field will lead to a serious uneven distribution of radial energy.[27]This situation will not affect the generation of HWP, but will reduce the deposition effect between antenna and plasma.

Fig.5.Relative absorption power of plasma under 1000 Gs.
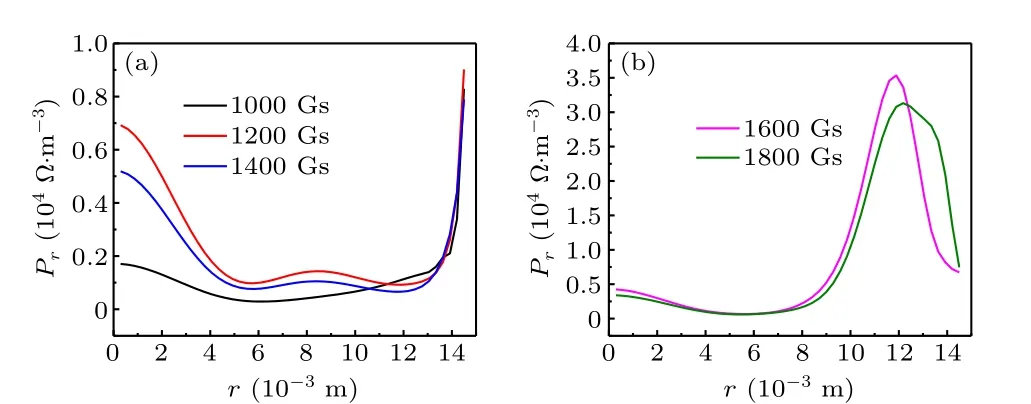
Fig.6.Relative absorption power of plasma under 1000 Gs-1800 Gs:(a)1000 Gs-1400 Gs,(b)1600 Gs-1800 Gs.
Through calculation and analysis of the magnetic field range of 200 Gs-1800 Gs,it can be obtained that a small magnetic field cannot produce high relative absorption power at center,and thus cannot achieve a good power deposition effect.A large magnetic field will cause the absorption of energy concentrating on boundary.At this point,the distribution of radial energy is severely uneven,which reduces the deposition effect between antenna and plasma.Finally, it can be obtained by comparing the relative absorption power under different magnetic fields that the best deposition effect can be get when the magnetic field is 1200 Gs.
3.2.Experimental result
In order to verify the influence of the magnetic field on the deposition effect between antenna and plasma in HMHX which is obtained by the simulation analysis.Different magnetic field strengths were selected for the discharge experiment, and the discharge results under each parameter were used for diagnostic analysis with Langmuir probe.[28-30]
In HMHX, the magnitude of the magnetic field is controlled by the direct-current(DC)power supply.After calculation,it is found that the magnetic field strength is proportional to the current, and the proportional relationship satisfies the following relationship:[31]
In the experiment,RF power was selected as 1500 W,the current of the DC power supply was selected as 60 A, 80 A,100 A, 120 A, 140 A, and the corresponding magnetic field strengths were 889 Gs,1185 Gs,1481 Gs,1777 Gs,2074 Gs.Argon gas was used as the gas source for the generation of HWP,and the gas flow rate was 50 sccm.
The discharge images under five different magnetic fields are shown in Fig.7.In laboratory experiments,it is found that pure argon discharge is blue,[23]but when the current is 60 A,the discharge image does not show the blue image.As the current increased to 80 A, the discharge image began to appear as a blue slender light column,and when the current increased further, the blue gradually deepened.But comparing the discharge image after 100 A, it is found that the change of the discharge image is not obvious.In the discharge process, it was discovered that when the current was 60 A,the discharge mode only had one jump,but there was no second jump,so it was speculated that the discharge did not reach H wave mode at this time.As the current increases, the antenna discharge mode jumps to the H wave mode.Due to the change of the discharge image is not obvious, the best discharge magnetic field needs to be determined by further diagnosis and simulation.
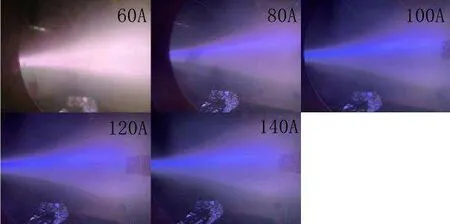
Fig.7.Discharge images at five different magnetic field strengths.

Table 2.Plasma densities of discharges at five different magnetic field strengths.
Langmuir probe was used to diagnose the discharge under these five magnetic fields.Through the analysis of the diagnostic data,the plasma density of the discharge was obtained,and the density is shown in Table 2.
In order to further explore the influence of the magnetic field on the power deposition in the experiment, the corresponding magnetic field and plasma density were resubstituted into HELIC code for calculation, and the calculation result was shown in Fig.8.Figure 8(a)shows that when the magnetic field is 889 Gs, the relative absorption power at center is much smaller than that at boundary.It indicates that the deposition effect is not good, and the discharge mode at this time cannot reach H wave mode.The result of calculation is similar to the result of preliminary calculation shown in Fig.4 and the discharge image shown in Fig.7.As shown in Fig.8(b), as the magnetic field increases to 1185 Gs, the relative absorption power at boundary increases rapidly, but the absorption power at center also increases rapidly.At this time, the difference of the relative absorption power between center and boundary becomes smaller, the distribution of the radial energy is relatively uniform,and a better deposition effect can be produced.As can be seen from Figs.8(c)and 8(d),when the magnetic field continues to increase to 1481 Gs and 1777 Gs, there is also a high absorption power in the center of antenna,but the corresponding absorption power at boundary is much larger than that at center.Although this does not affect the generation of HWP,it cannot achieve the best deposition effect.Finally,figure 8(e)shows that the radial relative absorption power changes significantly as the magnetic field increases to 2074 Gs.The absorption power at boundary increases rapidly and is much larger than that at center.This is because the absorption of energy is gradually concentrated at boundary under the strong magnetic field,resulting in serious uneven distribution of radial energy.Although this will not affect the generation of HWP,it will make the power deposition effect worse.It is similar to the result of preliminary calculation in Fig.6(b).
The results of discharge and further calculation show that the change of the magnetic field strength will indeed result in the power deposition effect between antenna and plasma.A small magnetic field will result in too low absorption power at center to generate HWP, while an excessively large magnetic field will result in a severely uneven energy distribution, and the best deposition effect cannot be achieved.Comparing the results of discharge and calculation under five different magnetic fields,it is concluded that the deposition effect between antenna and plasma can be best when the magnetic field is 1185 Gs.
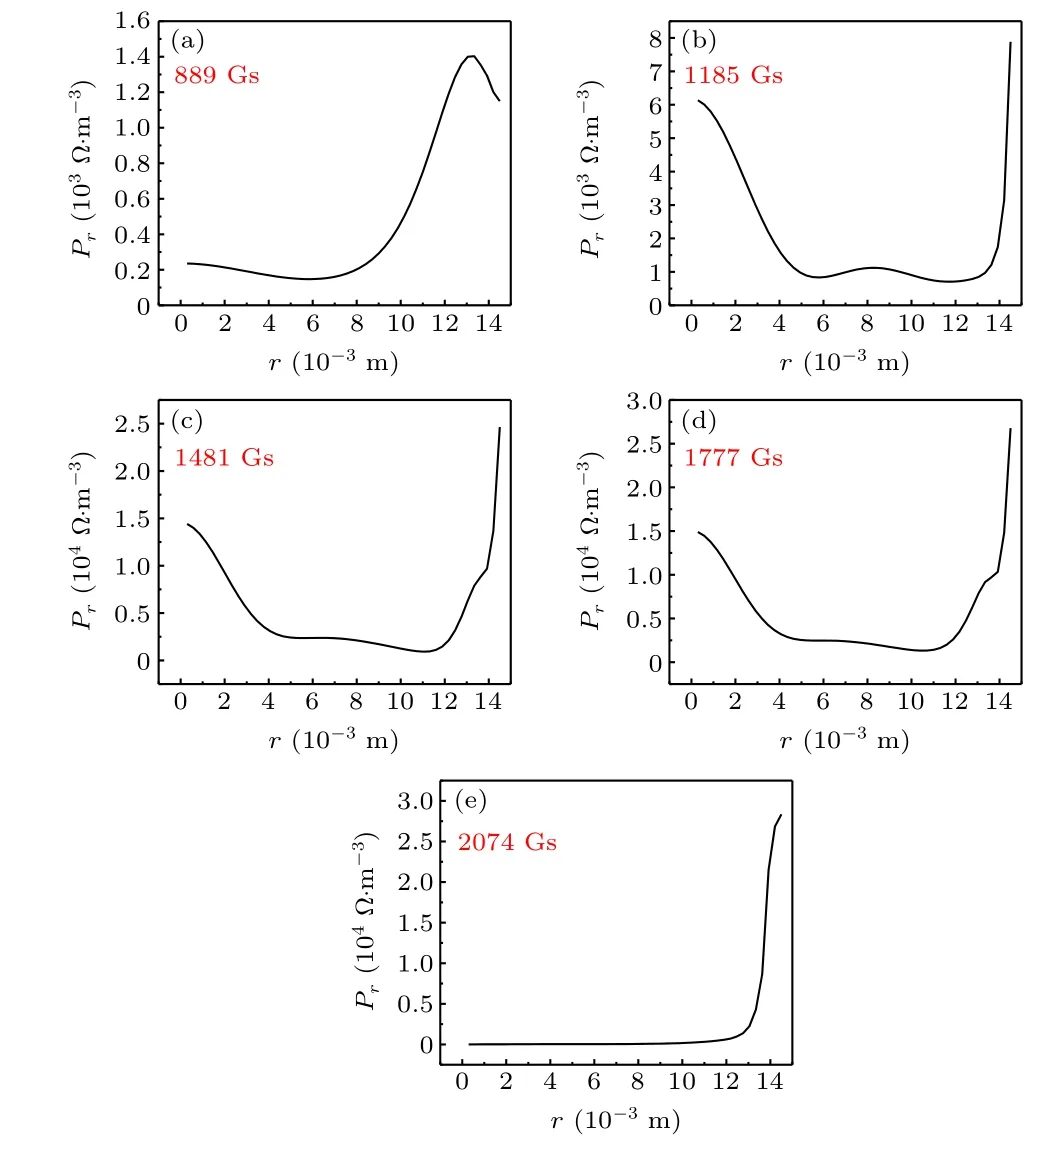
Fig.8.Relative absorbed power of plasma at five different magnetic field strengths: (a)889 Gs,(b)1185 Gs,(c)1481 Gs,(d)1777 Gs,(e)2074 Gs.
4.Conclusions and perspectives
In this paper, HELIC code is used to calculate the influence of different magnetic field strengths on the power deposition of H wave under the parabolic density distribution for HMHX.
The results of preliminary calculation show that it impossible to produce a good power deposition effect when the magnetic field strength is too small or too high.Comparing all the calculations,a better power deposition effect can be produced when the magnetic field is 1200 Gs.
In order to further verify the accuracy of the calculation results,a simple discharge experiment was carried out on HMHX.Under the condition that the parameters(such as discharge power, gas, and gas flow) were kept unchanged, five different magnetic field intensities were selected for discharge.A Langmuir probe diagnosis was carried out for five groups of experiments, and the plasma densities were obtained through the diagnosis.The different magnetic fields and plasma densities were substituted into HELIC code to obtain results of verification calculation.The results show that the best deposition effect can be obtained when the magnetic field is 1185 Gs,which is consistent with the results of preliminary calculation.
Through the research in this paper, it can be concluded that in the H wave discharge experiment, the change of the magnetic field will indeed have a greater impact on the power deposition between the antenna and the plasma.This article provides a reference for the selection of the magnetic field in the discharge experiment of HMHX,it can also provide certain technical support for the research on the discharge mechanism of HWP.
Acknowledgments
Project supported by the National Natural Science Foundation of China(Grant Nos.11975163 and 12175160)and the Priority Academic Program Development of Jiangsu Higher Education Institutions(PAPD).
猜你喜欢
小读者(2021年4期)2021-06-11
少儿科技(2021年4期)2021-01-11
百家讲坛(2020年1期)2020-09-02
少儿美术(快乐历史地理)(2019年9期)2020-01-18
造纸信息(2019年7期)2019-09-10
人大建设(2019年4期)2019-07-13
小哥白尼(军事科学)(2019年3期)2019-06-26
故事作文·高年级(2018年11期)2018-11-19
爆笑show(2015年3期)2015-05-08
- Chinese Physics B的其它文章
- Matrix integrable fifth-order mKdV equations and their soliton solutions
- Comparison of differential evolution,particle swarm optimization,quantum-behaved particle swarm optimization,and quantum evolutionary algorithm for preparation of quantum states
- Explicit K-symplectic methods for nonseparable non-canonical Hamiltonian systems
- Molecular dynamics study of interactions between edge dislocation and irradiation-induced defects in Fe-10Ni-20Cr alloy
- Engineering topological state transfer in four-period Su-Schrieffer-Heeger chain
- Spontaneous emission of a moving atom in a waveguide of rectangular cross section