
Identifying multiple influential spreaders in complex networks based on spectral graph theory
2023-10-11 07:56DongXuCui崔东旭JiaLinHe何嘉林ZiFeiXiao肖子飞andWeiPingRen任卫平
Chinese Physics B 2023年9期
Dong-Xu Cui(崔东旭), Jia-Lin He(何嘉林), Zi-Fei Xiao(肖子飞), and Wei-Ping Ren(任卫平)
School of Computer Science and Engineering,China West Normal University,Nanchong 637009,China
Keywords: spectral graph theory,Laplace matrix,influence maximization,multiple influential spreaders
1.Introduction
The influence maximization issue was first introduced by Domingos and Richardson in 2001.[1]One of the main problems of influence maximization is to findkcritical nodes in a complex network, so that the number of nodes being influenced in the network is maximized.The selection of critical nodes in the influence maximization problem is very significant for controlling the spread of epidemics,[2]controlling the spread of rumors,apprehending criminal gangs,[3]and tapping potential customers.[4]Many scholars have already made studies on related aspects.[5–10]
Among the algorithms to select out multiple influential spreaders in complex networks,the most commonly used basic idea is the top-kstrategy, which selects the topknodes with the largest values as the initial spreaders.For example, degree centrality (DC)[11]measures the importance of a node by the number of nodes that are directly connected to it.The greater the DC,the greater impact on the propagation,so the topknodes with the largest degree values are selected as the initial spreaders in the propagation process.However,DC only considers the first-order neighbors and fails to consider the connections of other nodes(non-neighboring nodes)with it in the algorithm.In view of this, Chenet al.proposed the LocalRank[12]algorithm,which considers fourth-order neighbors and improves on the DC.Betweenness centrality(BC)[13]and closeness centrality (CC)[14,15]consider global network information.BC measures how important a node is based on how many shortest paths pass through it.CC evaluates the importance of a node by the sum of its distances to other nodes in the network,with the closer being more important.In addition,there is ClusterRank,[16]which considers both the degree of the node and the clustering coefficient, and PageRank[17]and LeaderRank,[18]proposed as algorithms to calculate the importance of Internet pages.Fanet al.[19]proposed the cycle ratio(CR)algorithm,which proposes and defines the cycle number matrix and cycle ratio by analyzing the information contained in cycles in a network structure; the cycle number matrix contains the cycle of nodes in the network information,and the cycle ratio measures the importance of nodes.Algorithms such as these all select the topknodes with the largest values as the initial spreaders in the propagation process,i.e.,using the top-kstrategy.
Although the nodes selected by the top-kstrategy can improve the final affected scale, it causes local propagation if the selected nodes are clustered,because the top-ranked nodes selected by these algorithms might be clustered as a richclub.[20]Initially,some nodes that contribute to effective information propagation are selected.As more nodes are added to the rich-club,their contributions to effective information propagation become smaller.To avoid the occurrence of a richclub,some scholars have started to study the dispersion of selected nodes,such as excluding the selected nodes from being neighboring nodes, etc.Kempeet al.[21]proposed a “mountain climbing” greedy strategy to selectkcritical nodes, and the performance of this greedy strategy is close to 63%of the optimal performance.Chenet al.[22]proposed a“degree discount”heuristic algorithm to select critical nodes,which has a wider propagation range and lower time complexity.Zhaoet al.[23]applied the “coloring problem” in graph theory to find multiple influential spreaders in complex networks, by dividing nodes with the same color into same independent sets,and selecting a certain percentage of important nodes from each independent set; the larger the independent set is, the more nodes are selected, and this algorithm accelerates the propagation process.Guoet al.[24]proposed distance-based coloring algorithms, which significantly improve the final affected scale.Flaviano Moroneet al.[25]addressed the problem of quantifying nodes’ influence by finding the optimal (that is,minimal)set of structural influencers,and proposed collective influence (CI), a scalable algorithm to solve the optimization problem in large-scale real data sets.Zhanget al.[26]proposed the VoteRank algorithm, which selects multiple influential spreaders through each round of voting iterations and weakens the voting power of their neighbors; Sunet al.[27]proposed WVoteRank (WVR) based on the VoteRank algorithm, which can be used not only on unweighted networks but also on weighted networks.Fanet al.[28]proposed an algorithm to find critical nodes in complex networks by introducing a deep reinforcement learning framework.
However, although the dispersion strategy improves the final affected scale by increasing the dispersion of the selected nodes,the disadvantage is that the local structure of many critical nodes is not conducive to disease propagation.Based on this,this paper proposes a compromise strategy to balance the top-kstrategy and the dispersion strategy.In the experimental study of seven real networks and four synthetic networks generated by the LFR[29]model that is a community generation model proposed by Lancichinettiet al., the algorithm in this paper has a clear advantage in the final affected scale, compared with BC,CC,DC,CI,WVR,CR and FINDER.
The major contributions of this paper are shown as follows.
(i) From analysis of two network topologies, it is found that the local tree structure is more conducive to the spread of disease than the local cluster structure.
(ii)Using the eigenvectors of the Laplace matrix to classify structural importance of nodes,a balancing strategy is proposed in which nodes of the same class are not adjacent,while nodes of different classes are adjacent.
2.Preliminaries
2.1.Graph Laplacian quadratic form
Given a graphG=(V,E),Vdenotes the set of nodes in the graph,which is assumed to be of lengthN.The graph signal is a mapping describingV →R, expressed in the form of a unit vector:x=[x1,x2,...,xN]T,wherexidenotes the signal strength on nodevi.When studying the properties of the graph signal, the topology of the graph should be considered in addition to the strength of the graph signal.The Laplace matrix is the core object used to study the structural properties of the graph and is defined as follows:
whereAandDdenote the adjacency matrix and the diagonal matrix of the degree of the graph respectively,andDii=∑j Aijdenotes the degree of nodevi.Based on the Laplace matrix,we can define a very important quadratic form as follows:
whereTV(x) is the total variance of the graph signal, which sums the differences of the signals on each edge and portrays the overall smoothness of the graph signal.
Assuming that theNeigenvalues of the Laplace matrixLareγ1≥γ2≥···≥γNand the corresponding unit eigenvectors areu1,u2,...,uN,respectively,then equation(2)can be rewritten as
where ~xidenotes the coordinates of signalxon the unit eigenvectoruicorresponding toγi,Λdenotes the diagonal matrix consisting of eigenvalues andUdenotes the orthogonal eigenmatrix consisting of eigenvectors.From Eq.(3),it can be seen that when the graph signalx=ui, thenTV(ui)=γi.Hence,forγ1≥γ2≥···≥γN, the inequalityTV(u1)≥TV(u2)≥···≥TV(uN)holds.
2.2.SIR model
The SIR model[30,31]and the SIS model are two relatively well-known infectious disease models,and in this experiment the SIR model is used as an evaluation metric for the performance of the algorithm.In the SIR model, each node in the network can only be in one of the following three states at each time step: susceptible(S),infected(I),and recovered(R).At time stept,infected nodeurandomly selects the neighboring nodev.If nodevbelongs to susceptible nodes,nodeuinfects it with probabilityα.Meanwhile,infected nodeubecomes a recovered node with probabilityβ.The disease propagation process ends when all infected nodes in the network have become recovered nodes.At this point,the final scale of affected nodesF(n)is used as a measure of the performances of different algorithms,defined as follows:
whereN′andNRdenote the number of all nodes in the network and the number of nodes eventually recovered, respectively.In addition, in the SIR model, the basic reproduction numberλ=α/βreflects the disease propagation trend; for example,whenλ >1,the disease is able to spread throughout the population.
2.3.The K-core algorithm
TheK-core[32]algorithm is a subgraph mining algorithm to find the set of nodes in a graph that match a specified core degree,requiring each node to be connected to at leastKother nodes in that graph.In addition,K-core hierarchically divides the graph according toKvalues.For example,2-core removes nodes with degree less than 2 each time,3-core removes nodes with degree less than 3 each time,and each repeated removal of nodes as well as edges is specified byKvalues as shown in Fig.1.Thus,it shows that nodes with larger core degrees tend to have larger degrees, i.e., more neighboring nodes, which can play a greater role to a certain extent.

Fig.1.Schematic of the 1-core,2-core,and 3-core subgraphs.
3.Multiple influential spreaders identification algorithm
3.1.Node local structure analysis
From Subsection 2.3,it is clear that the outermost nodes of the network,i.e.,those withK=1,play a very limited role in the propagation process.Therefore, we only analyze the subgraph of the nodes withK ≥2 in the network.First, all nodes withK=1 are removed from the initial networkGto obtain the new networkG′.Next,the adjacency matrixA′of the new networkG′is normalized, which can be obtained as follows:

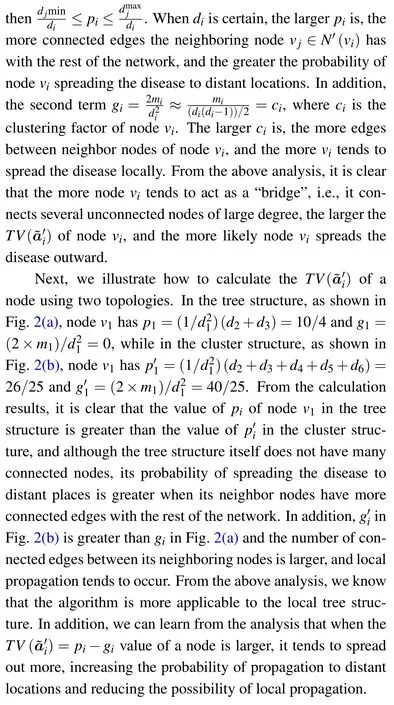

Fig.2.Two classical topological structures.(a) Local tree structure;(b)local cluster structure.
3.2.Trade-off strategy
Currently, there are two strategies for identifying a set of critical nodes: the top-kstrategy and the dispersion strategy.The top-kstrategy selects the topknodes with the largest value, but the value selected is a single measure that does not fully represent the nodes’propagation ability,causing the selected nodes to cluster together and overlap, resulting in a rich-club phenomenon.The dispersion strategy focuses on the dispersion of the selected nodes, so many critical nodes not conducive to disease propagation are selected.In view of the limitations of the above two strategies, this paper proposes a compromise strategy that balances the importance of critical nodes and the dispersion of critical nodes.
Given the eigenvectorsu1,u2,...,uNof the Laplacian matrix, the projectionsi jofon the eigenvectorujis defined as
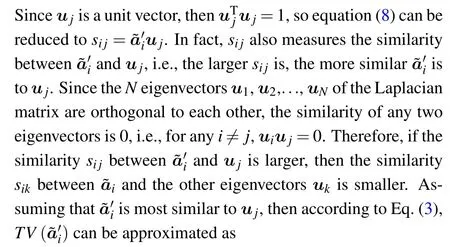
Therefore, we can use theNeigenvectors ofLas the benchmark category vectors to classify the importance of local structure ofNnodes in the network.Specifically,for each nodevi,the baseline category vector ordinal numberliwith the maximum similaritysijis calculated,i.e.,
The setCjof nodes contained in each benchmark category vectorujis then found,i.e.,
It is known from Subsection 3.1 that the largeris,the higher the probability of nodevispreading the disease outward.Hence, the importance of the local structure of nodes inC1,C2and other sets decreases successively.To select a set of critical nodes, we use the constraint that nodes in the same class are not adjacent, but nodes from different classes can be adjacent to balance the importance of structure and dispersion.Hence, we give priority to the nodes in the setC1when selecting a set of critical nodes.First, the nodes inC1are first sorted by similaritysi1from largest to smallest.Then,the first node inC1is selected as the critical node, and next the second critical node inC1is selected which is not adjacent to the first critical node and has the largestsi1,and so on,until there are no nodes to be selected inC1.If the number of selected critical nodes is not yet satisfied,we proceed to consider the second setC2.When selecting critical nodes fromC2,we only require that the selected nodes are not adjacent to the critical nodes already selected inC2.In other words, the critical nodes in each setCjare not adjacent to each other,but the critical nodes in two setsCiandCjcan be adjacent to each other.The above process is repeated until the given number of critical nodes is satisfied.
The pseudo-code for our algorithm is given as follows.Algorithm 1 demonstrates node classification based on the eigenvectors of the Laplace matrix,where steps 4–9 represent that calculating similarity between ~a′iandujof every node,and classifying nodes by maximum similarity.After that, we can select a set of critical nodes by the constraint that nodes in the same class are not adjacent to each other while different classes of nodes can be adjacent to each other.
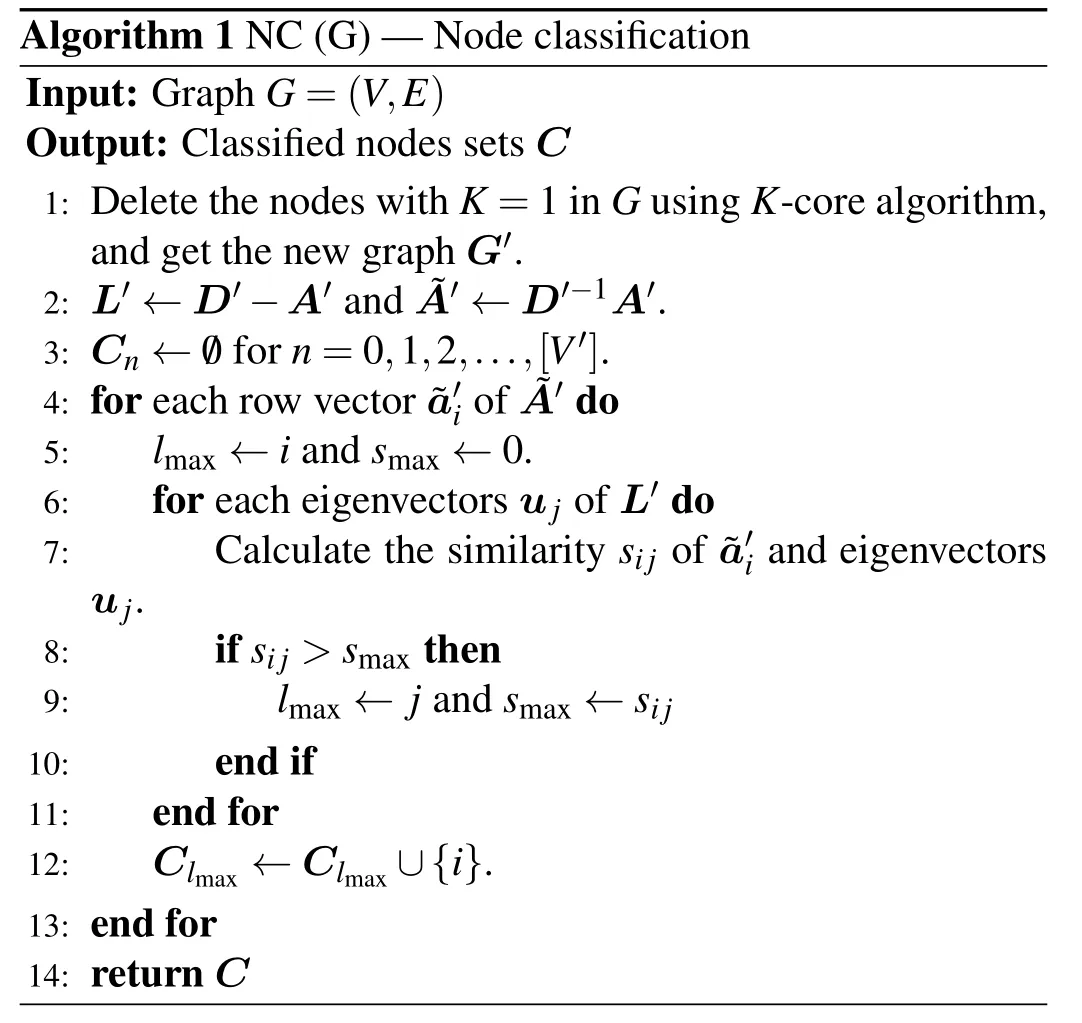
Algorithm 1 NC(G)–Node classification Input: Graph G=(V,E)Output: Classified nodes sets C 1: Delete the nodes with K=1 in G using K-core algorithm,and get the new graph G′.2: L′←D′-A′and ~A′←D′-1A′.3: Cn ←/0 for n=0,1,2,...,[V′].4: for each row vector ~a′i of ~A′do 5: lmax ←i and smax ←0.6: for each eigenvectors uj of L′do 7: Calculate the similarity sij of ~a′i and eigenvectors uj.8: if sij >smax then 9: lmax ←j and smax ←sij 10: end if 11: end for 12: Clmax ←Clmax ∪{i}.13: end for 14: return C
4.Experimental results
To verify the effectiveness of the proposed algorithm(LA) in this paper, experiments are conducted on seven real networks and four synthetic networks generated by the LFR model[29]in this section, and their performance is evaluated in comparison with seven benchmark algorithms.To better demonstrate the comparative effects between these algorithms,we divided the experiments into two main groups: top-kstrategy and dispersion strategy.The experiments are carried out on the SIR model, and the infection probability is uniformly set asα=〈ω〉/(〈ω2〉-〈ω〉), where〈ω〉 is the average degree of the network.
4.1.Benchmark algorithm
Seven benchmark algorithms are selected for comparison with the LA algorithm,namely,BC,[13]CC,[14,15]DC,[11]CR,[19]CI,[25]WVR,[27]and FINDER.[28]The details of the seven algorithms are described as follows.
4.1.1.Top-kstrategy
Betweenness centrality(BC),which measures the importance of a node by whether the shortest paths all pass through it, and selects the topknodes that have been passed through more often as the initial spreaders.
Closeness centrality (CC), which measures the importance of a node by the sum of its distances from other nodes in the network, and selects the topknodes with smaller sum of distances as the initial spreaders.
Degree centrality (DC), which measures the importance of a node by the number of its neighbors, and selects the topknodes with larger degree values as the initial spreaders.
Cycle ratio (CR), which defines a cycle number matrix in order to represent the cycle information of the network,by which a metric called cycle ratio can be calculated–quantifying the importance of a single node by measuring the extent to which a node participates in the shortest cycle associated with other nodes.
4.1.2.Dispersion strategy
Collective influence(CI),which selects the nodes through a scalable algorithm and believes low-degree nodes play a major broker role in the network,and despite being weakly connected,can be powerful influencers.
WVoteRank (WVR), which selects the nodes with the highest number of votes and not the neighboring nodes of the already selected nodes as the initial propagators in each round of voting by iteration.
FINDER (FINDER), which introduces a deep reinforcement learning framework that incorporates inductive graph representation learning to represent graph states and actions,and a deepQ′(quality of action score)network that combines reinforcement learning and deep neural networks to automatically learn the strategy that optimizes the objective to find critical nodes in a complex network.
4.2.Real networks
The seven real network datasets selected in this paper are C.elegans,[33]crime,[34]Email,[35]Yeast,[36]HI-II-14,[37]ca-HepPh,[38]and ca-AstroPh,[38]which are complex networks with nodes ranging from a few hundred to more than 10000.Among them, the C.elegans network is a neural network, in which nodes represent neurons in the nervous system of the worm,and edges represent connections between neurons.The crime network is a criminal network.The Email network is an email communication network at the University of Rovira,Spain,in which nodes represent users and edges indicate that users have sent emails to each other.The Yeast network and HI-II-14 network are protein–protein interaction networks.The Ca-HepPh network is a collaborative network, in which nodes are authors of published papers, and the edges represent that there are co-authored papers between two or more authors.The Ca-AstroPh network is a collaborative network,which covers scientific collaborations between authors of papers submitted to the astrophysics category.The basic topological properties of the seven real networks are shown in Table 1.
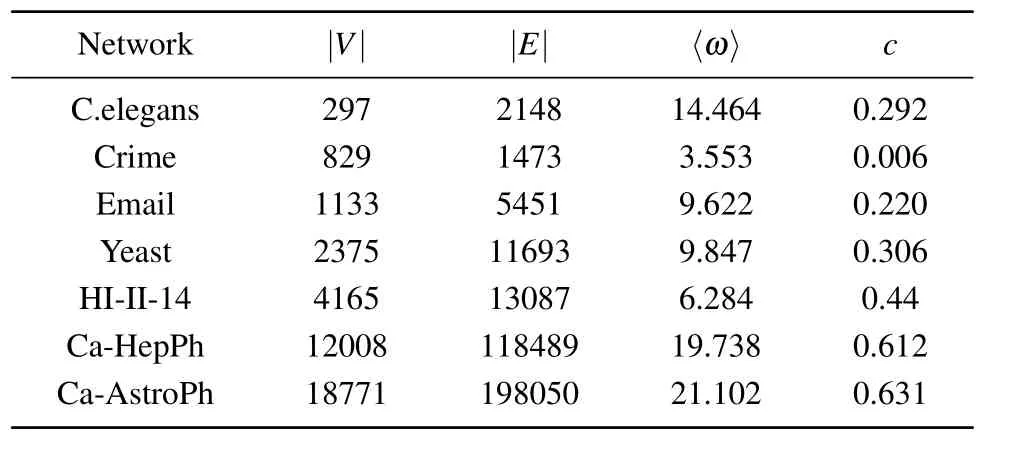
Table 1.Four basic topological properties of the real networks,including the number of nodes(|V|),the number of edges(|E|),the average degree of the nodes(〈ω〉),and the network clustering coefficient(c).
4.2.1.Top-kstrategy

Fig.3.Final affected scale F(n) with different percentages of source influential spreaders p on seven real networks, where (a)–(f) show the effects of top-k strategy algorithms and (g) and (h) show the effects of dispersion strategy algorithms.Experiments are carried out on the SIR model, where λ =1.2, α =〈ω〉/(〈ω2〉-〈ω〉).Each data point is the average of 100 independent runs.
Firstly,we investigate the effect of changing the percentage of source influential spreaderspon the final affected scaleF(n).Another variable parameterλis set to 1.2.As can be seen in Figs.3(a)–3(f),on the C.elegans network,the LA algorithm outperforms the other four algorithms overall.In particular,whenp ∈[0.03,0.10],the LA algorithm always performs better than the benchmark algorithms.On the Email network,Yeast network, ca-HepPh network, and ca-AstroPh network,the LA algorithm always brings a better influence range than DC,BC,CC,and CR whenp ∈[0.01,0.10].In particular,on the crime network,the LA algorithm obtains an improvement of spreading influence ranging from 5.53%to 17.30%over the second best algorithm CR.Similarly,the LA algorithm outperforms the second best algorithm CR with an improvement of spreading influence ranging from 15.77% to 29.10% on the ca-HepPh network.Moreover, on the ca-AstroPh network,the LA algorithm obtains improvements of 25.09%, 16.71%,52.29%and 54.49%compared with CR,BC,DC and CC,respectively.
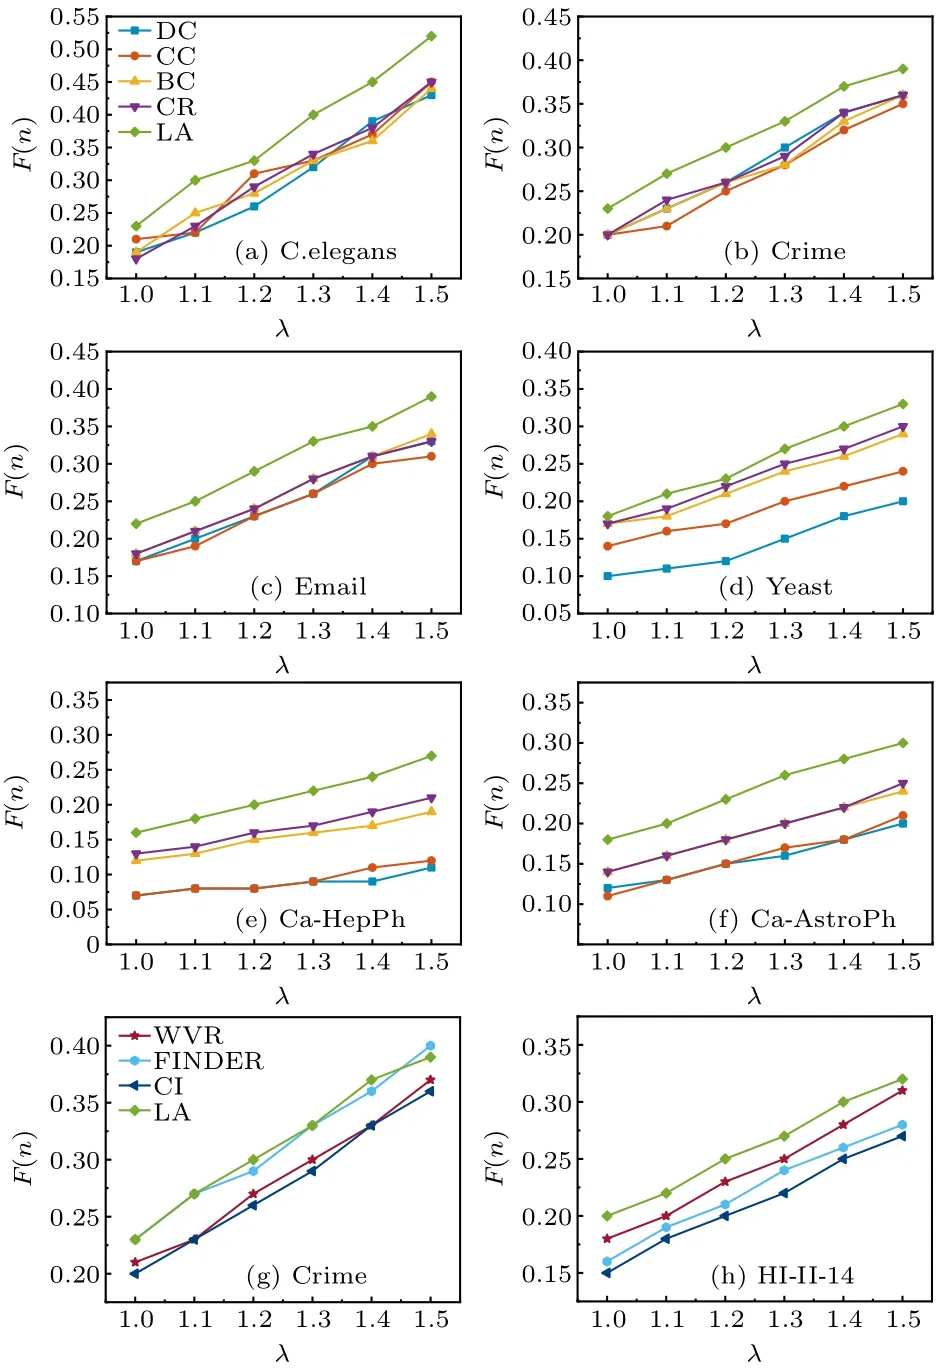
Fig.4.Final affected scale F(n) with different λ on six real networks,where (a)–(f) show the effects of top-k strategy algorithms and (g) and(h) show the effects of dispersion strategy algorithms.Experiments are carried out on the SIR model, where p=0.05, α =〈ω〉/(〈ω2〉-〈ω〉).Each data point is the average of 100 independent runs.
Secondly, we investigate the effect of changingλon the final affected scaleF(n).In the experiment, the percentage of source influential spreaders is set to a fixed value ofp=0.05.As can be seen in Figs.4(a)–4(f),it can be concluded that the LA algorithm performs better than the other four pure node centrality indicators algorithms on the C.elegans network, crime network, Yeast network, Email network, ca-HepPh network,and ca-AstroPh network.In particular,on the ca-AstroPh network, the LA algorithm obtains an improvement of spreading influence ranging from 23.61% to 28.56%over the second best algorithm CR.
4.2.2.Dispersion strategy
Firstly,we investigate the effect of changing the percentage of source influential spreaderspon the final affected scaleF(n).Another variable parameterλis set to 1.2.As can be seen in Figs.3(g)–3(h),LA algorithm always outperforms the other three dispersion strategy algorithms.On the HI-II-14 network, LA algorithm outperforms algorithm WVR with an improvement of spreading influence ranging from 3.26%to 13.04%,outperforms algorithm FINDER with an improvement of spreading influence ranging from 10.43%to 20.02%,and outperforms algorithm CI with an improvement of spreading influence ranging from 4.43%to 16.73%.
Secondly, we investigate the effect of changingλon the final affected scaleF(n).In this experiment,the percentage of source influential spreaders is set to a fixed value ofp=0.05.As can be seen in Figs.4(g)–4(h),the LA algorithm performs better than the dispersion strategy algorithms.In particular,on the HI-II-14 network, the LA algorithm obtains an improvement of spreading influence ranging from 6.18% to 14.51%over the second best algorithm WVR.
4.3.Synthetic networks
To verify the impact of community structure on our algorithm, we choose to compare it with the CR algorithm,since our algorithm tends to choose the local tree-like structure,while CR tends to choose the local cluster structure.The experiment is performed on four synthetic networks generated by the LFR model.[29]The LFR model accounts for the heterogeneity in the distributions of node degrees and of community sizes,which can be used to test the effect of community topology on algorithms.On the LFR model, both the degree and the community size distributions obey power laws,with exponentsε1andε2,respectively.In our experiments we generate the LFR networks we need by controlling a number of topologies,as follows: the four synthetic networks have the sameε1andε2,but different mixing parametersµ.The smaller theµ,the stronger the community structure.
The four networks have the same number of nodes and approximate number of edges.The experimental results are shown in Fig.5.On the LFR1 network and LFR2 network with higher clustering coefficients, the LA algorithm outperforms the CR algorithm.In particular, on the LFR1 network,the LA algorithm obtains an improvement of spreading influence ranging from 4.87% to 7.86% over the CR algorithm.On the LFR2 network,the LA algorithm obtains an improvement of 6.35%on average.However,on the LFR3 and LFR4 networks with smaller clustering coefficients, there is no significant improvement or decrease in the final affected scale of the LA algorithm, but for the CR algorithm, there is an improvement compared to that on the LFR1 and LFR2 networks.Hence,when the local clustering structure increases,it has no obvious influence on our algorithm.
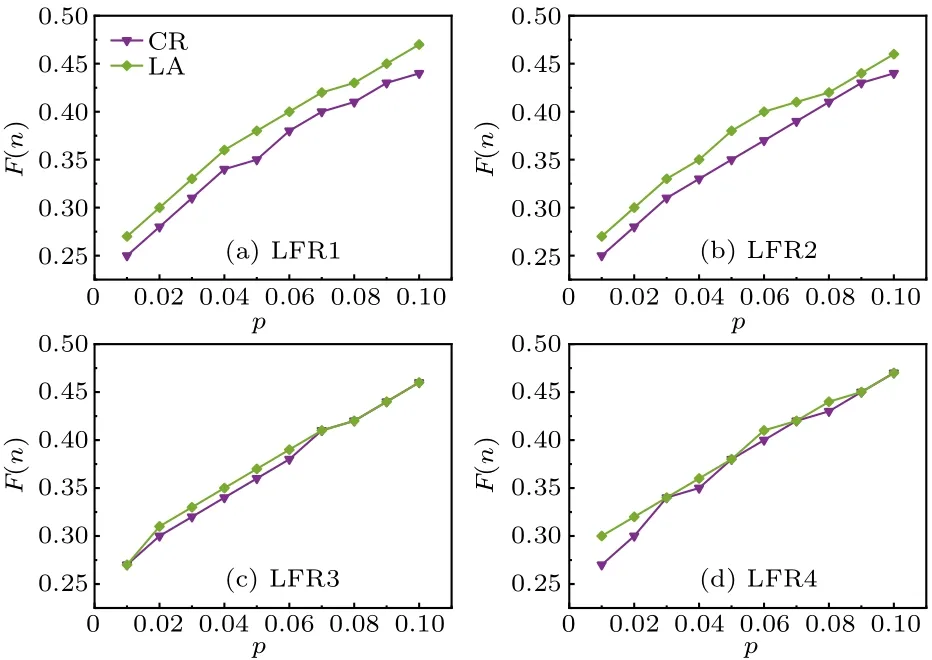
Fig.5.Final affected scale F(n) with different percentages of source influential spreaders p on the synthetic network, where λ =1.2, α =〈ω〉/(〈ω2〉-〈ω〉).Each data point is the average of 100 independent runs.
We can explain the above phenomenon from the following two aspects.First, from the basic topological data of the four synthetic networks in Table 2, we can see that the modularity(Q)of the LFR1 network and LFR2 network is higher than that of the LFR3 network and LFR4 network.For a network, the greater the modularity is, the stronger the community structure is,and the higher the local clustering coefficient.For the CR algorithm considering the shortest cycle ratio,the selected nodes are basically located in the core of the community.When the community structure is strong, the CR algorithm tends to cause local propagation within the community,while when the community structure is weak, the connected edges between communities increase,which increases the possibility of outward propagation,so the CR algorithm performs better on the LFR3 network and LFR4 network than on the LFR1 network and LFR2 network.Secondly, the nodes selected by the LA algorithm act as“bridges”and do not necessarily have many neighbors,but the neighbors of the selected nodes tend to have a very large degree and can propagate far away.Hence,on networks with a strong community structure,the LA algorithm tends to select the middle node of the local tree-like structure, which connects several communities and can expand the affected scale; on networks with weak community structure, the possibility of forming a local tree-like structure between nodes and nodes or nodes and communities increases, so the LA algorithm also chooses “bridge” nodes to expand the affected scale.In short, the LA algorithm always selects the“bridge”nodes of the local tree-like structure regardless of the community structure, and the affected scale is not influenced.The CR algorithm tends to select the core nodes in the communities, which results in a strong community structure network and reduces the affected scale.

Table 2.Eight basic topological properties of the synthetic network,including the number of nodes(|V|),number of edges(|E|),average degree(〈ω〉), node power-law exponent (ε1), community power-law exponent(ε2),mixing parameter(µ),modularity(Q),and network clustering coefficient(c).
5.Conclusion
In this paper, we propose a new algorithm for identifying multiple influential spreaders that balances the top-kstrategy and the dispersion strategy.To validate the performance of the LA algorithm, we evaluate it on seven real networks and four synthetic networks for comparison with seven benchmark algorithms.On the real networks, we observe the effect on the final affected scale by adjustingpandλ.From the above, we know that adjustingp ∈[0.01,0.10], the LA algorithm shows better performance on the C.elegans, crime,Email, Yeast, ca-HepPh and ca-AstroPh networks; when adjustingλ ∈[1.0,1.5],similarly,the LA algorithm outperforms the other seven benchmark algorithms.On the LFR networks,we observe the effect on the algorithm performance by generating networks with different community structures.This paper mainly shows the comparison between the LA algorithm and the CR algorithm.The experimental results show that the LA algorithm always selects the“bridge”nodes of the local tree-like structure,and outperforms other benchmark algorithms.
The LA algorithm can improve the final affected scale to some extent.However, finding multiple influential spreaders is still an open research issue.In this paper,we focus on the effects of tree and cluster structures on the LA algorithm,while the way other network topologies,such as star and ring structures,affect the LA algorithm is still a far-reaching topic to be studied.
Acknowledgments
Project supported by the National Natural Science Foundation of China (Grant No.62176217), the Program from the Sichuan Provincial Science and Technology,China(Grant No.2018RZ0081), and the Fundamental Research Funds of China West Normal University(Grant No.17E063).

- Chinese Physics B的其它文章
- Dynamic responses of an energy harvesting system based on piezoelectric and electromagnetic mechanisms under colored noise
- Intervention against information diffusion in static and temporal coupling networks
- Turing pattern selection for a plant–wrack model with cross-diffusion
- Quantum correlation enhanced bound of the information exclusion principle
- Floquet dynamical quantum phase transitions in transverse XY spin chains under periodic kickings
- Generalized uncertainty principle from long-range kernel effects:The case of the Hawking black hole temperature