
GIS partial discharge data enhancement method based on self attention mechanism VAE-GAN
2023-10-25 07:31QinglinQianWeihaoSunZhenWangYonglingLuYujieLiXiuchenJiang
Global Energy Interconnection 2023年5期
Qinglin Qian,Weihao Sun,Zhen Wang,Yongling Lu,Yujie Li,Xiuchen Jiang
1.School of Electronic Information and Electrical Engineering,Shanghai Jiao Tong University,Shanghai,200240,P.R.China
2.State Grid Jiangsu Electric Power Co.,Ltd.,Nanjing,211100,P.R.China
Abstract: The reliability of geographic information system (GIS) partial discharge fault diagnosis is crucial for the safe and stable operation of power grids.This study proposed a data enhancement method based on a self-attention mechanism to optimize the VAE-GAN method and solve the problem of the lack of partial discharge samples and the unbalanced distribution between different defects.First,the non-subsampled contourlet transform (NSCT) algorithm was used to fuse the UHF and optical partial discharge signals to obtain a photoelectric fusion phase resolved partial discharge (PRPD) spectrum with richer information.Subsequently,the VAE structure was introduced into the traditional GAN,and the excellent hidden layer feature extraction ability of the VAE was used to guide the generation of the GAN.Then,the self-attention mechanism was integrated into the VAE-GAN,and the Wasserstein distance and gradient penalty mechanisms were used to optimize the network loss function and expand the sample sets to an equilibrium state.Finally,the KAZE and polar coordinate distribution entropy methods were used to extract the expanded samples.The eigenvectors of the sets were substituted into the long short-term memory (LSTM) network for partial discharge fault diagnosis.The experimental results show that the sample generation quality and fault diagnosis results of this method were significantly better than the traditional data enhancement method.The structure similarity index measure(SSIM) index is increased by 4.5% and 21.7%,respectively,and the average accuracy of fault diagnosis is increased by 22.9%,9%,5.7%,and 6.5%,respectively.The data enhancement method proposed in this study can provide a reference for GIS partial discharge fault diagnosis.
Keywords: Partial discharge; Data augmentation; VAE-GAN; Self-attention; NSCT; Fault diagnosis
0 Introduction
A gas-insulated switchgear (GIS) is a key device in a power system,and its reliability has an important impact on the safe and stable operation of the power grid [1].Therefore,the insulation defects generated in the production and installation processes of GIS equipment and the insulation aging problems caused by the long-term operation of the equipment must be diagnosed promptly.Partial discharge(PD) is an important manifestation of an insulation fault.The effective and rapid identification of different modes of partial discharge is crucial for diagnosing the insulation status of GIS equipment [2].
In the partial-discharge diagnosis of GIS equipment,the phase-resolved partial-discharge (PRPD) spectrum can reflect the phase distribution of the partial-discharge signal in the power frequency cycle,and the different characteristics are apparent under different types of defects;therefore,it is widely used in partial-discharge pattern recognition [3].Simultaneously,with the introduction of multi-dimensional and multi-parameter fault diagnosis methods,the fluorescent optical fiber and UHF joint detection methods have been widely investigated because of their advantages of strong anti-interference and complementary image information [4].
Currently,with the development of artificial intelligence and the proposal of deep learning frameworks,feature extraction methods for PRPD maps are gradually developing in the direction of intelligence.Ref.[5] adopted the auto-encoder (AE) network optimized by the sparsity rule.This study uses AE algorithm to unsupervisedly extract the hidden layer features of the target,uses the sparsity rule to omit the inactive features,and automatically optimizes the hidden layer features of the target.Ref.[6] adopted a single-shot multi-box detector (SSD) that uses an attention module and deep convolutional network to extract the multisource partial discharge signal PRPD spectrum features and improve recognition efficiency.A sufficient number of training samples with a balanced distribution is the basis for effective recognition of the deep learning model to improve the generalization ability of the deep learning model and extract image features more comprehensively [7].However,because of the low rate of GIS PD defects and the difference in pulse density in PD signals excited by different types of defects,PD samples are scarce,and the distribution among different defects is unbalanced.
To solve the problem of image imbalance and improve the training effect of the classifier,data augmentation techniques have been extensively studied.The traditional methods include undersampling,oversampling,and image transformation.The undersampling method [8] is applied to the major sample set,which equalizes the sample sets by randomly deleting samples,resulting in a serious loss of effective information.Oversampling methods [9,10]balance the sample sets by copying minor samples or generating new minor samples by linear interpolation,but all of the above methods have the risk of overfitting.Image transformation [11] method,such as translation,rotation,and noise addition,cannot effectively increase information.
Recently,the proposal of a generative adversarial network (GAN) [12] has provided a new solution for the data enhancement of minority samples.The GAN uses random noise to generate simulated samples and uses confrontation training between the generator and discriminator to restore real sample features.This method is widely used in imaging,voice,and data augmentation.Ref.[13] adopts deep convolution generative adversarial networks (DCGAN) to increase the network depth of a GAN to generate rolling-bearing fault data.Ref.[14] proposed a boundary equilibrium GAN with an auxiliary classifier (ACBEGAN) to generate augmented images of a transformer partial discharge with label information.The input of the generator structure in the GAN was random noise to improve the training speed of the GAN structure and make the training process more targeted.Ref.[15] proposed a network called a variational autoencoding generative adversarial network (VAE-GAN) using the hidden layer output of the VAE encoder to guide the noisy input of the GAN generator.Ref.[16] adopted the pVAE-GAN structure optimized by the patch algorithm,which further improved the data-enhancement effect.Additionally,in the partial discharge of the GIS equipment,the PRPD spectra under different defect types are concentrated within a certain phase range,and there is less information at the edge of the image.The self-attention mechanism can focus the attention of the convolutional network on important information in the image,which reduces the difficulty of network training [17].
Aiming at the unbalanced distribution of partial discharge samples in GIS equipment,which leads to limited efficiency of pattern recognition under the deep learning framework,and considering the distribution characteristics of the partial discharge signal PRPD spectrum,this study proposes a VAE-GAN network optimized by a self-attention mechanism.This data enhancement method can realize the efficient expansion of PRPD maps under the partial discharge defect of GIS equipment.First,a non-subsampled contourlet transform (NSCT) is used to fuse the PD UHF and optical spectra to obtain a photoelectric fusion map with more comprehensive defect information.Subsequently,the VAE network is introduced into the GAN model to construct the VAE-GAN model.The excellent hidden layer feature extraction ability of the VAE is used to standardize the noise input of the GAN generator,reducing the training time and difficulty of the model.Subsequently,based on the characteristics of the concentrated distribution of the PRPD map information,a self-attention mechanism is introduced to learn the correlation between the global features of the map and focus on important information.Simultaneously,the Wasserstein distance and gradient penalty (GP) with better stability were introduced in the design of the loss function to avoid problems such as gradient disappearance and explosion [18].Finally,after data augmentation,a sufficient number of PD maps with a balanced distribution are input into the long short-term memory (LSTM) network for fault diagnosis,and the effectiveness of the proposed data augmentation method is verified.The experimental results prove that the proposed method can effectively achieve an interclass sample balance and improve the accuracy of partial discharge fault diagnosis.
1 PD signal data enhancement based on self-attention VAE-GAN
1.1 VAE-GAN network
In a traditional GAN,the input of generator G is random noise,which makes it difficult to train generator G and discriminator D in the early stage of model training and is prone to training collapse.As a latent space generation model with excellent performance,VAE can spontaneously learn the hidden layer features of the image and its probability distribution and can improve the input noise of the generator.Therefore,in the VAE-GAN model,the encoder output of the VAE model is used as the input of the GAN model generator,and the network depth increases simultaneously,effectively improving the data enhancement effect.Its structure is shown in Fig.1.

Fig.1 Network structure of VAE-GAN
In the VAE-GAN structure shown in Fig.1,the VAE and GAN share a generator part,and the generator input is determined by the encoded hidden layer variables of the real samples.The encoder network is composed of a fully connected layer that maps the high-dimensional feature reduction of the real input sample into the mean and variance of the hidden layer variables and provides constraints for the distribution of the input noise.The optimization goal of the encoder network is to minimize the KL divergence between the hidden layer variable distribution and the standard normal distribution.The loss function is defined as
whereμandσ2are the mean and variance of the hidden layer variables of the encoder network,respectively,and KL(·) is the divergence between the two data samples.
The generator network consists of a fully connected layer and a deconvolution layer,which reconstruct the lowdimensional inputxof the generator into high-dimensional generated samples.The discriminator network consists of a convolutional layer,pooling layer,and fully connected layer,which simultaneously extract features and reduce the dimensionality between the generated and real samples.Finally,the image authenticity label was output after activation using the sigmoid function.The optimization goal of the generator network is to render the discriminator unable to distinguish the generated samples from the real samples,and the optimization goal of the discriminator network is to accurately distinguish the generated samples.
To avoid the gradient disappearance problem caused by the use of JS divergence in traditional GAN,VAE-GAN uses the Wasserstein distance to measure the similarity between two samples,which can smoothly reflect the distance between the two samples under the condition that the generated samples and real samples slightly overlap at the beginning of training,improving the stability of training.
whereW(Pr,Pg) is the Wasserstein distance between the real samplexand the generated sampley,y=G(Z) is the generated sample,inf means seeking the infimum,Π (Pr,Pg) is the joint distribution between the real sample and the generated sample,andEis the expectation function.Zis the generator input noise synthesized by hidden layer variablesμandσ2.
wheree~N(0,1).Simultaneously,because VAE-GAN deepens the network depth,this study introduces the gradient penalty mechanism GP in VAE-GAN to limit the weight of neurons within a certain range and avoid the problems of gradient explosion,gradient disappearance,and overfitting during the training process.GP is defined as
whereλis the gradient penalty coefficient,||·||2is the second-order norm,ε~Uniform [0,1],andis the random sampling between the generated sample and the real sample.Based on the above improvements,the loss functions of the generator and discriminator after adding the Wasserstein distance and GP are expressed as
whereD(·) is the output result of the discriminator.
1.2 Self-attention module
In the training process of a neural network,the convolution process is a repeated extraction process of the local features of the target by the convolution kernel,owing to the limitation of the receptive field of the convolution kernel.This results in the convolution process being limited to the extraction of local features and ignoring the global feature association.Based on the human visual mechanism,the attention module highlights more closely related features through weighted calculations and is widely used in deep learning.
As an improvement to the attention mechanism,the self-attention mechanism only requires the output of the convolution process to enhance the global correlation information and does not depend on the final target output.It is suitable for generating and discriminating pictures in a GAN network.Fig.2 illustrates the structural diagram of the self-attention mechanism.

Fig.2 Self-attention mechanism module
In the self-attention module shown in Fig.2,convolutional kernelsq,k,andvare used to convolute the output of the previous layer of the network to obtain the query matrixq(x),key matrixk(x),and value matrixh(x).To obtain the key value of the key matrix corresponding to any pixel in the query matrix and represent the global correlation degree of the image,the calculation of the feature map ∂ of the selfattention mechanism is defined as
whereNis the pixel value of the convolution input imagexandSijis the correlation degree of pixelsxiandxj.Then,the feature map ∂ is multiplied by the value matrixh(x),the output of the feature map of the self-attention mechanism is obtained through the 1×1 convolution kernelv.
Currently,the self-attention mechanism feature map output fully considers the global relevance of the image and extracts the image features more efficiently.Finally,the feature map of the self-attention mechanism is superimposed on the original convolution inputxto obtain the outputyof the self-attention module.
whereγis the scale parameter.
1.3 Self -attention VAE-GAN module
In the PD map of the GIS equipment,the characteristic distributions of the UHF signal and the optical signal PRPD map show the characteristics of a concentrated distribution within a certain phase range,and there are a large number of regions containing less information in the spectrum.Taking a typical floating discharge defect as an example,its partial discharge UHF and optical PRPD maps are shown in Fig.3.

Fig.3 UHF and optical PD maps of floating defect
Since data enhancement aims for feature extraction to focus on areas with richer information in the maps,a selfattention mechanism was introduced into the VAE-GAN.model to improve data enhancement.The self-attention VAE-GAN network structure is illustrated in Fig.4.

Fig.4 Self-attention VAE-GAN network structure
1) The encoding network is composed of a convolutional layer and fully connected layer.“Conv.32@4×4 BN/LeakyRelu” in the network indicates that the number of feature maps in the convolutional layer is 32,the convolution kernel size is 4×4,and the sliding step length is 2,the pixel filling is 1.A BN layer (BN) and leaky rectified linear unit (LeakyRelu) are added after the convolutional layer to activate the output.“Fully connected/100” indicates that the number of neurons in the fully connected layer is 100.The image input size was 3×128×128 pixels,and the final output was the 100-dimensional mean and variance data,which constituted the generator input.
2) The generator network consisted of a fully connected layer and four deconvolution layers.First,the generator input noise Z is expanded and reconstructed into a 256×8×8 matrix using a fully connected layer.This matrix is then fed into a four-layer deconvolution structure,which can output one-dimensional noise as 3×128×128 generated samples.The number of convolutional layer feature map outputs was 128,64,32,and 3.The image size was 16,32,64,and 128.The convolution kernel size was 3×3.Except for the last layer,the activation function used a rectified linear unit(ReLU),and the self-attention module was placed after the outputs of the first and third deconvolutional layers.
3) The discriminator network consisted of four convolutional layers and two fully connected layers.First,the convolutional layer performs feature extraction on generated and real samples.Then,through the fully connected layer,the 256×8×8 matrix was reconstructed into 1024,1-dimensional data.Finally,the discrimination result is output using a sigmoid function.The convolutional layer structure and position of the self-attention module are consistent with those of the generator,and only the activation function is changed to the LeakyRelu function.
1.4 Algorithm process
The model proposed in this study uses the ability of the self-attention mechanism to focus on important information of the image and improves the data enhancement ability of the VAE-GAN model for the partial discharge PRPD atlas.The overall process is shown in Fig.5,and the specific steps are as follows.

Fig.5 Test verification of the overall process
1) To preprocess the original map,the NSCT algorithm is used to fuse the UHF and optical maps,and a photoelectric fusion map containing more information is obtained as the original dataset.
2) Integrate the VAE and GAN network structures and introduce the Wasserstein distance and gradient penalty mechanism with better smoothness performance,improve the loss function of the network,and enhance the stability and sample generation ability of the VAE-GAN model.
3) A self-attention mechanism was added to the VAE-GAN network,and the size of the scale parameter was adjusted to optimize the attention of the network to important information.
4) Use the trained self-attention VAE-GAN model to expand the sample data,use the feature extraction method of KAZE and the polar coordinate distribution entropy,and substitute them into the LSTM network for pattern recognition to verify the effectiveness of the proposed data enhancement algorithm.
2 Data augmentation results and analysis
2.1 Partial discharge sample sets
The experimental platform comprised a GIS tank,a 0-150 kV AC voltage regulator,a photomultiplier tube(HAMAMATSU-H10722-01),a UHF signal processing unit,a digital office amplifier (DDX 9121b),and an oscilloscope (LeCroy-HDO6000A).In addition,the sensor adopts photoelectric integrated sensor,the UHF monitoring frequency band is 300-1500 MHz,the fluorescence optical fiber excitation spectrum is 300-500 nm,and the GIS experimental tank is filled with 0.5 MPa SF6gas.The experimental platform is shown in Fig.6.

Fig.6 GIS experimental platform
Under a voltage level of 16 kV,needle-plate defects,floating defects,and free-particle discharge defects in the GIS equipment were simulated.After processing,210 sets of UHF optical-monitoring sample pairs were obtained.Each sample contained partial discharge signals of 50 power-frequency cycles and was converted into a PRPD spectrum to form a sample set.The sample set was randomly divided into a training set and a test set at a ratio of 2∶1,and the distribution of the sample set is shown in Table 1.

Table 1 The arrangement of channels
2.2 Network parameter setting
The network framework and parameter settings used in this study were as follows: CPU,i3 9100; GPU,RTX A4000; hardware memory: 32G,and model framework:Pytorch1.10.In Equation (4),the gradient penalty coefficient l is initialized to 10 and decremented every five rounds of iterations.In Equation (9),the scale parameter g is initialized to 0,and its value is changed to control the influence of the self-attention mechanism.The Adam algorithm was adopted for network optimization.The learning rate is set to 1×10⁻⁴.The total number of iterations is 100.
2.3 Photoelectric spectrum fusion based on NSCT
Some optical and UHF signals missed some information,which made image feature extraction difficult,by analyzing the photoelectric PRPD spectrum obtained from the experiment.Recently,fault-diagnosis methods based on multiparameter fusion have been widely used.As an image fusion method with superior performance [19],NSCT can decompose the original map into multi-scale and multidirectional high- and low-frequency sub-images,and then fuse the multi-parameter maps according to fusion rules.In this study,the NSCT parameters were set as follows.
1) Decomposition: Three-level scale decomposition is carried out for optical and UHF maps,and one lowfrequency sub-band map and three high-frequency subband maps are obtained.Then,one-,two,and three-level multi-scale are used for high-frequency sub-band maps.Directional decomposition divides the high-frequency subband map into two-,four-,and eight-directional sub-band maps,and each input map is decomposed into 15 sub-band maps of the same size as the source map,which perfectly preserves detailed image information in all directions.
2) Fusion: According to the fusion rule of averaging low-frequency coefficients and taking large high-frequency coefficients,the subgraphs of the optical and UHF spectra at various scales and directions are separately fused,and the NSCT inversely transforms the photoelectric fusion subgraph to obtain the photoelectric fusion of the PRPD maps.Taking the needle plate defect as an example,the maps before and after fusion are shown in Fig.7.The optical map compensated for the absence of a UHF map in the negative half-cycle.

Fig.7 PD maps before and after image fusion
2.4 Influence of the scale coefficient γ of the self-attention mechanism
The network structure built in this study added a selfattention mechanism to the generator and discriminator networks.The output of the self-attention structure after the convolutional layer is scaled by scale factor γ and superimposed on the output of the original convolutional layer to enhance the output effect.Therefore,the scale coefficient γ is closely related to the image quality generated by the generator and the discrimination effect of the discriminator.To optimize the network structure,the values of γ were selected as 0,1,and 2 after multiple experiments,and the image-generation effects were compared and analyzed.The figure is shown in Fig.8.

Fig.8 Quality of generated samples with different g
The scale factor γ was set to 0,1,and 2,and the generated samples of the three types of defects could fully represent the discharge characteristics under the defect types,with an obvious interclass contrast effect,and there was no problem of mode collapse.However,the experimental results show that when the scale factor γ is set to 0,the self-attention mechanism is removed,and scattered noise signals appear on the outer edge of the image of the sample generated by the needle-plate defect and the free particle defect because the PRPD map of the free particle defect has the characteristics of scattered distribution,and noise signals can easily interfere with the effect of the generated samples; samples generated by floating defects appear blurred at the edge of the image,which affects the quality of the generated samples.When the scale factor γ was set to 1 (i.e.,after adding the self-attention mechanism),the generated samples were stable and free from noise signal interference.As the scale coefficient g increased,the quality of the generated samples did not improve significantly; however,the complexity of the model and the training time increased.Experiments showed that adding a self-attention mechanism to the convolutional layer can effectively improve the attention of the generator and discriminator to the important information of the PRPD map and improve the quality of the generated samples.
Fscore=D(y) was selected as the evaluation index of the training speed to further compare the influence of different scale coefficients γ on the generated samples and analyze the training speed of networks with different γ values.The iterative process for the tip discharge defect is illustrated in Fig.9.

Fig.9 Change of Fscore during training process
The evaluation index,Fscore,is the recognition results of the samples generated by the discriminator.The closer theFscoreis to 1,the better the quality of the generated samples.Network training was completed when theFscorereached a steady state.In the initial stage of the model iteration process,the discrimination results of the discriminator for the generated samples under different scale coefficients γ are approximately 0.5.As the iteration progresses,the training process of the network structure with the self-attention mechanism becomes more stable,and fewer iterations are required for training.In the above experiments,a needle-plate defect was considered as an example.When γ=0,owing to the lack of pertinence in the training of the convolutional network,the model training process is unstable,and it is prone to the problem that the generation effect of specific images is better,and the generation effect of some images is poor.When γ=1 and 2,the training process is stable and converges rapidly.However,if γ increases,the difference between the generated sample and original image after self-attention enhancement increases,which is not conducive to the training process.
The structural similarity (SSIM) index was selected as the basis for the quality of generated samples to quantitatively evaluate the quality of the generated samples.The SSIM [20] index is composed of brightness,contrast,and structural differences among samples and measures the similarity among digital images.Its value ranges from 0 to 1.The larger the SSIM value,the higher the sample similarity.The simplified calculation formula for the SSIM index is expressed as
whereσandμare the statistical parameters between the real samplexand the generated sampley,and C1,C2,and C3 are constants.Table 2 lists the results of the SSIM for different scale coefficients γ.

Table 2 SSIM index of different scale coefficient γ
Comparing the conditions where γ equals to 0 and 1,SSIM index increased by 2.7%.When γ continued to increase to two,the SSIM index did not significantly increase.However,combined with Fig.9,the training time and difficulty of the model significantly improved.Therefore,in this study,γ is 1.
2.5 Quality analysis of generated samples
The algorithm was compared with the VAE-GAN and DCGAN algorithms to analyze the quality of the generated samples and further prove the effectiveness of the proposed data enhancement algorithm.The convolutional network structure of the comparison algorithm was consistent with that of the algorithm proposed in this study.The sample set shown in Table 1 was used for model training.The generated samples obtained after training are stable,as shown in Fig.10.

Fig.10 Comparison of generated images of different algorithms
The intuitive visual effect of the comparison results shows that the DCGAN can generate the main information of a real sample,but the image background contains considerable noise.The details of the generated samples of the VAE-GAN network are clear,and only the edges of the generated samples of needle-plate defects and free particle defects have scattered noise signals.However,unstable training during the model training process is a problem.Compared to the previous two models,the algorithm in this study improved the visual quality of the generated samples and generated clear and complete false samples.Simultaneously,the model training was stable and the training difficulty was reduced.
For the above experimental results,each type of PD defect randomly selected a pair of real samples and generated samples within one cycle and calculated the average value of the SSIM index.The results are summarized in Table 3.The SSIM values of the generated samples based on the algorithm of this study are above 0.86,which is 4.5% and 21.7% higher than the VAE-GAN and DCGAN algorithms,proving that the algorithm of this study has improved the data enhancement ability of unbalanced samples.

Table 3 Arrangement of channels
3 Fault diagnosis results and analysis
3.1 Feature extraction method
Data enhancement for unbalanced samples aims to improve the fault diagnosis ability of partial discharge defects in GIS equipment.Feature extraction is performed on an expanded sample set to verify the effectiveness of the proposed method.Recently,with the development of remote-sensing registration,more image feature extraction methods with high precision and fast responses have been proposed.Among these,a multiscale two-dimensional feature registration algorithm (KAZE) [21] based on a nonlinear scale space is used as a scale-invariant feature transform (SIFT) [22].Speed-up robust features (SURFs)[23] and other traditional algorithms have been widely used in image feature descriptor extraction.Moreover,the feature extraction result of the KAZE algorithm for the image is the coordinates of key feature points and their feature descriptors.Ref.[24] proposed a processing method based on polar coordinate trajectory entropy,which disperses feature vectors containing coordinate information to be expressed in polar coordinates and optimizes the feature extraction process.Therefore,this study uses a feature extraction algorithm based on KAZE and distribution entropy to analyze the effectiveness of the data enhancement algorithm.
After several experiments,the polar coordinates were selected,with the origin of the PRPD map as the pole and the pole as the center.The polar angle was divided into 16 segments,along with the polar diameter into four segments,and the polar coordinates were divided into 64 subregions.The feature points extracted by the KAZE algorithm were rotated by a rotation factorxand diverged into polar coordinates based on the rectangular coordinates(xi,yi).The mean value of the description vector of each feature point is used as the polar radius of the feature point.
whereρiandθiare the polar radius and polar angle of feature pointi,respectively,Nis the dimension of the feature descriptor,andSilis the feature descriptor.The rotation factorξwas set to 4 to ensure that the feature points were scattered across all polar coordinates.
After obtaining the distribution of the feature points in polar coordinates,the entropy value in each sub-region was calculated.Finally,a 64-dimensional feature vector was obtained for the image.
wherePjis the probability that the feature point falls in subareaj,njis the number of feature points in subareaj,Mis 64,andHcis the entropy of the subarea.
The generated samples obtained by the aforementioned data enhancement algorithms were subjected to feature extraction.Taking the needle-plate defect as an example,the distribution of the image feature points generated by different algorithms in polar coordinates is shown in Fig.11.The gray feature points in the illustration represent the feature distributions of the real samples,and the remaining feature points represent the feature distributions of the generated samples.The experimental results showed that the generated samples of the VAE-GAN and DCGAN models were mainly distributed on the edges of the real samples,and there were a large number of mismatching features.The feature distribution similarity between the generated and real samples in this algorithm is extremely high,which can accurately reflect the characteristics of the real samples and has a good expansion ability for imbalanced samples.

Fig.11 Distribution of feature points in polar coordinates
3.2 Comparison of recognition results of NSCT fusion maps
To verify the necessity of a map fusion,this study used the generated samples of the algorithm to expand the unbalanced sample set of the UHF,optical,and fusion maps (expanding to 150 groups of defect samples for each type).Then,a feature extraction algorithm based on the optimization of the polar coordinate distribution entropy was adopted for the fusion maps,the LSTM network was used for pattern recognition verification,and the optical and UHF maps were compared.The fault diagnosis accuracy was selected as the evaluation index,and the results are presented in Table 4.

Table 4 Accuracy rate of pattern recognition based on UHF、optical and fusion maps
The results show that,compared with fusion maps,fault diagnosis accuracies of optical and UHF maps are significantly lower,up to 89.7% and 87.4%.For fusion maps,the recognition accuracy of three types of defects slightly fluctuates,and the average recognition rate can reach more than 95%,up to 100%.Additionally,the recognition accuracy is improved by 12.9% and 14.5% compared with optical and UHF maps.
3.3 Fault diagnosis results
Using the generated samples of the algorithm to expand the unbalanced sample set (expanding to 150 groups of defect samples for each type),the feature extraction method based on KAZE and distribution entropy is used for the expanded sample set,and the feature vector is substituted into the LSTM network for fault diagnosis.Simultaneously,compared with the four methods of direct recognition of the original samples,simple image changes,samples generated by VAE-GAN,and samples generated by DCGAN,the superiority of the method in enhancing the unbalanced sample set is verified.In this study,the diagnostic accuracy of the PD defects was used as an evaluation index.The results are presented in Table 5.

Table 5 Comparison of fault diagnosis results based on different enhancement methods
Because of the unbalanced distribution of the original data,the accuracy of the fault diagnosis results based on the original maps was low,only reaching 74.8%.After expanding the sample set using SMOTE and image transformation of the image,the average accuracies of the diagnosis is increased by 5.7% and 13.9%.The data enhancement methods,DCGAN,ACGAN,and VAEGAN,improved the quality of generated samples,and the accuracy rate increased by 17.2%,11.3%,and 16.4%.Compared to the above methods,the method in this study further improved the quality of the generated samples and optimized their characteristic distribution of generatedsamples.Simultaneously,compared to the original data,the average accuracy rate of the method has increased by 22.9%,and compared with the above methods,it has increased by 17.2%,9%,5.7%,11.6%,and 6.5%.Therefore,the method proposed in this study is superior in terms of the data augmentation ability for unbalanced samples.
Furthermore,70%,50%,and 30% of training sets were selected for fault diagnosis to verify the effectiveness of the method in this study under different proportions of training sets.The results are presented in Table 6.Under the conditions of three types of training set proportions,the accuracy of fault diagnosis can reach at least 92%,verifying that the sample set expanded by the method in this study has strong robustness.

Table 6 Comparison of fault diagnosis results based on different training sets
In fault diagnosis,the confusion matrix provides the recall rateRwand precisionPdof the diagnosis result,which provide the basis for an accurate judgment of each defect category.The calculations ofRwandPdare expressed as
wherewis the number of PD defect types,Twis the number of samples correctly identified in various types of defects,Kwis the total number of samples in defect categoryw,andDwis the number of samples in diagnostic categoryw.The confusion matrices when the proportions of the training set are 70% and 30% are shown in Fig.12.Based on the confusion matrix that under the condition of a high proportion of the training set,all three defect types can be effectively identified.Under the condition of low proportion of training set,a small number of defect types are misjudged due to the similarity of needle-plate and floating defect maps,but the average accuracy rate can still reach more than 90%.

Fig.12 Confusion matrix based on different training sets
3.4 Applicability analysis of pattern recognition
To verify the superiority of the proposed algorithm in feature extraction of the local map,the statistical parameter method and proposed algorithm were used to extract feature vectors from the expanded sample sets,and pattern recognition was performed in the LSTM network.The statistical parameter method selects the Tamura texture feature,grey-gradient co-occurrence matrix,Hu-invariant moment,and color moment of the image as feature parameters.
Simultaneously,the proposed algorithm was compared with a deep learning algorithm.In this section,convolutional neural networks (CNNS) are used to extract the features of fusion maps,and the recognition results are output by the softmax classifier.The CNN consists of four convolutional layers,four pooling layers,and two fully connected layers.The size of the convolutional nuclei was 3 × 3,the step size was 1,and the structure of the convolutional layers was 16-32-64-128.The numbers of nodes in the fully connected layer were 256 and 3,respectively.Table 7 lists the results of patter recognition.
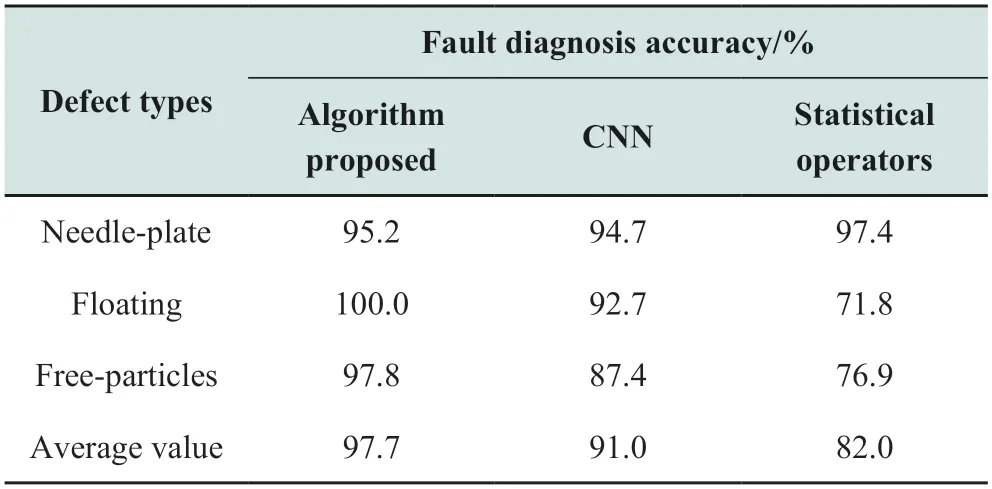
Table 7 Accuracy rate of pattern recognition based on different feature extraction methods
The results show that the accuracy rate of needle plate discharge by the statistical parameter method is high,but there is a serious misjudgment regarding floating and freeparticle defects.CNN network improved the recognition accuracy,and the average recognition rate increased by 9% compared to statistical parameter method.The algorithm in this study can effectively improve the feature extraction effect,and the average recognition rate can reach more than 95% and up to 100%.Compared with the first two methods,the recognition rate was improved by 15.7% and 6.7%,respectively,and the recognition rates of floating and freeparticle defects were significantly improved.
4 Conclusions
This study proposes a partial discharge data enhancement method based on a self-attention mechanism to optimize the VAE-GAN to address the problem of a lack of partial discharge samples and unbalanced distribution between classes in GIS equipment fault diagnosis.The conclusions are as follows.
1) The Wasserstein distance and gradient penalty mechanism are introduced in the VAE-GAN network structure,enhancing the stability of network training and reducing the risk of “gradient disappearance” and “gradient explosion”.
2) A self-attention mechanism was used to optimize the VAE-GAN,which improved the attention of the network to the key information of the sample,reduced the difficulty and duration of network training,and significantly improved the stability of the training process.
3) The quality of the generated samples of the selfattention VAE-GAN significantly improved.Compared with the VAE-GAN and DCGAN networks,the SSIM values increased by 4.5% and 21.7%,respectively.
4) The feature distribution of the sample set expanded by the method described in this study was closer to that of a real sample.The feature vector is extracted by KAZE and the polar coordinate distribution entropy method.Then,it was substituted into the LSTM network for fault diagnosis.Compared to traditional data and traditional data enhancement methods,the average diagnostic accuracy increased by 22.9%,9%,5.7%,and 6.5%,respectively,and the diagnostic results have good robustness.
5) This study mainly focuses on the study of singlesource partial discharge in GIS; however,for multi-source partial discharge,the accuracy of the pattern recognition problem will be affected.Subsequently,data enhancement and pattern recognition of multisource partial discharge will be investigated to cope with the complex operating environment on-site.
Declaration of Competing Interest
We declare that we have no conflict of interest.
 Global Energy Interconnection2023年5期
- Global Energy Interconnection的其它文章
- Missing interpolation model for wind power data based on the improved CEEMDAN method and generative adversarial interpolation network
- A Special Issue: “Forecasting of Clean Energy and Controlling of Smart Grid for Sustainable Energy” for Global Energy Interconnection
- Wind-speed forecasting model based on DBN-Elman combined with improved PSO-HHT
- Dynamic grouping control of electric vehicles based on improved k-means algorithm for wind power fluctuations suppression
- A fuzzy control and neural network based rotor speed controller for maximum power point tracking in permanent magnet synchronous wind power generation system
- State-of-the-art review of MPPT techniques for hybrid PV-TEG systems: modeling,methodologies,and perspectives