
Simultaneous detection of CH4 and CO2 through dual modulation off-axis integrated cavity output spectroscopy
2023-11-02 08:10YiXuanLiu刘艺璇ZhouBingWang王周兵XinXinWei韦欣欣JingJingWang王静静XinMeng孟鑫andGuiLinMao毛桂林
Chinese Physics B 2023年10期
Yi-Xuan Liu(刘艺璇), Zhou-Bing Wang(王周兵), Xin-Xin Wei(韦欣欣),Jing-Jing Wang(王静静), Xin Meng(孟鑫), and Gui-Lin Mao(毛桂林)
School of Physics and Electronic Engineering,Jiangsu Normal University,Xuzhou 221116,China
Keywords: off-axis integrated cavity output spectroscopy,wavelength modulation,radio frequency(RF)white noise,simultaneous detection
1.Introduction
Climate change is a major global issue and can be attributed to global warming, primarily caused by greenhouse gas emissions from human activities.According to the“State of the Global Climate 2021”report released by the World Meteorological Organization(WMO),the atmospheric concentrations of CO2, N2O, and especially CH4reached record highs in 2021 and continued to rise in 2022.[1]CH4and CO2are the critical greenhouse gases.The WMO has continuously measured their atmospheric concentrations at more than 100 monitoring sites worldwide over many years.The findings indicated that CO2concentration has increased since 1750,with an increase of 2.5 ppm to 415.5 ppm only in 2021.Furthermore, CH4increased by 18 ppb to 1908 ppb in 2021, more than 2.5 times the pre-industrial level.[2]Accurately detecting atmospheric greenhouse gases is crucial to environmental monitoring and sustainable human development.In particular,highly sensitive, multi-component, real-timein-situdetection technologies will contribute to the research and management of environmental problems in local areas.
Off-axis integrated cavity output spectroscopy (OAICOS)[3,4]is a notable method used for the detection of trace gases.It has attracted considerable research attention recently because of its simple structure,high system stability,and ability to be easily integrated.In OA-ICOS, light is reflected multiple times between mirrors by injecting an off-axis beam into a high-precision optical resonance cavity with an effective optical absorption path of 1 km-30 km.This method can effectively enhance absorption signals but introduces cavity mode noise, which is the primary noise in an OA-ICOS system.In theory, cavity mode noise decreases with the distance of the incident beam from the cavity axis.Therefore,cavity mode noise can be eliminated by using a sufficiently large high-reflection lens to build an optical cavity; however,this solution is not feasible in practical applications.In recent years, some studies have injected radio frequency(RF)white noise into laser beams to achieve current disturbance, effectively suppressing cavity mode noise;this method has increasingly attracted research attention.Ciaffoniet al.[5]injected filtered 30-MHz RF noise into a 764-nm vertical-cavity surfaceemitting laser,resulting in a fourfold increase in the sensitivity of the oxygen sensor and an average minimum detectable absorption of 4.3×10⁻⁵within a sampling time of 1 s.Manfredet al.[6]increased the laser linewidth effectively by applying a broadband RF noise into a mid-infrared quantum cascade laser to observe CO2absorption near 1890 cm-1with an average minimum detectable absorption of 5.5×10⁻³Hz-1/2within a sampling time of 100 ms.Shaoet al.[7]used-25-dBm RF white noise to achieve laser current disturbance for the simultaneous detection of N2O and CO with 350-ppb concentrations.The standard deviation (SD) of the direct absorption spectra after noise addition was improved by approximately 1.6 times compared with that without RF noise.
To improve detection sensitivity,OA-ICOS is often combined with wavelength modulation spectroscopy (WMS) as WM-OA-ICOS to further reduce the noise related to lowfrequency fluctuation(1/fnoise)in the laser intensity and in the detection chain.Kasyutichet al.[8]reported the detection of the second harmonic (2f) signal of O2near 687.1 nm using the WM-OA-ICOS technique.The detection sensitivity of this method was seven times higher than that achieved by directly detecting the intensity of the integrated cavity output signal.Zhaoet al.[9]reported that the signal-to-noise ratio (SNR) of WM-OA-ICOS (with a detection sensitivity of 3.6 ppmv·Hz-1/2) was higher than that of OA-ICOS by 14 times.Wanget al.[10]simultaneously applied wavelength modulation and RF white noise in OA-ICOS and improved the system detection limit by more than six times.In addition,this method eliminated cavity mode noise while suppressing background noise in the system, further improving the detection limit for trace gases.
With the exacerbation of existing atmospheric problems,detecting single gas components cannot satisfy research requirements.To this end, the simultaneous detection of twocomponent or multicomponent gases is crucial to advancing existing environmental monitoring techniques.Donget al.[11]used optical switching with membrane separation technology to construct a set of test prototypes for the simultaneous measurement of CH4and CO2dissolved in seawater, with detection limits of 0.56 ppb and 0.62 ppm, respectively.Wanget al.[12]realized the simultaneous measurement of atmospheric CO2and CH4by using a “dual-channel laser” mechanical structure combined with an off-axis integrated cavity.In addition, time-division multiplexing was used to separate the signals emitted by the dual-channel laser light source.The method required additional supporting hardware and software design,and the SDs of the original concentrations of CO2and CH4were 0.278 ppm and 1.794 ppb,respectively.
In the present study, high-precision simultaneous detection of two-component gases was realized by using OA-ICOS combined with RF white noise modulation and wavelength modulation (RF-WM-OA-ICOS) and a dual-channel beam combiner.Accordingly, an RF-WM-OA-ICOS system was constructed to detect CH4and CO2simultaneously, and the performance of the system was evaluated.
2.Basic principle of RF-WM-OA-ICOS
Cavity mode noise in OA-ICOS is attributable to the coherence of laser light.[13-15]The narrower the laser bandwidth,the better the coherence of the laser.When a laser beam is incident on a resonant cavity, it reflects multiple times between two highly reflective lenses, resulting in many concurrent beams in the cavity and an increase in effective optical paths.If a laser beam is incident along the cavity axis,all reflected beams are aligned with the cavity axis.Thus, all the reflected beams coincide with each other,resulting in coherent superposition.Meanwhile, only a few cavity mode outputs,with each cavity mode having high light intensity.[13]These cavity modes cause severe noise in the absorption spectrum.If the laser is incident off-axis,the coincidence rate between the reflected beams decreases,and the probability of correlated superposition also decreases.[14]More cavity mode outputs are produced,decreasing the average energy of the cavity modes.When the output cavity mode density is sufficiently high, the energy of each cavity mode decreases to a considerably small value,suppressing the cavity mode noise.The coherent superposition effect and cavity mode noise also increase with the coherence of the laser.[15]When the coherence of the laser is low,the coherent superposition effect is not prominent,meaning that the cavity mode noise is suppressed.When the control current of the laser is interfered by RF white noise, the output laser linewidth increases;simultaneously,the coherence of the laser decreases.[16,17]The mutual interference between the laser beams decreases,and the cavity mode noise is suppressed because of the reduced coherence of the laser beams.In particular,when the laser linewidth is larger than the free spectral range,the cavity mode tends to disappear,and the output signal appears continuous, making the optical cavity equivalent to the traditional optical multi-pass cell.[18,19]
When a laser beam with an intensity ofI0and a frequency ofνpasses through an absorbing medium with a thickness ofL,the intensity of the transmitted beam is low because of the partial absorption of light energy by the medium.The intensity of light decreases with the concentration of the absorbing medium.The intensity of the transmitted light can be expressed as follows:[13]
whereσ(ν)andNdenote the absorption cross-section of the absorbing molecules(cm2·molecule-1)and molecular number density(molecule·cm-3), respectively.When a laser beam is incident off-axis on the cavity and the one-way absorption loss is considerably smaller than the cavity lens loss(σ(ν)NLc≪1-R),the effective absorption optical path(Leff)obtained can be expressed as
whereLcdenotes the distance between the lenses that constitute the cavity.A modulating currenti(t)with a cosine signal of frequencyfon it can be expressed as follows:[20]
wherei0andamdenote the center current and amplitude of the modulating laser signal, respectively.The modulation of the current results in a corresponding frequency modulation.The instantaneous frequency of the output signal can be expressed as
whereν0andaνdenote the center frequency and amplitude of the modulated signal,respectively.Because both the modulating current and the detection signal are periodic functions,equation (4) can be expressed as a Fourier series,[21]and its harmonic componentsνncan be expressed as
When the gas is weakly absorbed to the ppm scale andσNL ≪1,equation(5)can be simplified as
According to Eq.(6),the amplitude of the harmonic component 2I0NL/πis proportional to the absorption molecule concentration when the effective absorption optical rangeLis held constant.The harmonic amplitude decreases sharply with the increase in the number of harmonics.The 2fsignal has the highest amplitude among the even harmonic signals.The line shape is symmetrical with the absorption peak as the center.[19,21-23]The modulation depth is expressed asm=δν/Δν, where Δνdenotes the half-width at half maximum (HWHM) of the absorption spectrum line.Thus, the second harmonic component of the signal is often used for concentration inversion.
3.Experimental setup
The structure of the proposed simultaneous twocomponent gas detection RF-WM-OA-ICOS system is shown in Fig.1.The system comprises an optical cavity composed of a self-designed stainless-steel cavity and two built-in spherical lenses with a reflectance of 99.999%, a diameter of 25.4 mm and a curvature radius of 1 m.The off-axis incident optical fiber frame, focusing lens, high-pass filter, and detector are integrated with a cage structure produced by Thorlabs.The laser sources include 1603 nm and 1653 nm distributed feedback(DFB)lasers,with the temperature and current controlled using Thorlabs TED200C&LDC202C and SRS Model LDC501 laser controllers, respectively.The two laser beams are coupled into one laser beam using a 2×1 fiber combiner and applied incident to the 26-cm optical cavity using a fiber collimator.The absorption lines corresponding to CH4and CO2are near 6046.96 cm-1and 6243.91 cm-1, respectively.The center temperature and current of the laser used for CO2measurement are 21.5°C and 72 mA, respectively.The operating center temperature and current of the laser used for CH4measurement are 19.5°C and 77 mA,respectively.The RF noise source coupled with the DFB lasers using a Bias-T(Thorlabs, LM14S2-BT) to increase the linewidth of the output laser.A high-frequency sine wave generated by a phaselocked amplifier (SRS, SR830) and a low-frequency triangle wave generated by a signal generator(REGOL,DG1062)are superimposed using an adder and input to the laser controller for wavelength scanning.The output spectral signal is collected by a detector and transmitted to a lock-in amplifier for signal demodulation.The demodulated 2fsignal is transmitted to the computer by using a DAQ (National Instruments,USB-6210) for gas concentration inversion.An experiment was performed using the proposed system with a sample gas mixture with gases of various concentrations prepared using a gas distribution system with a volume fraction of 2 ppm for CH4standard gas,1020 ppm for CO2standard gas,and highpurity N2gas.
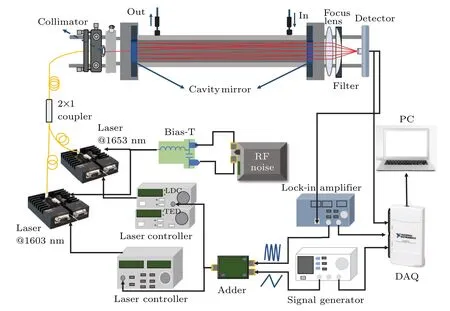
Fig.1.Structure of the as-designed RF-WM-OA-ICOS simultaneous two-component gas detection system.
4.Experimental results and discussion
4.1.Experimental of two-channel signal coupling
First,the superimposed signal composed of two direct absorption signals from the cavity were analyzed based on the integrated cavity structure and optical path design.The direct absorption signals of CH4and CO2gases were measured by simultaneously injecting 1.0-ppm CH4and 510-ppm CO2gas into the cavity using the gas distribution system while maintaining the cavity pressure and temperature at 75 Torr(1 Torr=1.33322×10²Pa)and 23°C,respectively.The lasers were scanned using a triangular wave with a frequency of 50 Hz and an amplitude of 1.5 V; the results are shown in Fig.2.The center currents of the two lasers were respectively varied upward(CO2)and downward(CH4)to measure the offcenter wavelengths of the two gas-absorption signals and ensure that the two signals would not interfere with each other upon superposition(as shown in Figs.2(b)and 2(c)).Then,the two laser signals were combined using the coupler and applied incident to the OA-ICOS cavity;the output signal is shown in Fig.2(d).The two absorption peak positions in the output signal appeared in the first and second halves of the falling edge of the same triangular wave,indicating that the absorption signals of the two gases did not interfere with each other.With the modulation parameters used in the direct absorption signal experiment held constant,a sine wave signal with a frequency of 1.5 kHz was generated using a phase locked amplifier and superimposed on a low-frequency triangular wave signal (as shown in Fig.2(e))to conduct wavelength modulation experiments.The 2fsignals of CH4and CO2after wavelength modulation were distributed at the left and right ends,as shown in Figs.2(f) and 2(g), respectively.The 2fsignals of the combined beam are shown in Fig.2(h).Because the two lasers were modulated at the same modulation parameters, the output signal received by the detector was transmitted to the same lock-in amplifier for demodulation, and the harmonic signals of the two gases were obtained.The output signal was demodulated from the superposition of the two groups of absorption signals(as shown in Fig.2(d)); thus,the two lasers were equivalent to each other’s background signals.Therefore,the intensities of the obtained absorption spectra signal and the 2fsignal were halved.However, this change in signal intensity did not affect the linear relationship between the intensity of the 2fsignal and the concentrations of the two gases.

Fig.2.(a)Direct absorption scanning signal,(b)CO2 single direct absorption signal, (c) CH4 single direct absorption signal, (d) CO2 and CH4 simultaneously absorb signals, (e) 2f scanning signal, (f) separately detected 2 f signal of CO2, (g) separately detected 2f signal of CH4,(h)simultaneously detected 2f signals of CO2 and CH4.
4.2.Modulation signal parameters optimization
The spectral absorption signals of gases under the influence of different power RF noises were analyzed.Many experimental studies[24]have reported that the maximum second harmonic signal can be obtained when the modulation depth is 2.2.The HWHM of absorption spectrum signals was calculated in the present study, and the best modulation amplitude was 0.058212 cm-1.Based on the relationship between the laser and the current, the optimal modulation current and the optimal modulation voltage were calculated as 6.0764 mA and 243.06 mV.
This study analyzed the 2fsignals corresponding to the simultaneous absorption of CO2and CH4at 927 ppm and 4.55 ppm,respectively,under the influence of RF noise signals with different power values.The two laser controllers were modulated simultaneously using a triangular wave with a frequency of 1 Hz and amplitude of 2 V superimposed on a sine wave with a frequency of 1.8 kHz and an amplitude of 0.243 V;the RF noise was injected into the laser through the Bias-T.The RF noise source was variable from-10 dBm to-40 dBm,and the experimental design noise powers were-10 dBm,-15 dBm,-20 dBm,-25 dBm,-30 dBm,-35 dBm, and-40 dBm.The experimental results are shown in Fig.3.During the measurements,the pressure and temperature in the cavity were 75 Torr and 23°C,respectively.
As illustrated in Fig.3(a), the original 2fsignals contained a considerable amount of noise without RF noise perturbation,and regular noise distribution indicated that the noises originated from the cavity mode noise.This can be attributed to the minimal integrated cavity design.When RF noise was introduced, the cavity mode was notably suppressed.The same phenomenon occurred in the 2fspectra of both CH4and CO2.With the increase in the noise power, all the cavity mode noises on the 2fspectra were notably suppressed, and the baseline was smooth.However,with the increase in noise power, the 2fpeaks exhibited severe distortion, the spectral peak value decreased gradually,and the spectral line widened gradually.The deformation of the 2fpeaks was not prominent when the RF power was lower than-20 dBm.When the noise power was higher than-20 dBm,the peak value decreased, and the trough value gradually increased and shifted away from the peak center.
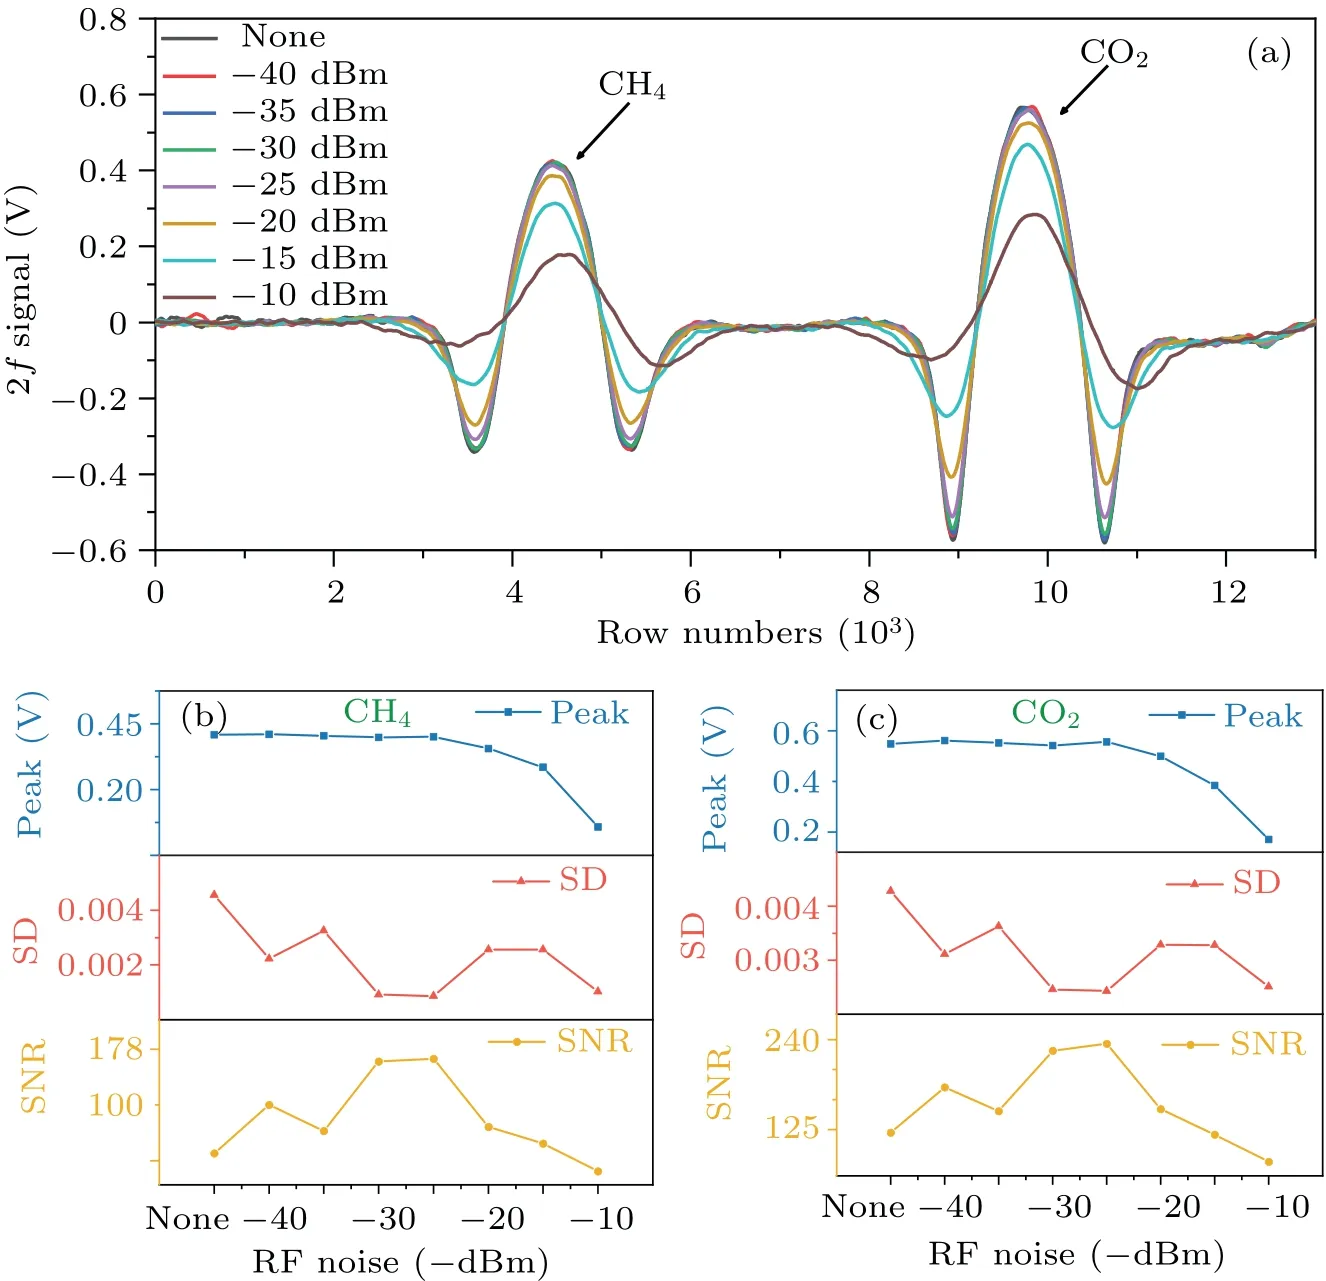
Fig.3.(a)Simultaneous detection of 2 f signals of CH4 and CO2 with different noise power disturbances,(b)parameters of the CH4 2f signal,(c)parameters of the CO2 2 f signal.
The peak amplitude,SNR,and SD corresponding to CH4and CO2signals under the influence of different noise power were calculated according to 2fsignals,as shown in Figs.3(b)and 3(c).The peak amplitude decreased gradually with the increase in noise power.However, the SNR first increased and then decreased with noise power.When the noise power was-25 dBm,the SNR and SD reached the maximum and minimum values,respectively.The SNRs of the two groups of gas signals were approximately 174 and 231, respectively, which were 1.8 times the values obtained when noise disturbance was absent, and the corresponding SD values were small.Therefore,-25 dBm was determined as the optimal RF level for enhancing the system in the following experiment.
4.3.System concentration calibration experiment
The response relationship and measurement accuracy of the RF-WM-OA-ICOS system to the concentrations of two gases were evaluated through a series of measurements of mixed gases of different concentrations.The gases included 2.0 ppm of CH4standard gas, 1020 ppm of CO2standard gas, and high-purity nitrogen gas.The 2fsignals of the two gases were evaluated simultaneously through continuous inlet and dynamic measurements.Data of the original signals were recorded every 20 times on average.The relationship between the concentrations of CH4and CO2and the 2fsignal amplitude was investigated, and the results are shown in Fig.4(a).The left absorption spectrum peak corresponded to CH4, and the right spectrum peak corresponded to CO2.The peaks of the collected CH4and CO22fsignals indicated a strong linear correlation of CH4within a concentration of approximately 2.0 ppm.The square of the correlation coefficient is 0.99979.The CH4concentration (CCH4) and the peak amplitude of the 2fsignal(A2f1)exhibit a linear relationship as follows:
The square of the polynomial correlation coefficient corresponding to a CO2concentration of approximately 1020 ppm is 0.99984, and CO2concentration (CCO2) and the peak amplitude of the 2fsignal(A2f2)exhibit a nonlinear relationship as follows:
The relationship betweenCCO2andA2f2is nonlinear because the relationship between the absorption coefficient of the gas and the single-pass absorption loss did not satisfy the weak absorption conditions of the off-axis integration cavity.In the measurement environment with a pressure and temperature of 75 Torr and 23°C,respectively,the HITRAN database was used to simulate the absorption coefficient of CO2at 6043.91 cm-1.The absorption coefficient for CO2with a volume fraction of 1020 ppm was 3.6×10⁻⁵cm-1.The reflectivity of the lens used was approximately 99.999%, and the cavity mirror spacing(d)is approximately 26 cm.Therefore,the one-way absorption loss isαCO2×26=9.36×10⁻⁴,while the single reflection loss of the mirrors is 1-R=10-5,which is not satisfied whenαCO2Lc≪1-R.Thus,a curved relationship was observed within the concentration range.

Fig.4.(a)Simultaneous detection of 2 f signals for multiple groups of CH4 and CO2, (b)2 f signal for 0-2.0 ppm of CH4, (c)2 f signal for 0-1020 ppm of CO2.
4.4.System performance analysis
Through the gas distribution system, 2.0-ppm CH4and 340-ppm CO2were injected into the cavity through the gas distribution system to analyze the stability and measurement accuracy of the system; continuous measurements were recorded for approximately 40 min.The RF-WM-OA-ICOS method with a noise disturbance of-25 dBm was adopted for data acquisition.The amplitude value was substituted into the above fitting formula for concentration inversion.The signals for single data recording were acquired with an integration time of 1 s.The results for CH4and CO2are shown in Figs.5(a) and 5(c), respectively.Data analysis and Allan variance analysis[25]were performed using the results.The average measured concentrations of CH4and CO2were 1.97 ppm and 340.58 ppm,respectively,indicating accuracies of 1.5% and 0.17%, respectively, with standard deviations of 0.1424 ppm and 27.733 ppm, indicating that the differences were within acceptable error limits.
As illustrated in Figs.5(c) and 5(d), the minimum detectable concentrations of CH4and CO2were 0.14 ppm and 27.2 ppm within an integration time of 1 s.When the systematic integration time was 1 min, the minimum detectable concentrations decreased to 19 ppb and 3.7 ppm,respectively.The optimal integral times of the system for CH4and CO2detection are 220 s and 458 s, respectively, with corresponding minimum detectable concentration limits of 10 ppb and 1.345 ppm, respectively.For the entire system, 220 s can be regarded as the optimal integration time.Within this integration time,the minimum detectable concentration limits of CH4and CO2are 10 ppb and 1.50 ppm.Using the method proposed by Moyeret al.[26]based on the sampling integration time and the corresponding minimum detectable absorption factor,the corresponding noise equivalent absorption sensitivity (NEAS) was calculated as 2.67×10⁻¹³cm-1·Hz-1/2and 5.18×10⁻¹¹cm-1·Hz-1/2.
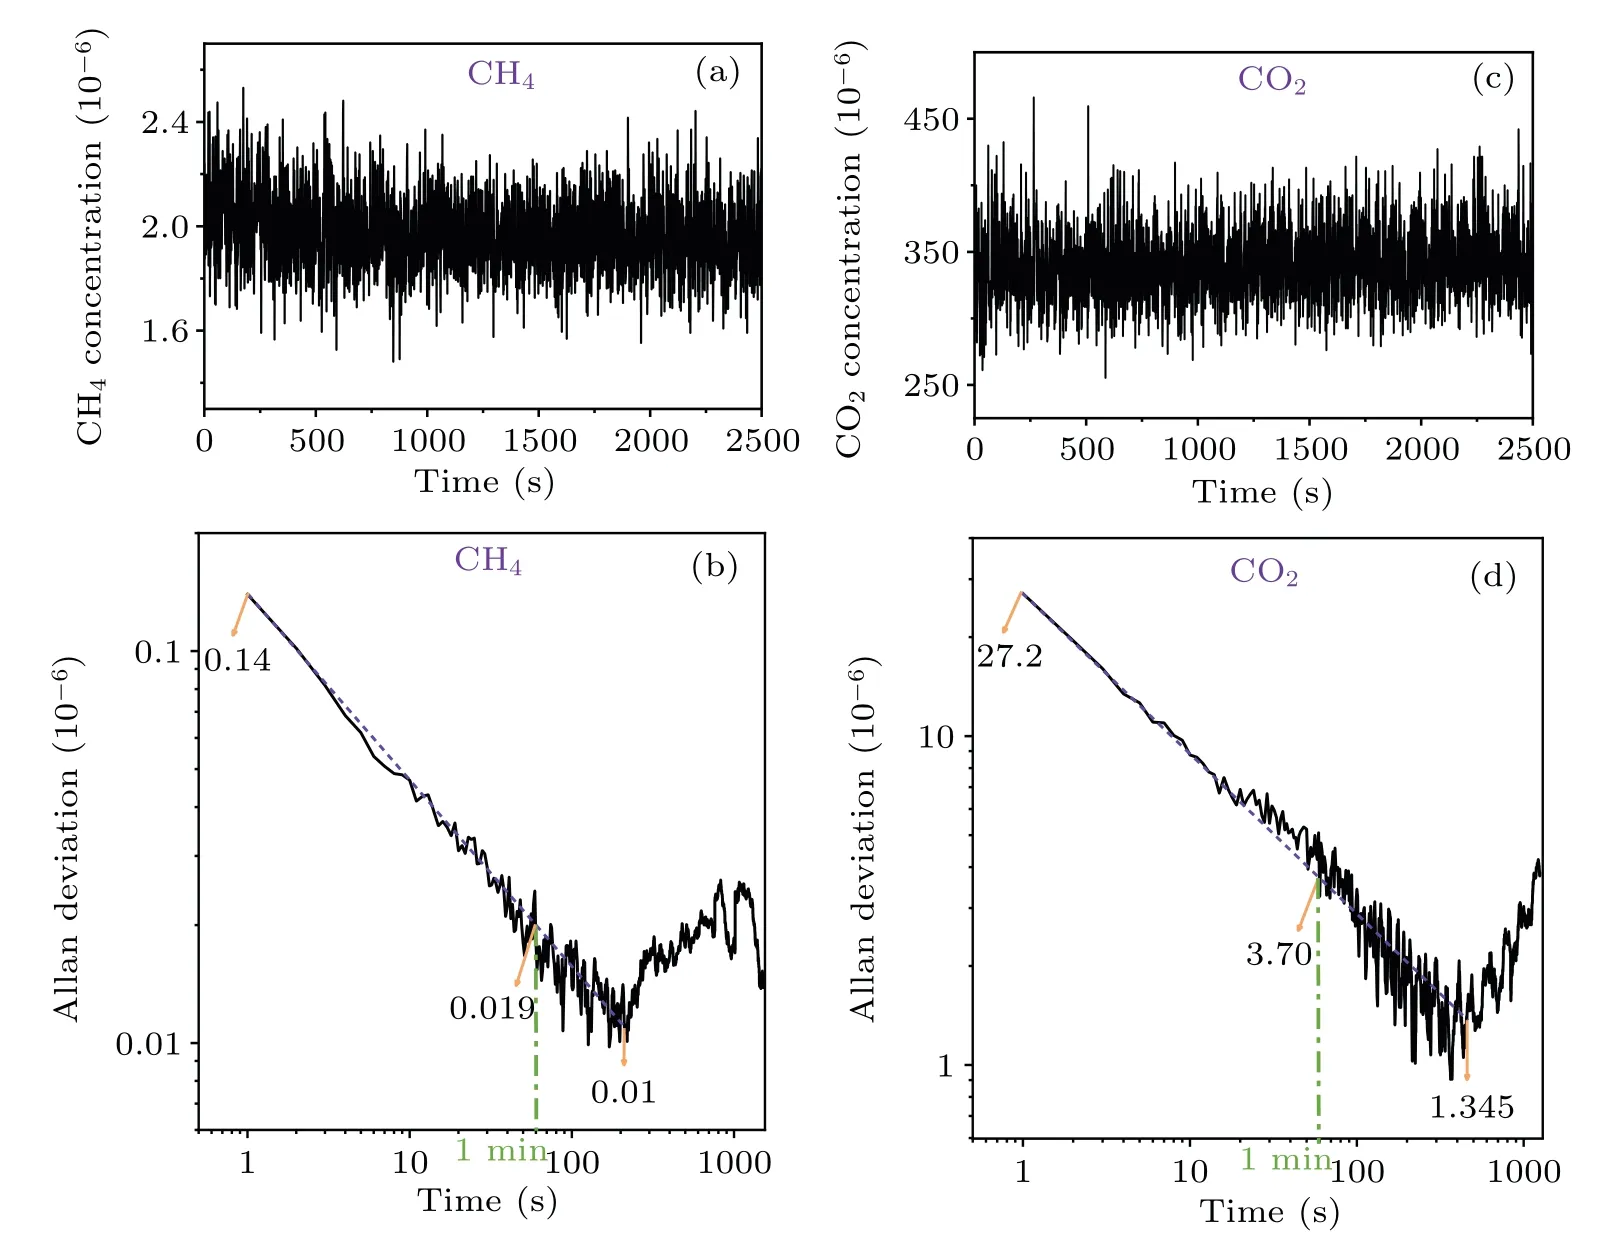
Fig.5.(a) Time-series measurements for CH4 at a constant concentration of 2 ppm over approximately 40 min, (b) Allan variance of CH4,(c)time-series measurements for CO2 at a constant concentration of 340 ppm over approximately 40 min,(d)Allan variance of CO2.
5.Conclusions
This study designed a novel high-precision system for the simultaneous detection of CH4and CO2through RF-WM-OAICOS with a beam combiner.The stability of the system was investigated after the optimization of the modulation parameters of the system and the calibration of the relationship between the 2fsignals and concentration.The results indicated that the system has high stability and can be used to accurately and simultaneously measure the concentrations of CH4and CO2.The optimal integration time of the system is 220 s.The minimum detection limit of CH4is 10 ppb, and that of CO2is 1.5 ppm.The corresponding NEAS values were calculated as 2.67×10⁻¹³cm-1·Hz-1/2and 5.18×10⁻¹¹cm-1·Hz-1/2,respectively.Therefore,the proposed dual-component gas simultaneous detection method can achieve high measurement accuracy,has a simple structure,and is easy to implement.It can be used for high-precision simultaneous detection of other gases and can serve as a basis for the development of portable multicomponent gas analyzers.
Acknowledgements
Project supported by the National Natural Science Foundation of China (Grant Nos.62005108 and 62205134),the National Key Research and Development Program of China (Grant No.2022YFC2807701), and the Natural Science Foundation of the Higher Education Institutions of Jiangsu Province, China (Grant Nos.20KJB140009 and 21KJB140008).
猜你喜欢
故事作文·高年级(2023年10期)2023-10-23
时代邮刊(2019年16期)2019-07-30
艺术启蒙(2018年7期)2018-08-23
学苑创造·A版(2018年12期)2018-03-04
下一代英才(酷炫少年)(2017年9期)2017-11-27
中国少年儿童(2016年28期)2016-05-04
读写算(下)(2015年6期)2015-08-22
学生天地·小学中高年级(2015年2期)2015-06-30
小主人报(2015年1期)2015-03-11
科学中国人(2015年25期)2015-02-28

- Chinese Physics B的其它文章
- Single-qubit quantum classifier based on gradient-free optimization algorithm
- Mode dynamics of Bose-Einstein condensates in a single-well potential
- A quantum algorithm for Toeplitz matrix-vector multiplication
- Non-Gaussian approach: Withstanding loss and noise of multi-scattering underwater channel for continuous-variable quantum teleportation
- Trajectory equation of a lump before and after collision with other waves for generalized Hirota-Satsuma-Ito equation
- Detection of healthy and pathological heartbeat dynamics in ECG signals using multivariate recurrence networks with multiple scale factors