
Prediction of superionic state in LiH2 at conditions enroute to nuclear fusion
2023-11-02 08:11FudeLi李福德HaoWang王豪JinlongLi李津龙andHuayunGeng耿华运
Chinese Physics B 2023年10期
Fude Li(李福德), Hao Wang(王豪), Jinlong Li(李津龙), and Huayun Geng(耿华运),2,†
1National Key Laboratory of Shock Wave and Detonation Physics,Institute of Fluid Physics,CAEP,Mianyang 621900,China
2HEDPS,Center for Applied Physics and Technology,and College of Engineering,Peking University,Beijing 100871,China
Keywords: lithium polyhydrides,high pressure and high temperature,superionic state,phase transition
1.Introduction
In inertial confinement fusion (ICF), deuterium-tritium ice or lithium deuteride solid is the most commonly used fuel materials.[1,2]Both contain isotopes of hydrogen and undergo shock or quasi-isentropic loading to achieve the ignition condition.[3]However, during the dynamic compression process,the pressure and temperature increase simultaneously and can intersect the melting curve of the solid fuel.[4]This can have an impact on the ignition, as the quasi-isentropic compression is path-dependent and the structural transition and property change in lithium hydrides along this path can affect subsequent thermodynamics.Furthermore, it is important to note that during the nuclear process, lithium can mutate into polyhydrides such as LiHn.[5]Specifically, the existence of LiH2at low pressure implies the possibility of using lithium tritium-deuteride (LiTD) as the fuel directly, rather than the tritium-substituted lithium deuteride(Li(DT)),to improve the fuel efficiency.Understanding the structure and behavior of lithium polyhydrides under high pressure and high temperature conditions is crucial for achieving controllable ICF.[6]
The structure of LiH2was first reported by Zurek[7]using the density function theory(DFT),[8,9]and the stable pressure was predicted to be 130 GPa to 300 GPa.Recent more careful calculations suggested that LiH2can be stabilized as a metastable phase down to pressures as low as 10 GPa.[10]In experiment, Howieet al.[11]attempted to synthesize polyhydrides by heating LiH mixed with hydrogen up to 600 K and pressurizing to 5 GPa.However, no signal of polyhydrides was observed.Lithium polyhydries were finally synthesized at a condition of 5 GPa and 1800 K in 2015,[12-14]in which LiH2was considered as one of the products.The optical spectra measurements of these compounds indicated an insulating nature, which sharply contradicts the metallic state predicted by theoretical methods.[7]This apparent discrepancy was later resolved by using more accurate exchange-correlation functional,which unequivocally demonstrates that it is the lack of appropriate van der Waals interaction[5]that leads to wrong metallic state in these polyhydrides.It also showed that the van der Waals interaction modifies the relative stability order greatly, and two new super-hydrides, LiH9and LiH10, were predicted for the first time.[5]
On the other hand, it has been well-established that hydrogen will become metallic when at high pressure beyond 500 GPa.[15-17]Doping with metallic elements to form polyhyrides sometimes will lower the metallization pressure greatly, by a mechanism of chemical pre-compression.[18]Lithium polyhydrides, which were the first system that was employed to check the concept of chemical pre-compression,are not as promising as other polyhydrides in terms of metallization, mainly due to the strong van der Waals interaction persisting in this system, which opens the energy gap and prevents the metallization in some stoichiometric compositions.[5]
These results exhibit that lithium polyhydrides represent a different type of H-rich compounds other than those of easy to achieve metallization like in lanthanum hydrides.[19]Although chemical pre-compression promotes the dissociation of H2dimers,it is not easy to transition lithium polyhydrides into a metallic state.In this sense, to explore their structural characteristics, it may be helpful in designing low-pressure metallic polyhydrides and searching for superconductors under ambient conditions.[15]Within lithium polyhydrides,LiH2deserves special attention, not only because its structure is simpler,but also because half of the hydrogen atoms have been dissociated,making it an ideal H2+H mixture.Its behavior at high temperature could be instructive for understanding other polyhydrides that might be involved in hydrogen storage[20]or ICF.
In this work, we employab initiomolecular dynamics(AIMD)simulations with density functional theory to investigate the structural change,thermodynamic properties and elasticity of LiH2at high pressure and high temperature.A premelting superionic state is predicted spanning over the whole studied pressure range (from 25 GPa to 300 GPa), as well as the associated elastic softening, all evidence of superionic as shown in Fig.S1.The paper is organized as follows.The computational methods and details are given in Section 2.In Section 3,the results about the melting point,fractional change of H2dimer, diffusion coefficient, and elastic constants of LiH2are discussed,and Section 4 summarizes the main findings and the conclusion of the paper.
2.Computational details
The structure of LiH2was taken as that reported by Chenet al.,[5]which has a symmetry of space groupP4/mbm, as shown in the inset of Fig.1 and lattice constants at high pressures are listed in Table S1.The NPT (N-number of particles,P-pressure, andT-temperature) AIMD simulations with Langevin isobaric-isothermal ensemble[21-23]were used to equilibrate the structure and lattice constants at different temperatures.The friction coefficient for both Li and H atoms was set toγ=12 ps-1.A 2×2×2 supercell containing 96 atoms with periodic boundary conditions was employed.In DFT calculations, the cutoff energy of the planewave basis was set to 700 eV.The van der Waals corrected PBE exchange-correlation functional of generalized gradient approximation[24,25]as implemented in the Viennaab initiosimulation package (VASP)[26]was employed.Thek-points were sampled in the first Brillouin zone with a size of 1×1×2 for the Monkhorst-Pack[27]mesh.The AIMD simulations for the structure equilibrating at finite temperature were carried out at the given pressure.Each simulation ran for 10000 steps,with a time step of 0.25 fs.
After obtaining the average lattice constants from the NPT simulation, we utilized a canonical ensemble (NVT)AIMD simulation with a Nose-Hoover thermostat[28-30]to calculate the mean squared displacement(MSD)of each type of atom.Thek-points mesh was increased to 2×2×3 to improve the numerical precision.Each NVT simulation also ran 10000 steps,with a time step of 0.25 fs.
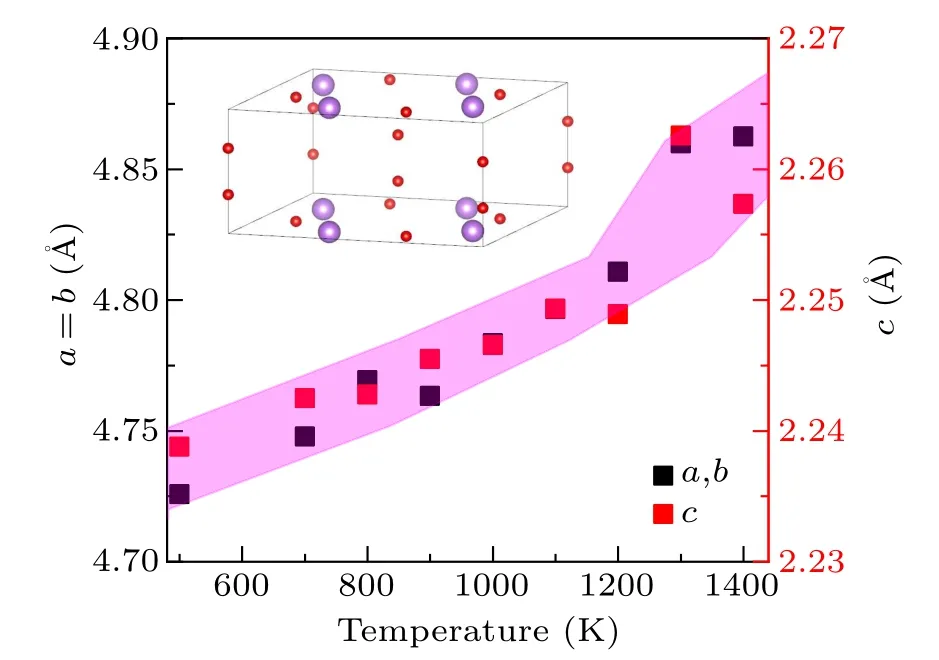
Fig.1.Variation of lattice constants of LiH2 with temperature at 50 GPa,the color-shaded region is a guide for the eye.Inset:the conventional unit cell of LiH2 that contains 4 formula units where red balls represent hydrogen atoms and purple balls represent lithium atoms.Note: the slight fluctuation in NPT simulated lattice constants is due to the small box size and short AIMD simulation we used.However,the over accuracy is better than 1%,and is enough for our purpose in this work.
In elastic property calculation, we employed long NVT ensemble simulation up to 20000 steps (corresponding to a time duration of 5 ps, with a timestep of 0.25 fs).For each simulation, the first 2000 steps were used to equilibrium the system, and the last 18000 steps were then sampled to compute the statistically averaged stress-strain relationship, from which the elastic constantsCijwere derived.In our calculation, the magnitude of strain distortion was set as 0.04.The whole calculation was carried out by using the MyElas[31]code that is designed to compute the finite temperature elasticity.For a tetragonal system as LiH2,six nonequivalent elastic constantsC11,C12,C13,C33,C44,andC66were obtained.
The melting points of LiH2were determined by using theZmethod,[32]which has been shown can provide reliable results for anharmonic systems.[33,34]Considering the superionic nature of LiH2prior to melting, it was reasonable to assume that the system is anharmonic.A large supercell containing 224 H atoms and 112 Li atoms was employed, with each NVE AIMD simulation running up to 3000 steps (with a timestep of 0.5 fs), which is long enough for the system to equilibrate and achieve ergodicity,as shown in Fig.S2 of the supplementary material.
3.Results and discussion
3.1.Superionic transition
From our AIMD simulations, we find that across the whole pressure range we investigated, the LiH2always undergoes a superionic transition prior to melting.Only the situation at 50 GPa is illustrated in detail here for brevity.As shown in Fig.1,all the lattice vectors increase almost linearly with the increase in temperature from 500 K to 1200 K, and then experience a rapid dilation when approaching the melting temperature.In the following simulations, the initial lattice parameters are set to the finite temperature value optimized by NPT simulations.As depicted in Fig.2, below 800 K, both lithium and hydrogen atoms exhibit vibrational motion around their respective equilibrium lattice sites.As the temperature increases further, hydrogen atoms begin to hop between their nearest neighboring sites, while the lithium atoms remain localized at their equilibrium lattice positions.Upon surpassing a temperature of 1100 K, the hydrogen sublattice undergoes complete melting,as evidenced by the MSD displayed in Fig.2(a).In contrast,the Li sublattice still keeps the solid state under this condition(Fig.2(d)).This is a hall-mark of superionic transition.It should be noted that this transition in LiH2is a smooth and continuous process that spans over a finite range of 900 K-1200 K.To simplify the discussion,we designate the superionic transition temperature at 50 GPa and 900 K when the H atoms start hopping.This allows clearer communication without any potential ambiguity.The same rule applies to other pressures.Inspecting the AIMD trajectory also indicates that in the early stage of this superionic transition,the H sublattice possesses a 1D chain melting behavior.[35]On the other hand,it is necessary to note that we did not find any evidence of superionic transition in LiH with the same method.
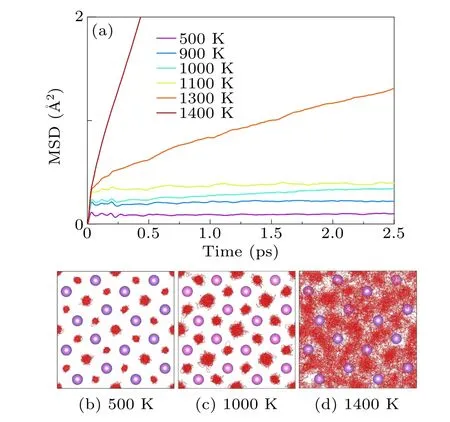
Fig.2.(a) Mean squared displacement of H atoms at different temperatures.(b)-(d) Trajectories of H atoms (red lines) at 500 K, 1000 K and 1400 K,respectively,in which lithium is drawn as purple balls.The atomic volume at the corresponding temperature is listed in Table S3.
3.2.Melting point prediction
If the temperature is increased further, the lithium sublattice also becomes unstable,and the entire system will melt and enter the liquid state.Nevertheless,in molecular dynamics simulations,superheated solid states are often encountered,mainly due to the first-order transition nature of melting, as well as the limited size of the supercell and the total simulation duration that can be accessed nowadays.In this work, theZmethod is employed to mitigate this problem.[32-34]The simulation covers a specific volume ranging from 2.162 °A3/atom to 4.334 °A3/atom,which corresponds to a pressure of approximately from 50 GPa to 300 GPa.The variations ofPandTalong the given isochoric path calculated by theZ-method are shown in Fig.3.At the specific volume of 4.334 °A3/atom,LiH2melts at 50 GPa and 1500 K.With the density increases,the melting temperature is monotonously increased to 2074 K at 300 GPa.The zigzag shape in theT-Pcurve along the isochoric path is evident,which demonstrates the spontaneous collapse of the lattice in the superheated regime and the subsequent relaxing to the liquid state,a feature of first-order phase transition.
The shaded area in Fig.3 illustrates the pressuretemperature region in which the superionic state of LiH2exists.This premelting delocalization of H-sublattice could have an impact on the properties of this material.The superionic transition occurs when the free energy of an atom at the lattice site becomes high enough to prefer an interstitial position, facilitated by the potential energy landscape of the liquid state.[36]The mobility of each type of atom can be described by the MSD and the associated self-diffusion coefficient,which is defined as
whereri(t)represents the coordinates of the particleiat timet,Nis the total number of this type of ions, and〈·〉indicates the ensemble average.

Fig.3.The melting points of LiH2 are obtained using the AIMD and Z-method.The magenta filled symbols indicate the collapse point of the superheated lithium sublattice, and the open violet symbols denote the melting point.
The calculated diffusion coefficient of both hydrogen and lithium at a pressure about 130 GPa is shown in Fig.4(a).It is apparent that the increase in diffusivity of Li is delayed to higher temperature compared to that of H,suggesting the superionic nature of the phase.Furthermore, the diffusion coefficient of H does not vary linearly with pressure and temperature.This suggests that the superionic transitions are not done all at once, and there is an intermediate state between a pure solid and a liquid.During the early stage of the superionic transition,a few H atoms leave their lattice positions and begin hopping on the H sublattice via interstitial sites.However, the majority of H atoms remain in their original lattice positions.When the temperature increases further,the H sublattice eventually melts, leading to a significant jump in the diffusion coefficient of H at 1427 K, as shown in Fig.S3 of the supplementary material.This occurs prior to the complete melting of LiH2,which is characterized by a drastic increase in the diffusivity of Li atoms at 2230 K,as illustrated in Fig.4(a).These changes are also accompanied by variations in theP-Tcurve,as demonstrated in Fig.4(b).
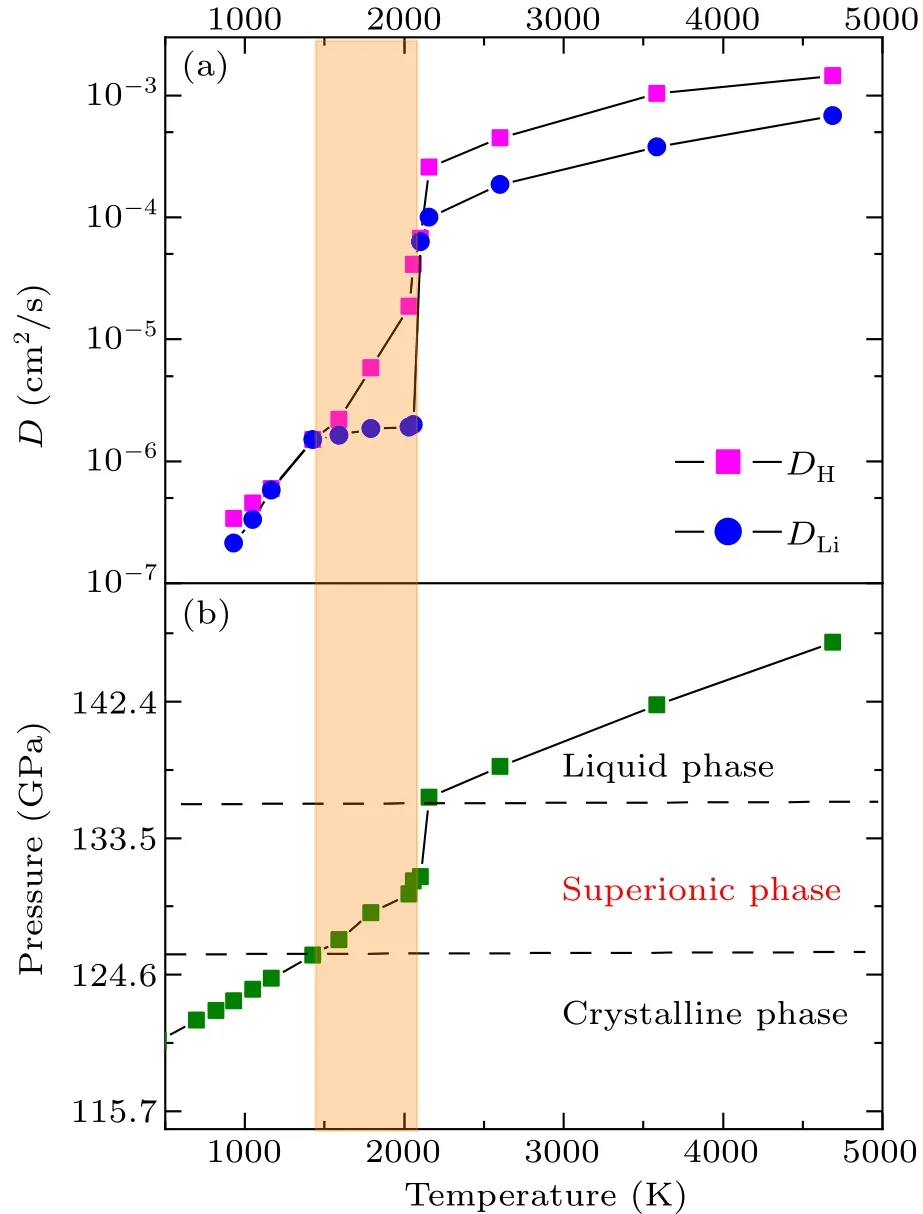
Fig.4.(a)Variation of the estimated diffusivity of H and Li atoms with increased temperature along the isochoric path with specific volume of 3.034 °A3/atom.The shaded area indicates the superionic region.(b)The corresponding P-T curve of the same isochoric path as panel(a),in which the crystalline,superionic,and liquid phase are marked,respectively.
To explore the self-diffusion mechanism, we attempt to fit the AIMD estimated diffusivity of both H and Li before liquefaction to the following expression:
In Eq.(2), the parameterEaindicates the activation energy of particle hopping in a solid,Drepresents the self-diffusion coefficient,D∞is a constant corresponding to the asymptotic diffusivity when temperatureT →∞,andkBis the Boltzmann constant.The diffusivity of H cannot be described by a single model.At the initial stage of superionicity, itsDcan be described by Eq.(2), in whichD∞=5.9×10⁻²cm2·s-1is the asymptotic diffusivity when temperatureT →∞, and the energy barrierEa= 1.41 eV.When approach melting,it is described byD=DT0(T/T0)α, in whichDT0=1.46×10⁻⁵cm2·s-1is the diffusivity whenT=T0,andα=31.32,the reference temperature is set toT0=2000 K.It is a mechanism of diffusion governed by particle collision,and is typical for normal fluid.In this stage, the diffusion process is significantly accelerated and primarily governed by temperature.The fitted curves are displayed in Fig.S3 of supplementary material.
For Li, it is well described by the thermal activation model of Eq.(2), withD∞= 1.29×1017cm2·s-1, and the energy barrierEa=9.3 eV.From this we find that at the early stage of superionic transition,both the diffusivity of H and Li are controlled by the hopping mechanism.But the energy barrier for Li is about 6.6 times greater than that of H atoms.
3.3.The change of H2 fraction
In H-rich compounds, there are usually quasi-molecular H2units,[36]which are expected to dissociate at high pressure and temperature, much like what happens in pure hydrogen.[37,38]To investigate this scenario, we calculate the change of H2fraction when across the superionic transition and melting.The analysis method is the same as that reported in Ref.[37].
The variations ofρH2with pressure along the given isochores are plotted in Fig.5.The effect of compression is minor.The slope of these isochoric curves, i.e., (∂ρH2/∂p)Vis almost a constant, as indicated in Fig.5.On the other hand,we find that the driven factor for H2dissociation is the temperature,as demonstrated in Fig.6.
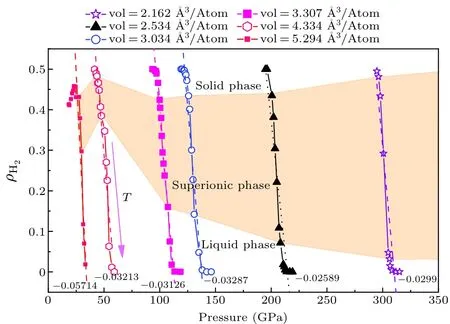
Fig.5.Variation of the fraction of H2 units in LiH2 with increased temperature along given isochoric paths, in which the corresponding region of solid,superionic state and liquid are marked out,respectively.The purple arrow shows the direction of the temperature increment.The dotted lines denote the slope of the curves∂ρH2/∂pV,as the number next to the line indicates.
It is necessary to point out that for most densities we studied,ρH2decreases almost monotonically with temperature, except the low pressure one with an atomic volume of 5.294 °A3/atom, for whichρH2firstly increases with temperature to a maximum, and then decreases.The H2fraction reaches the highest when the superionic state appears,indicating that mobility of H allows them to recombine into H2units.We also find that the rapid decrease ofρH2does not correlate to the melting process of LiH2.
Since both linear or compact H3clusters are predicted in the ground state of H-rich compounds[5,39]and at around the dissociation region of pure H,[37,40,41]we also estimate the fraction and lifetime of H3units.According to Fig.S4, the lifetime of H3cluster is very short,and increasing temperature will increase its fraction,as shown in Fig.S5.However,when beyond 1647 K,its lifetime starts to decrease with increasing temperature,indicating that these H3clusters are just accident encounter under these conditions, very similar to what happens in pure H.[37]

Fig.6.Variation of ρH2 with both temperature and pressure.Different color represents different atomic volume.

Table 1.Calculated bulk modulus (B), shear modulus (G), Young’s modulus(E),and Poisson’s ratio(ν)of LiH2 at 50 GPa.
3.4.Elastic properties
By solving the stress-strain relation that was sampled from AIMD simulations,[31]we obtained the independent elastic constantsC11,C12,C13,C33,C44, andC66of LiH2,which are shown in Fig.7(a).The mechanical stability was confirmed by using the Born stability criterion[42]
We found that exceptC13,almost all elastic constants are softened when entering the superionic state.Furthermore, using these single-crystallineCij, we also obtained the polycrystalline modulus and the corresponding sound velocities, as listed in Table 1 and shown in Fig.7(b), respectively.Our results provided direct numerical evidence of the strong premelting softening in LiH2due to the delocalization of H sublattice in superionic state.
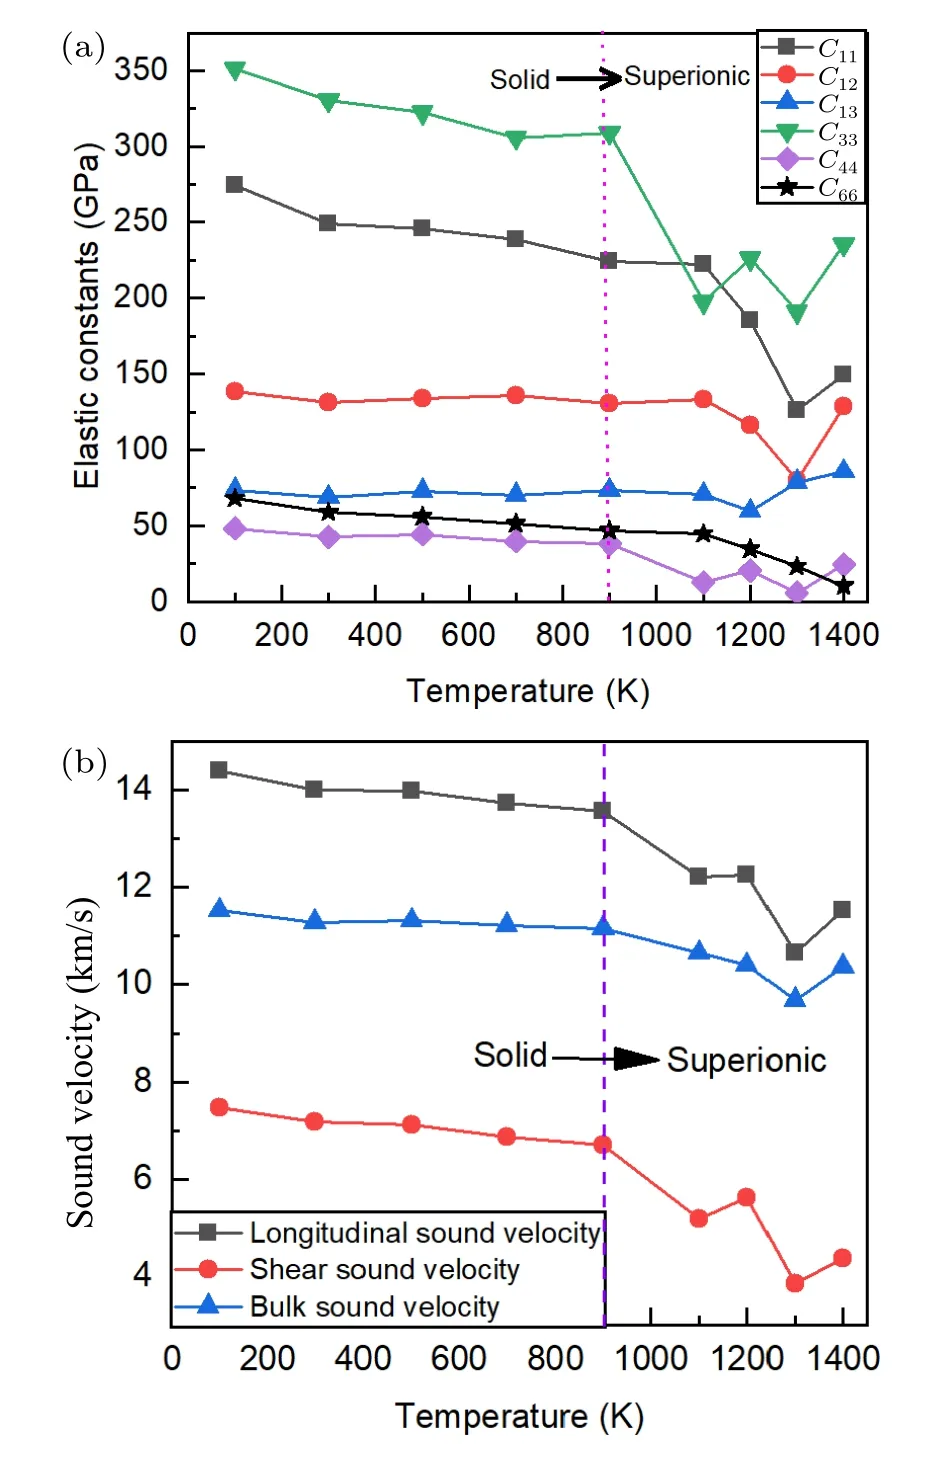
Fig.7.(a)The calculated monocrystalline elastic constants and(b)polycrystalline sound velocities of LiH2 as a function of temperature at 50 GPa.
4.Conclusion
The structure and properties of LiH2at high pressures and temperatures are investigated with AIMD at the level of vdWDF exchange-correlation functional approximation of DFT.The melting temperature of LiH2up to 300 GPa is determined.A peculiar superionic transition before melting is predicted,which has a 1D chain melting in the H sublattice at the early stage of the superionic transition.A change in the diffusion mechanism within the superionic state is also identified.The analysis of the variation of H2and H3units reveals that this hydride bears some similarities with the pure H in the vicinity of dissociation.Furthermore, a strong softening in elastic constants and sound velocity of LiH2caused by the premelting superionic transition is predicted.This phenomenon has broad implications beyond LiH2and may be relevant to other H-rich compounds.We also note that there is no superionic state in LiH.This anomaly in LiH2may have an impact on the quasi-isentropic compression.Consequently,it could have far-reaching implications for optimizing the compression path of ICF if materials like lithium tritium-deuteride (LiTD) an isotope of LiH2are utilized as the nuclear fusion fuels in the future.Our results also provide an insightful understanding of the high pressure and high temperature behavior of H-rich compounds that are promising for applications in hydrogen storage and near room temperature superconductor.
Acknowledgments
Project supported by the National Key Research and Development Program of China(Grant No.2021YFB3802300),the National Natural Science Foundation of China (Grant No.11672274), and the NSAF (Grant No.U1730248).Part of the computation was performed using the supercomputer at the Center for Computational Materials Science (CCMS) of the Institute for Materials Research(IMR)at Tohoku University of Japan.

- Chinese Physics B的其它文章
- Single-qubit quantum classifier based on gradient-free optimization algorithm
- Mode dynamics of Bose-Einstein condensates in a single-well potential
- A quantum algorithm for Toeplitz matrix-vector multiplication
- Non-Gaussian approach: Withstanding loss and noise of multi-scattering underwater channel for continuous-variable quantum teleportation
- Trajectory equation of a lump before and after collision with other waves for generalized Hirota-Satsuma-Ito equation
- Detection of healthy and pathological heartbeat dynamics in ECG signals using multivariate recurrence networks with multiple scale factors