
Combination of density-clustering and supervised classification for event identification in single-molecule force spectroscopy data
2023-11-02 08:13YongyiYuan袁泳怡JialunLiang梁嘉伦ChuangTan谭创XueyingYang杨雪滢DongniYang杨东尼andJieMa马杰
Chinese Physics B 2023年10期
Yongyi Yuan(袁泳怡), Jialun Liang(梁嘉伦),†, Chuang Tan(谭创),Xueying Yang(杨雪滢), Dongni Yang(杨东尼), and Jie Ma(马杰),‡
1School of Physics,Sun Yat-sen University,Guangzhou 510275,China
2State Key Laboratory of Optoelectronic Materials and Technologies,Sun Yat-sen University,Guangzhou 510006,China
Keywords: single-molecule force spectroscopy,data analysis,density-based clustering,supervised classification
1.Introduction
Single-molecule force spectroscopy (SMFS)[1]based on optical tweezers (OTs), atomic force microscopy(AFM) or magnetic tweezers (MTs), has become a powerful method for revealing enormous insight into the dynamics of biomolecules, such as DNA/RNA structural transitions,[2-4]protein folding/unfolding dynamics,[5-8]receptor-ligand binding/unbinding processes[9,10]and DNAprotein interactions.[11,12]Generally, SMFS requires a good number of data sets to produce adequate sampling distributions of events and states in order to precisely extract the kinetic and thermodynamics information.Progress has been made in the improvement of both the throughput of SMFS experiments and the lifetime of each molecule through the upgrade of instruments[13-17]and sample preparation method,[18-20]making it possible to obtain large data sets through parallel or repeated measurements.Nevertheless, it is still a heavy workload to manually identify and locate the events of interest from the enormous measurement data,which is crucial for further analysis.Therefore, an appropriate approach allowing event identification from SMFS experiments in a reliable,automated and reproducible way is clearly desirable.
SMFS experiments generally adopt two types of assays,including the pulling assay and the force-clamp assay.In a pulling assay, conformational transitions such as the unfolding of protein or nucleic acid structures generate abrupt drops in force at the rupture process in the force-extension curves(FECs), as shown in Figs.1(a) and 1(b).The distribution of rupture forces can yield the zero-force unfolding rate constant(k),the distance to the transition state(x‡)and the height of the energy barrier (ΔG‡).[21-23]However, the accurate deduction of those three parameters requires a large number of unfolding events and precise extraction of the rupture force from FECs.To address this need,many algorithms[24-28]have been developed.Although established algorithms are capable of locating the rupture force, some algorithms require many parameters,making them hard to use.Besides most of algorithms cannot classify the rupture forces to the corresponding conformational transitions when the FEC reveals several transitions due to the multiple secondary structures of the molecule.Finally,to our knowledge,it is difficult to accurately extract the rupture forces when the molecule hops quickly between the unfolded state and the folded state during pulling.
In the second type of assay, i.e., the force-clamp assay,a constant force is applied to the molecule and the extensiontime trajectories(ETTs)are recorded,where the events are indicated by the extension signal hopping between two states,as shown in Figs.1(c) and 1(d).The distributions of the lifetimes of each state under different forces yieldk,x‡and ΔG‡, and the free energy landscape can be reconstructed subsequently.[4,29]Therefore,it is critical to identify each state in ETTs.Hidden Markov model (HMM)[30-32]is widely adopted in SMFS and single-molecule fluorescence resonance energy transfer(smFRET)experiments for state detection.Recently, algorithms based on machine learning such as CPHAC[33]and DISC[34]have been developed to identify multiple states in single molecule trajectories with high accuracy and high computational performance.However, all these algorithms require the input data to be free of base-line drift.A reference-bead strategy is widely used in MTs experiments for drift correction,[7,35]but this strategy may not be suitable for other single molecule experiments and also probably cannot completely correct the drift of all tethered beads in highthroughput experiments.Although other progress has been made in drift correction in OT experiments,it has to be compensated with the increase of either equipment cost or experiment complexity.[36-39]
Here, we present a solution, named approach combining clustering and classification for event identification of SMFS(ACCESS),for locating and identifying both the rupture forces in FECs and the transition states in ETTs.In pulling experiments, ACCESS is capable of segmenting the FEC, locating the rupture force and classifying the rupture force to the corresponding transitions.In force-clamp experiments, ACCESS can accurately identify the folded and unfolded states for ETTs with severe nonmonotonic drift.In addition, ACCESS is straightforward to implement and easy to understand because it requires just three easy-to-interpret parameters.We demonstrate the performance of ACCESS for three diverse data sets,including simulated FECs,experimentally measured FECs from OTs, and ETTs from MTs, and show its potential in improving the fully automated SMFS analysis.
2.Materials and methods
ACCESS was written in MATLAB 2023a (the Math-Works,Natick,MA).ACCESS comprised of three major processes: clustering based on density-based spatial clustering of applications with noise(DBSCAN),[40-42]training and classification based on supervised learning.[43]The basis for the statistical analysis used by ACCESS and all performance metrics were presented in supplementary information (SI).To evaluate the performance of ACCESS, we used the following data sets: (i) 500 simulated force-extension curves (FECs) calculated from a free energy profile with folded (F), intermediate(I)and unfolded(U)states(Fig.S1).The simulated FECs revealed two conformational transitions, i.e.,F→I and I→U,and several hopping between F(I)and I(U).(ii)63 experimental FECs of DNA hairpin with 15 bp(base pairs)stem and 4 nt(nucleotides)loop measured by our home-built OTs in pulling experiments.Experimental FECs displayed WLC behavior of DNA handles at low force followed by hairpin unfolding at~13 pN.(iii) 7 experimental extension-time trajectories of DNA hairpin with 40 bp stem and 5 nt loop measured by our home-built MTs in force-clamp experiments.ETTs revealed two-state hopping behaviors with severe baseline drift.The FECs simulation and experimental details were presented in supplementary information.All analysis results were obtained using a desktop personal computer with 16 GB of RAM, Intel(R)Core(TM)i7-4790 CPU@3.60 Hz and a 305-GB hard drive.
3.Result and discussion
3.1.Extraction of rupture force in FECs using ACCESS
We first demonstrated the performance of ACCESS using simulated FECs.The workflow of ACCESS was shown in Fig.2(a),which basically consisted of three steps,i.e.,clustering,training,and classification.Given the input data,as shown in Fig.2(b),ACCESS first clustered all data points of the FEC using the DBSCAN algorithm with two user-definable parameters,ε(the maximum radius of a neighborhood from the observing point) and MinPts (the minimum number of data points contained in a neighborhood).The settings ofεand MinPts were discussed in detail in(SI).In DBSCAN processing, all data points were preliminarily clustered into several groups, indicated as different colors and labeled numbers in Fig.2(c).The data points labeled as-1 by DBSCAN were considered as outliers,indicated as the red crosses in Fig.2(c).After excluding the outliers, the mean values of extension of each group were further clustered using the agglomerative hierarchical clustering(AHC)algorithm which generated a dendrogram as shown in Fig.S2.The dendrogram was cut intoNSgroups, the third user-definable parameter, with the prior knowledge of the number of conformational states revealed by FECs.For example,NSwas specified to three according to Fig.2(b).As a result, groups in Fig.2(c) with similar mean extension were combined together and finally the FEC was reclustered into three classes with data points labeled with F,I,and U,as shown in Fig.2(d).It should be noted that the settings ofεand MinPts were not unique.Different settings ofεand MinPts were also able to produce correct cluster results for the following analysis,as shown in Fig.S3.In step two,ACCESS generated a training model by utilizing the labeled FEC(Fig.2(d))as training data through an optimized support vector machine (SVM) algorithm since data points in FEC were linearly separable.In step three,ACCESS applied the training model to this FEC to capture transient transitions which were always identified as outliers in the prior steps, as described later.Moreover, since the feature of FECs was similar from trace to trace,the training model generated from a typical FEC could be applied to other FECs for classification,which significantly reduced the computational time.Figure 2(e)displayed the classification result of another simulated FEC by using the training model generated from Fig.2(d).More results can be found in Fig.S4.The force was extracted as rupture forces[44]once the labels of data points changed from F to I or I to U.Therefore, ACCESS can classify the extracted rupture forces to the corresponding conformation changes.After analysis of 500 simulated FECs by ACCESS,Fig.2(f)showed the distributions of the rupture forces for two types of transitions,F→I(blue histogram)and I→U(orange histogram).To verify the validity of rupture forces extracted by ACCESS,we fitted the two distributions using Eq.(S3), giving the fitting results of(blue line)andnm (orange line), which were consistent with the input parameters used in the FEC simulation (see Fig.S1).Therefore, ACCESS showed a good performance in locating and classifying the rupture forces.
We further applied ACCESS to analyze experimental FECs of a DNA hairpin.Figure 3(a)shows a typical FEC obtained by our home-built optical tweezers.Similarly,the FEC was firstly clustered into two groups with the outliers labeled as-1 by ACCESS,as shown in Fig.3(b).The training model was generated from labeled data points without outliers and subsequently applied to all experimental FECs for data point classification.As the inset in Fig.3(b)showed,data points in transient transitions were incorrectly identified as outliers by DBSCAN.In contrast,those data points were correctly classified into the corresponding states after being reclassified by the training model,as shown in Fig.3(c).Moreover,the segmentation of the FEC was also convenient and useful for wormlike chain (WLC) fitting.[45]The number of nucleotides of DNA hairpin deduced from WLC fittings (blue line and yellow line in Fig.3(c)) was 33 nt, which was close to the true value, i.e., 34 nt.More classification results of experimental FECs by using the training model generated from Fig.3(b)could be found in Fig.S5.
3.2.Identification of transition states in ETTs using ACCESS
In this section,we illustrated how ACCESS could be applied to experimental ETTs with drift to identify the folded and unfolded transition states.Figure 4(a)showed an ETT of DNA hairpin measured at 15.5 pN by our home-built magnetic tweezers without using the reference bead for base-line correction.As a result, the ETT displayed significant nonmonotonic drift and could not be accurately analyzed by HMM(green line).The workflow of ACCESS for ETTs analysis was similar to Fig.4(a).Briefly, ACCESS clustered the data points into several groups based on DBSCAN, as Fig.4(b)showed.After eliminating the outliers, all groups were clustered into two classes,i.e.,F and U,using a separate algorithm called label-change (details see supplementary information).Because data points in ETT with drift were linearly inseparable, ACCESS generated a training model by utilizing the labeled ETT (Fig.4(c)) as training data through an optimized neural network(NN)algorithm[46]instead of SVM.The training model was applied to this ETT for reclassification.As mentioned above,the data points in transient transitions were always identified as outliers by DBSCAN at first,indicated as the red crosses in the inset in Fig.4(b) and could be classified into the correct states after reclassification by the training model.The final result is shown in Fig.4(d).As can be seen,the unfolded state and folded state were accurately identified by ACCESS, even for those in the transient transitions.It should be emphasized that, since the pattern of drift was random and different from trace to trace, the training model generated from one trace was unable to correctly classify other traces.Therefore,each drifted ETT needed to generate its own training model for classification.
To prove the validity of ACCESS on drifted ETTs with different kinetic hopping rates,we further applied ACCESS to the identification of conformational states of a DNA hairpin clamped at different forces.As Fig.5 showed,a DNA hairpin was clamped at 16.0 pN,15.8 pN,15.7 pN,15.6 pN,15.4 pN,15.3 pN from panel (a) to panel (f), respectively, exhibiting different lifetime of the folded and unfolded states.As expected,ACCESS was able to precisely identify the two states at different forces.These results allowed further kinetic analysis and reconstruction of the free energy landscape.
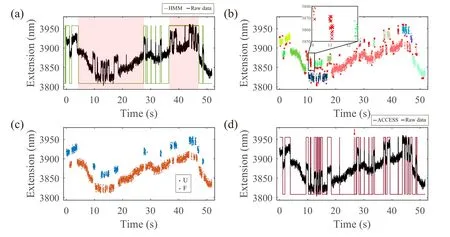
Fig.4.An overview of analyzing experimental ETTs using ACCESS.(a) An extension-time trajectory of DNA hopping at F =15.5 pN with baseline drift.The green line is the analysis result by HMM.The red background indicates the misidentification of states.(b)The preliminary cluster result of ETT(a)using DBSCAN.DBSCAN clustered data points of panel(b)into 15 groups and identified outliers as red crosses.Here,ε and MinPts were set as 0.08 and 12,respectively.More cluster results using different settings of ε and MinPts were found in Fig.S7.Inset:detail of the ETT showing that data points implying the short lifetime of the state were identified as outliers.(c)The data points of panel(b)were further divided into two classes by the label-change algorithm.(d)The classification result of panel(a)using the training model learning from panel(c).The red arrow represents false negative indicating misidentified events.
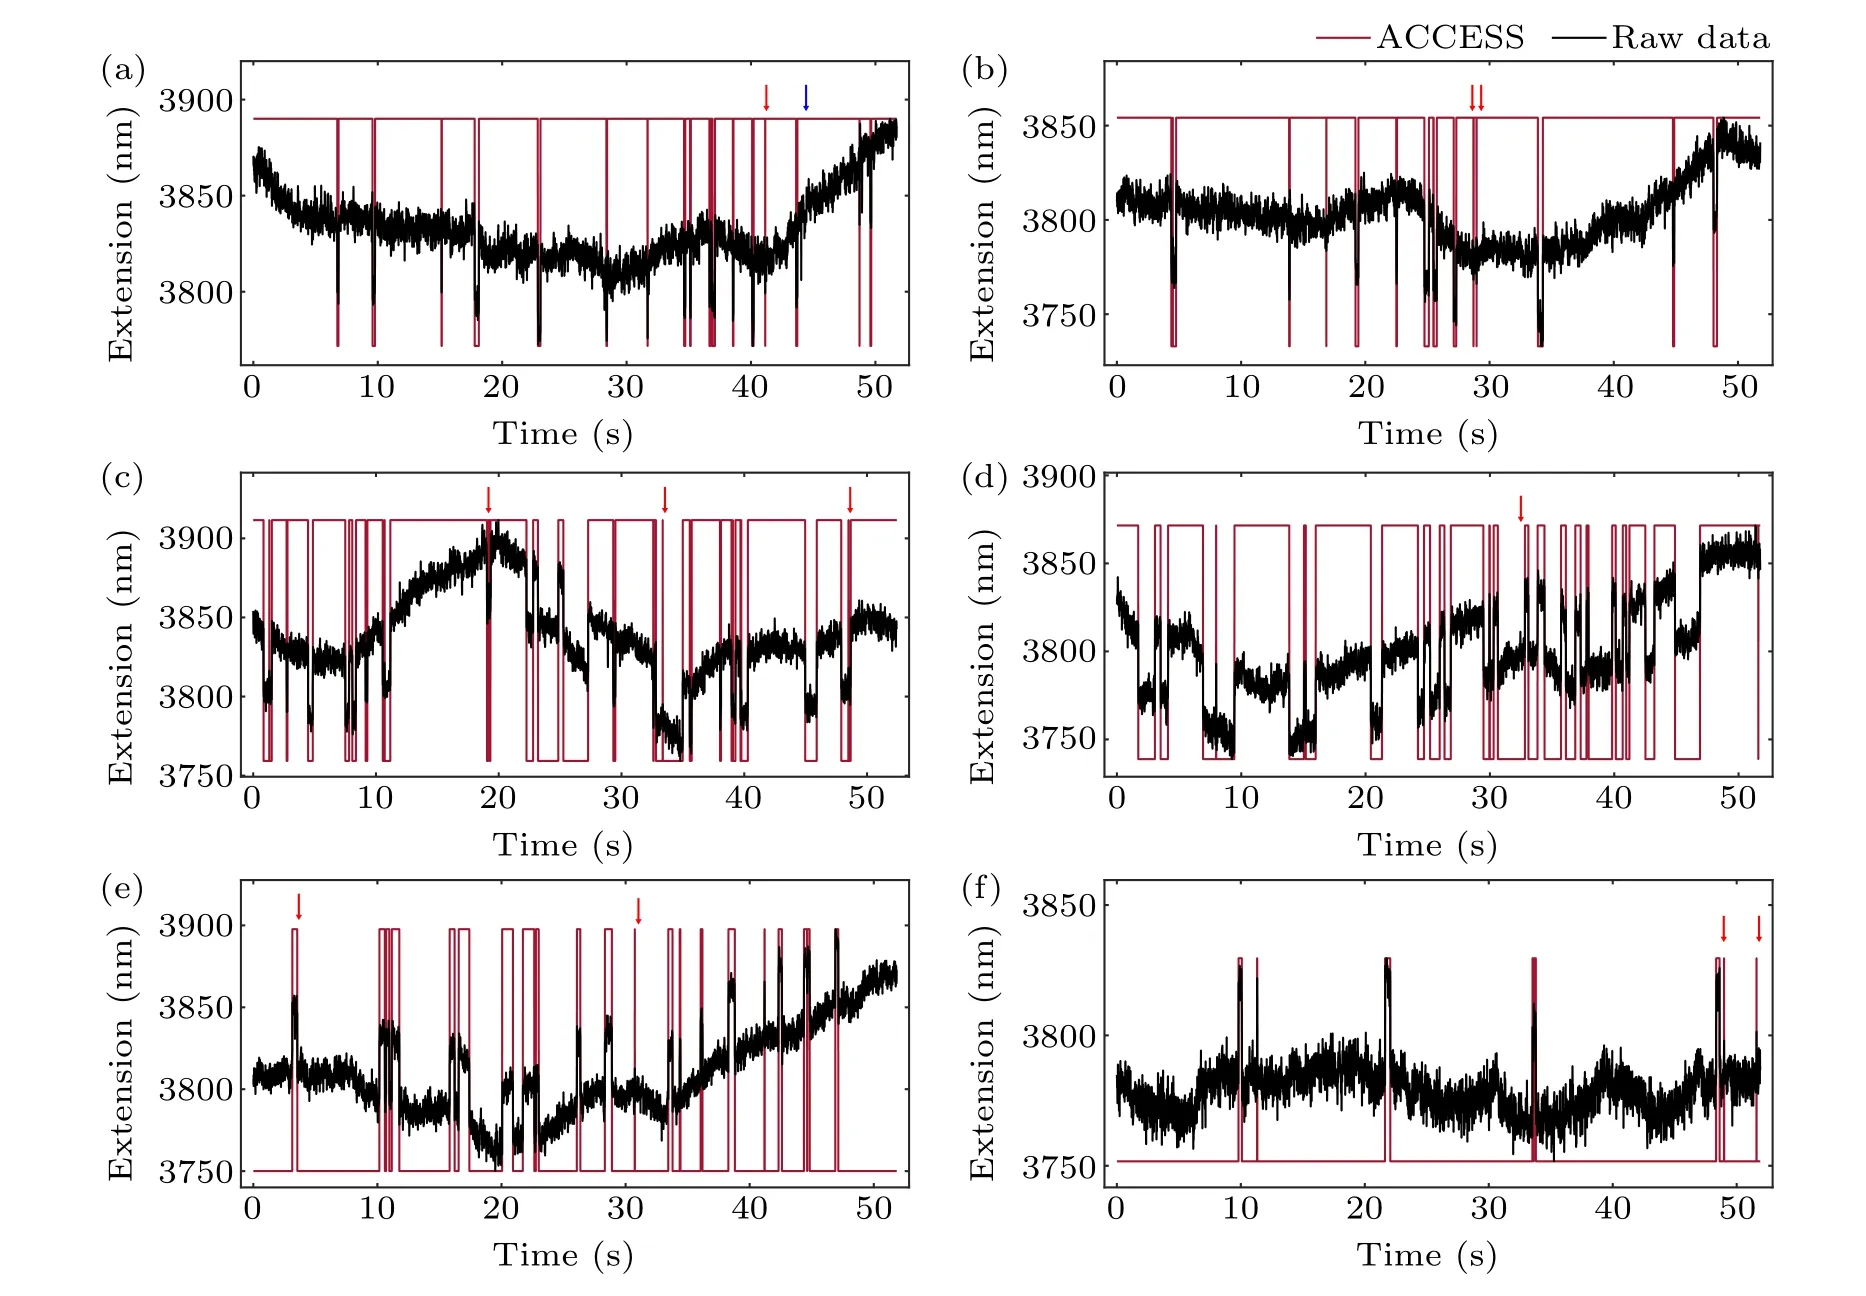
Fig.5.The analysis result of experimental ETTs using ACCESS.The DNA hairpin with 12 kbp DNA handles is clamped at 16.0 pN,15.8 pN,15.7 pN,15.6 pN,15.4 pN and 15.3 pN from panel(a)to panel(f),respectively.The red arrow represents false negative indicating misidentified events,and the blue arrow represents false positive indicating missed events.
3.3.Evaluation of ACCESS’s performance
Across all the applications,ACCESS provides high accuracy,high precision,and high recall(Table 1,see supplementary information for the definition of the performance metrics),inferred from the confusion matrix shown in Fig.S8.For extracting rupture forces from simulated FECs and experimental FECs,ACCESS performs exceptionally well with accuracy more than 95%.Not only does ACCESS provide high accuracy, it is also fast.For example, the total analysis time of 64 experimental FECs with~4000 data points per trajectory is~6 s.For force-clamp experiments, ACCESS can return a high accuracy of 94.49% for experimental ETTs with large drift while for this case HMM method failed in correctly recognizing most of the folded and unfolded states.The small error left may be caused by the noise points,as shown in Fig.4.The analysis time of an ETT with~5000 data points is~17 s by ACCESS.It should be noted that all the data sets input into ACCESS are not smoothed.We believe that the performance metrics will be further improved after data smoothing.
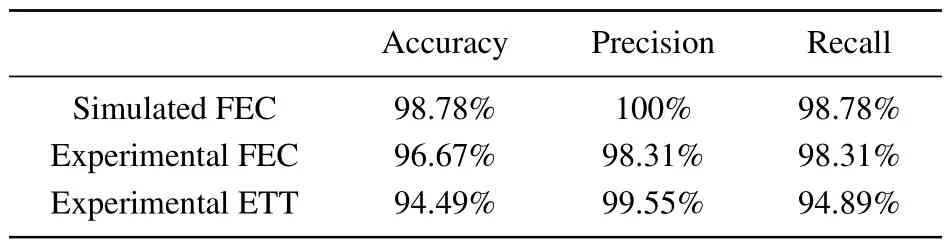
Table 1.Evaluation results for ACCESS on different data sets.
4.Conclusion
We demonstrate the capability of ACCESS, based on clustering and supervised learning, to automatically analyze SMFS data.In pulling experiments, ACCESS can segment the FECs, extract the rupture forces, and classify the rupture forces into the corresponding conformational transitions, as demonstrated by the analysis of simulated FECs and experimental FECs.Additionally,ACCESS can analyze FECs containing more than two transitions.However,ACCESS cannot provide correct results if the data sets contain too many meaningless and uninterpretable spectra.Therefore, those spectra should be ruled out first before performing ACCESS analysis.Moreover, in force-clamp experiments, unlike previous approaches that require the input data to be free of base-line drift, ACCESS is able to identify the folded and unfolded states even though the ETTs suffer from severe nonmonotonic drifting, which is essential for further kinetic analysis.When dealing with extremely large data sets,such as ETTs collected in serval hours, it will take a lot of time to generate a training model from the ETTs.One way to solve this problem is to cut the long-time ETTs into several segments and individually analyze each segment.ACCESS requires only three easyto-interpret parameters,εand MinPts for DBSCAN andNSfor re-clustering.Combining DBSCAN and supervised classification,ACCESS efficiently identifies the fast transitions in SMFS data.Its high accuracy and fast execution allow for the automatic analysis of large data sets, reducing human labor and intervention.In addition to applications in optical tweezers and magnetic tweezers as demonstrated in this paper,ACCESS has great potential to be applied to other single molecule techniques,such as AFM and smFRET.It should be noted that the parameters,εand MinPts for DBSCAN andNSfor re-clustering should be appropriately chosen since the data sampling rate and resolution may vary for different setups.Overall, we anticipate that ACCESS can be a useful, easyto-implement and high-performance tool for single-molecule data analysis in a reliable,automated and reproducible way.
Acknowledgments
We thank members of the J.M.laboratory for critical discussion and comments and the support from the Physical Research Platform in the School of Physics of Sun Yat-sen University(PRPSP,SYSU).Project supported by the National Natural Science Foundation of China (Grant No.12074445)and the Open Fund of the State Key Laboratory of Optoelectronic Materials and Technologies of Sun Yat-sen University(Grant No.OEMT-2022-ZTS-05).

- Chinese Physics B的其它文章
- Single-qubit quantum classifier based on gradient-free optimization algorithm
- Mode dynamics of Bose-Einstein condensates in a single-well potential
- A quantum algorithm for Toeplitz matrix-vector multiplication
- Non-Gaussian approach: Withstanding loss and noise of multi-scattering underwater channel for continuous-variable quantum teleportation
- Trajectory equation of a lump before and after collision with other waves for generalized Hirota-Satsuma-Ito equation
- Detection of healthy and pathological heartbeat dynamics in ECG signals using multivariate recurrence networks with multiple scale factors