基于化学发光–光解转化法的大气氮氧化物精确测量原理与数值修正
2023-12-12 07:53李泫陈仕意陆克定曾立民张远航
北京大学学报(自然科学版) 2023年6期
李泫 陈仕意 陆克定 曾立民 张远航
北京大学学报(自然科学版) 第59卷 第6期 2023年11月
Acta Scientiarum Naturalium Universitatis Pekinensis, Vol. 59, No. 6 (Nov. 2023)
10.13209/j.0479-8023.2023.057
环境模拟与污染控制国家重点联合实验室(北京大学)自由探索课题(22Y03ESPCP)资助
2022–11–04;
2023–02–03
基于化学发光–光解转化法的大气氮氧化物精确测量原理与数值修正
李泫 陈仕意†陆克定 曾立民 张远航
北京大学环境科学与工程学院, 环境模拟与污染控制国家重点联合实验室, 国家环境保护大气臭氧污染防治重点实验室, 北京 100871; †通信作者, E-mail: chenshiyi@pku.edu.cn
2017 年夏季和冬季, 将两台自主研发的蓝光光解转化–化学发光法(BLC-PCL) NOx分析仪与传统的钼转化法(MCL) NOx分析仪(Thermo 42i-TL)进行同期性能对比实验, 详细阐述两种方法实现大气氮氧化物精确测量的原理, 并重点讨论 PCL 法测量结果的光化学零点、水汽和光化学干扰的数值修正方法。数据显示, 两种方法对 NO 的测量性能稳定(2=0.994, 斜率为 0.98), MCL 法对 NO2的测量比 PCL 法偏高 25%~30%。干扰的修正结果表明, 观测期间水汽干扰可造成 NOx信号被低估 0.2%~13.2%; 光化学干扰可导致 NO 信号被低估0~13.3%, 还可导致 NO2信号被高估 0~8.8%。以上结果表明, 在 NOx的常规监测与数据处理中, 对上述干扰的修正非常必要, 为降低干扰, 需要谨慎地设计光解转化效率、管路停留时间以及管路湿度控制等相关参数。
大气氮氧化物; 化学发光法; 精确测量; 数值修正
氮氧化物(NOx)是一氧化氮(NO)和二氧化氮(NO2)的总称, NO 和 NO2与臭氧(O3)之间的光化学循环是对流层大气光化学反应的基础。一方面, NO2光解是目前唯一已知的对流层臭氧生成机制[1]; 同时, NO2与 O3反应产生的 NO3自由基是夜间重要的氧化剂, 能氧化和清除众多还原性的痕量气体[2]; NO2还可以通过多种途径的反应产生气态亚硝酸(HONO)[3–8], 而 HONO 又是对流层大气中重要的羟基自由基(OH)来源[9–11]。另一方面, NO又可以被O3氧化而重新产生 NO2[1]。可见, NOx是大气氧化性维持的关键。此外, NOx也是光化学烟雾的重要前体物, 可以与挥发性有机物(VOCs)发生光化学反应, 产生 O3、醛、酮、酸和过氧乙酰硝酸酯(PANs)等氧化产物[12–14], 危害人体健康和生态系统[15–17]。另外, NOx衍生的 NO3, N2O5和 HNO3不但影响区域酸沉降[18–19], 还可以进一步反应生成无机或有机硝酸盐, 产生二次颗粒物, 影响区域空气质量[20–24]。不仅如此, 高浓度的 NOx还可能引起血红蛋白变性, 损伤神经系统, 直接威胁人体健康[25–26]。由此可见, NOx浓度水平对大气氧化性的维持、臭氧与二次颗粒物的生成及人体健康均有显著影响。
对流层大气 NOx浓度水平的时空变异十分强烈, 如海洋边界层的 NOx体积分数一般低于 50× 10−12[27–28], 而城市地区 NOx体积分数有时可高达10−7量级[29–31], 准确、实时和原位的 NOx测量是相关研究的基础。以臭氧污染为例, O3的生成与 NOx和 VOCs 浓度呈现高度的非线性关系[1,12,32], 尤其是在高 VOCs、低 NOx水平的条件下, O3的生成对NOx浓度非常敏感[1,33], 如 Farmer 等[34]对墨西哥城臭氧生成的敏感性分析结果显示, 当其他条件不变时, NOx的体积分数从 20×10−9削减到 15×10−9, 可能使臭氧生成速率(PO3)降低约 1/6。可见, 在这种情况下, NOx的精准测量对 O3的精准防控显得尤为重要。2013 年以来, 我国实现 NOx和 PM2.5一次排放量的有效削减[35–36], 但 VOCs 的排放削减却收效甚微[35,37], 同时臭氧和二次颗粒物污染问题日益突出[38–40]。目前, 我国城市地区的臭氧污染普遍处于VOCs 控制[36,41]。随着未来 NOx的持续深度减排, 我国许多区域臭氧与二次颗粒物生成对 NOx浓度水平的敏感性可能会逐渐增加[42–44], 对我国氮氧化物常规监测的准确性、精密度和时间分辨率提出更高要求。
目前, 国内外大气氮氧化物的浓度测量方法主要包括激光诱导荧光法(laser-induced fluorescence, LIF)[45]、腔衰荡光谱法(cavity ring-down spectro-scopy, CRDS)[46]、量子级联激光法(quantum cascade laser, QCL)[47]和化学发光法等[48], 其中化学发光法是美国[49]和欧洲环保署[50]推荐的参考方法。化学发光法基于 NO 与 O3反应产物的发光特性进行定量测量[51–52]。与其他方法相比, 化学发光法具有准确性好、稳定性强、仪器体积小、操作简单、成本较低和可连续在线监测等诸多优点, 适用于环境大气氮氧化物的常规监测。然而, 该方法在一定程度上受 H2O 等物质对 NO2*分子淬灭的干扰[53–54], 如绝对湿度为 9g/m3时, 可导致荧光信号损失 4%[55]。烯烃等 VOCs 组分与 O3反应产生的荧光也可能与NO2*返回基态产生的荧光光谱有一定程度的重 叠[56]。Alams 等[57]的研究结果表明, 烯烃对测量结果的干扰最高可达 11%。此外, 温度和压力等物理因素的影响也可能非常显著[58]。
化学发光法无法直接测量 NO2浓度, 需要将NO2转化为NO进行检测。钼转化–化学发光法(Mo-chemiluminescence, MCL)是我国环境空气 NOx自动连续监测的标准方法[59]。MCL 法的原理是在 300~ 350℃ 下, 通过钼催化实现 NO2向 NO 的热力学转化[60]。该方法技术成熟, 广泛应用于环境空气 NOx在线监测。然而, 大量观测实验表明, MCL 法不仅会还原 NO2, 也会同时将多种含氮化合物转化为NO, 这些含氮化合物包括 NO3, HNO3, N2O5, PAN和 HONO, 也包括少量 NH3, RO2NO2及颗粒态含氮化合物[54,61]。因此, MCL 法普遍存在对 NOx和 NO2浓度的系统性高估。通过观测实验与模式计算发现, 采用钼转化法测得的 NO2浓度比真值偏高 7%~ 50%[61–62]。
20 世纪 90 年代, 研究者设计出一种特异性更强的 NO2转化方法, 其原理是 NO2分子可以在特定波段(<425nm)的光照下光解产生 NO, 然后利用化学发光法测量 NO 浓度, 该方法称为光解转化–化学发光法(photolytic chemiluminescence, PCL)[63–64]。根据 NO2分子的吸收截面和光量子产率特征选择特定波段的光源, 可以提高 NO2的转化效率和特异性。近年来, 发光二极管光源(LED)迅速更新迭代, 最新的蓝光 LED 光源具有低能耗、高强度、高选择性和长寿命的优点, 并且具有窄带光谱特性, 成为 NO2光解转化炉光源的重要选择[48,65]。目前, 北京大学开发了蓝光光解转化炉, 研究充分, 技术成熟, 积累了较长时间的连续测量数据。蓝光光解转化–化学发光法(BLC-PCL)不仅能够避免 NO2转化过程中 PAN 等其他含氮物种的干扰, 提升 NOx测量的准确性[48], 还可以大大增加仪器的时间分辨率, 适宜作为一种 MCL 的补充方法来参与 NOx的常规 监测。
本研究将自主研发的 BLC-PCL NOx分析仪与传统的 MCL 法 NOx分析仪(Thermo Model42i-TL)在夏季和冬季各进行一次同期对比实验, 本文详细阐述基于化学发光大气氮氧化物精确测量原理, 评估二者测量结果的准确性、精密度和稳定性, 并着重探讨水汽和臭氧等干扰对测量结果的影响和修正方法, 为环境大气 NOx精确测量提供较为完善的测量方案。
1 仪器和方法
实验小组于 2017 年夏季(6 月 26 日—7 月 2 日)和冬季(11 月 14 日—11 月 20 日)期间, 利用一台传统的钼转化法(MCL) NOx分析仪(Thermo 42i-TL)和两台自主研发的光解转化法(PCL)NOx分析仪进行连续观测实验, 实验地点为北京大学理科六号楼顶观测平台(北京大学大气超级观测站)。
1.1 一氧化氮的测量
化学发光法测量 NO 的基本原理是 NO 分子与O3反应会生成激发态的二氧化氮(NO2*), NO2*衰减至较低能态时会释放出荧光[66–67], 荧光强度与 NO浓度成正比, 其发光光谱起始于 600nm, 延伸至近红外区, 光谱中心在约 1200nm 处[57](见反应式(R1)~(R3))。
NO + O3→ NO2*+ O2, (R1)
NO2*→ NO2+ hν (600 nm ≤≤ 3000 nm) , (R2)
NO2*+ M → NO2+ M。 (R3)
Thermo 42i-TL 的环境空气 NOx分析流程见图1。在 NO 模式下, 通过滤膜去除颗粒物后的待测环境空气与臭氧发生器产生的过量 O3在反应腔中混合, NO 会与 O3反应产生 NO2*, 当 NO2*返回基态时释放的荧光会被光电倍增管(photomultiplier tube, PMT)捕获, 得到光强信号, 根据 NO 浓度与光强的正比关系, 可以计算 NO 浓度。为了降低暗电流, 提高仪器信噪比, PMT 需要封装在热电冷却器中(−10℃); 为延长 NO2*的荧光寿命, 反应与 PMT 检测均在低压环境(≥2000Pa)中进行, 以便降低 NO2*碰撞淬灭的概率[55,58]。此外, PMT 检测器上安装滤光片, 仅允许波长大于 600nm 的可见及红外光通过, 降低其他化学过程对荧光信号的干扰[57]。
大气中烯烃与 O3的反应也可以产生红外波段的荧光, 为了扣除臭氧烯烃反应对 NO 测量结果的干扰, 仪器气路中设置一个预反应腔(图 1)。O3-烯烃反应的速率常数(10−18~10−17cm3/(molecule·s))通常远远低于 O3-NO 反应的速率常数(1.9×10⁻¹⁴cm3/ (molecule·s))[68], 因此, 可通过控制停留时间, 使 O3先与 NO 在预反应腔中充分反应, 然后与烯烃等干扰物质在反应腔中反应并释放荧光, 此时PMT检测到的信号即为背景信号, 扣除背景值即可消除烯烃等物质及暗电流等仪器噪声造成的干扰[55]。
1.2 二氧化氮的测量
对于 NO2的测量, 需要先将 NO2转化为 NO, 再根据上述原理测定 NO 的浓度, 测得的结果是 NO与 NO2浓度的总和。
1.2.1钼转化法
基于钼转化法的 Thermo Model42i-TL 型NOx分析仪的测量流程如图 1 所示。在 NOx模式下, 待测空气通过取样口进入分析仪后, 切换电磁阀, 样品气体进入钼转化炉, 其内的钼催化剂会在 325℃下将 NO2催化还原成 NO(R4), 然后进入反应腔被检测[62]。
1.2.2光解转化法
光解转化法的原理是 NO2在波长小于 424nm的光照下会被解离成 NO 和 O(3P)原子[63]:
NO2+ hν (<424 nm) → NO + O(3P)。 (R5)
NO2的转化效率(conversion efficiency, CE)可以使用式(1)计算, 得到 CE 后即可按式(2)和(3)分别计算 NO2和 NOx的浓度。
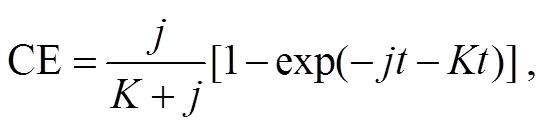


从式(1)可以看出, NO2的转化率仅与光解转化炉中的停留时间、光化通量、吸收截面、量子产率及氧化剂的种类有关。停留时间越长, NO2的转化效率越高, 但也增加了 NO 与 O3等氧化剂反应以及NO2或其他含氮化合物热解或非均相分解的概率, 因此适当缩短停留时间, 可以提高光解对 NO2的选择性[64]。与增加停留时间相比, 增加光解速率常数能更显著地提高 NO2的转化率[63]。光解速率常数取决于光化通量, 而后者又主要取决于光源的类型[48,65], 使用高强度的光源可大大提升 NO2的转化率和仪器的灵敏度。本研究采用的光源是紫外发光二极管(UV-LED), 光源辐射光强为 15000mW, 波长中心为 395nm, 波长范围为 390~400nm。这是由于在 395nm处 NO2的吸收截面和量子产率较高, 且UV-LED 光源的发射光谱与 PAN, HONO, NO3和BrONO2等其他含氮化合物的吸收光谱重叠很少, 能最大程度地减小这些物种对测量带来的干扰[48]。本研究中样品气在光解反应室停留时间设为 0.67s, 既可以保证 NO2的高效转化, 也降低了氧化剂或壁效应的影响。
1.3 仪器的标定
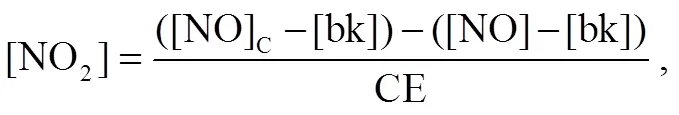
化学发光法并不是一种绝对的测量方法, 仪器灵敏度取决于反应腔和 PMT 的温度和压力等因素,这些参数会随时间而变化, 因此必须定期进行零点、量程和 NO2转化效率的标定。本研究中, 每隔48 小时对使用的 MCL 法和 PCL 法 NOx分析仪同步标定一次, 且标定的环境条件、浓度范围与实际测量一致。仪器的标定流程如图 2 所示, 标定步骤 如下。
1)零点标定: 通入零气 20 分钟, 示数稳定 10分钟, 校正零点。
2)NO 浓度标定: 将一定浓度的 NO 通入系统20 分钟, 示数稳定 10 分钟, 在开启或不开启光解转化炉的条件下, 分别测得 NO 浓度信号[NO]C(1)和[NO](1)。NO 标定结果漂移应当在±2%内, 如果[NO]C(1)显著高于[NO](1), 则表明 NO 标气或零气中存在 NO2杂质。
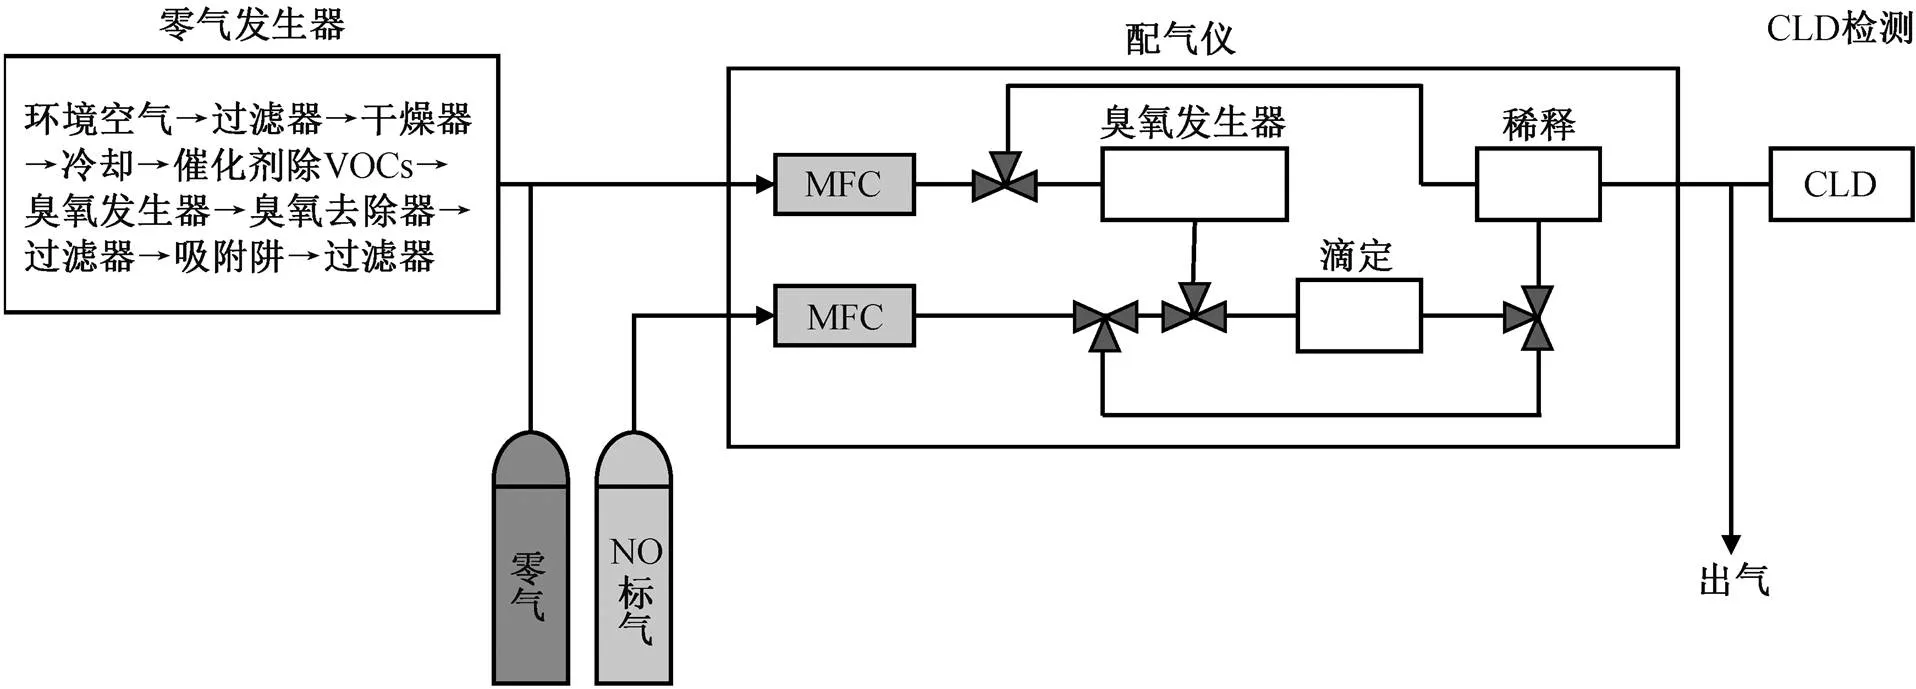
图2 光解转化−化学发光法NOx分析仪标定流程
3)NO2转化效率标定: 保持 NO 浓度不变, 打开臭氧发生器, 选择某一臭氧浓度, 通入臭氧 20 分钟, 使 40%~80%的 NO 被臭氧反应, 示数稳定 10 分钟, 在开启或不开启光解转化炉的条件下, 分别测得 NO 浓度信号[NO]C(2)和[NO](2)。这样一来, NO2的转化效率就可以用式(4)计算[55]。本实验中, NO2的光解转化效率稳定在 96.5%±0.5%。

2 结果与讨论
2.1 MCL法与PCL法测量稳定性分析
2017 年夏季(6 月 26 日—7 月 2 日)和冬季(11 月14 日—20 日)观测期间, O3与 NOx的时间序列如图 3所示。由于夏季光照强、气温高, O3浓度水平高于冬季, 且呈现较明显的昼夜变化, 观测期间, 夏季和冬季 O3平均体积分数分别为(58.2±36.1)×10−9和(11.6±12.0)×10−9。夏季较高的 O3也导致NO几乎都被氧化成 NO2, 且夏季 NOx排放量较低, 因此夏季NO 体积分数((3.0±5.7)×10−9)显著低于冬季((34.8± 35.6)×10−9), NO2体积分数水平则大致相当((0~60)× 10−9)。
基于 MCL 法和 PCL 法的 NO 时间序列和线性回归结果分别如图 3(c)和(d)及图 4 所示。数据显示, MCL法和 PCL 法的 NO 体积分数测量结果平均差值为(0.11±4.83)×10−9, 拟合方程为[NO-PCL]=0.97× [NO-MCL]+0.43, 相关系数2为 0.995 (见图 4)。该结果表明, 两台仪器的发光反应腔及检测系统性能稳定, 且测量精度基本上一致。NO2的测量数据如图 3(e)和(f)所示, 夏季 MCL 法测得的 NO2体积分数平均比 PCL 法偏高(3.51±3.14)×10−9(30.8%± 44.5%), 冬季则平均偏高(6.18±4.41)×10−9(25.5%± 17.6%)。如前文所述, MCL 与 PCL 对 NO2测量结果产生偏差的主要原因是 MCL 法会将多种其他含氮化合物热催化转化为 NO。一般来说, 冬季近地面含氮化合物浓度普遍高于夏季(约 30%~50%), 这可能是本研究观测时段内冬季 MCL 法与 PCL 法对NO2浓度的测量差值高于夏季的原因。

图3 研究时段内O3和NOx测量结果时间序列
2.2 PCL法测量干扰的修正
对于化学发光法 NOx的测量, 需要校正的干扰主要来自三方面: 一是背景干扰; 二是发光反应腔中 NO2*与 H2O 分子碰撞淬灭导致荧光信号的减弱; 三是仪器管路中光化学稳态的改变导致的 NO2高估。校正所需参数如表 1 所示。
2.2.1光化学零点修正
从理论上说, 在夜间无光照(23:00—2:00)且站点周边无明显排放源的情况下, 若 O3体积分数持续高于 20×10−9, NO 几乎完全被 O3氧化成 NO2, 此时NO 体积分数的理论值应该接近 0, 称为光化学零点。然而, 由于背景干扰的存在, 实际测得的 NO往往偏离 0, 在数据处理过程中需要扣除该时段内测得的 NO 浓度均值[69]。本研究中, 夏季和冬季测得的光化学零点数值均在(0.0±0.5)×10−9范围内, 表明仪器稳定性和准确性较好。
2.2.2水汽干扰的修正
NO2*分子可以与空气中的 N2, O2和 H2O 等分子发生碰撞, 将多余的能量传递给这些分子, 从而返回基态, 使荧光信号减弱。空气中 N2和 O2等组分的浓度相对恒定, 可以通过标定来消弭这些分子的干扰, 而水汽的浓度存在很强的时空变异性, 无法通过标定消除其干扰, 必须进行修正。NO 的水汽修正方法见式(5)[70]。
[NO]H2O Corr.=[NO]∙(1+[H2O]),(5)

由式(5)可见, 湿度校正因子H2O=1+[H2O]与相对湿度RH (%)成正比, 与温度则呈负倒数关系(图 5)。在本研究观测时段内, 冬季平均气温为 3.9± 2.2℃, 平均 RH 为 24.6%±10.2%, 由于冬季气温和相对湿度均较低, 使湿度校正因子偏低, 均值为1.007±0.003(1.002~1.013), 表明冬季观测期间水汽对 NO2*的平均淬灭率为 0.7%±0.3%(0.2%~1.3%), 可导致 NO 体积分数观测值比实际值偏低最多 1.72 ×10⁻⁹。夏季气温、湿度均较高, 平均气温为 30.3 ±3.8℃, 平均 RH 为 59.3%±13.8%, 使湿度校正因子整体更高, 均值为 1.103±0.013(1.065~1.132), 可见夏季观测期间水汽的干扰可造成 NO 被低估最多13.2% (3.56×10⁻⁹) (图 6(a))。
2.2.3光化学校正
在实际大气环境中, 反应(R1)与(R5)处于光化学平衡状态, 当环境空气通过采样口进入 NOx测量系统后, 原先的平衡就会被破坏, 最终测得的 NO和 NO2浓度会偏离实际环境空气中的浓度。因此, 需要在水汽干扰修正的基础上, 对实测数据进行光化学校正(图 7)。

图5 湿度校正因子与相对湿度和温度的关系
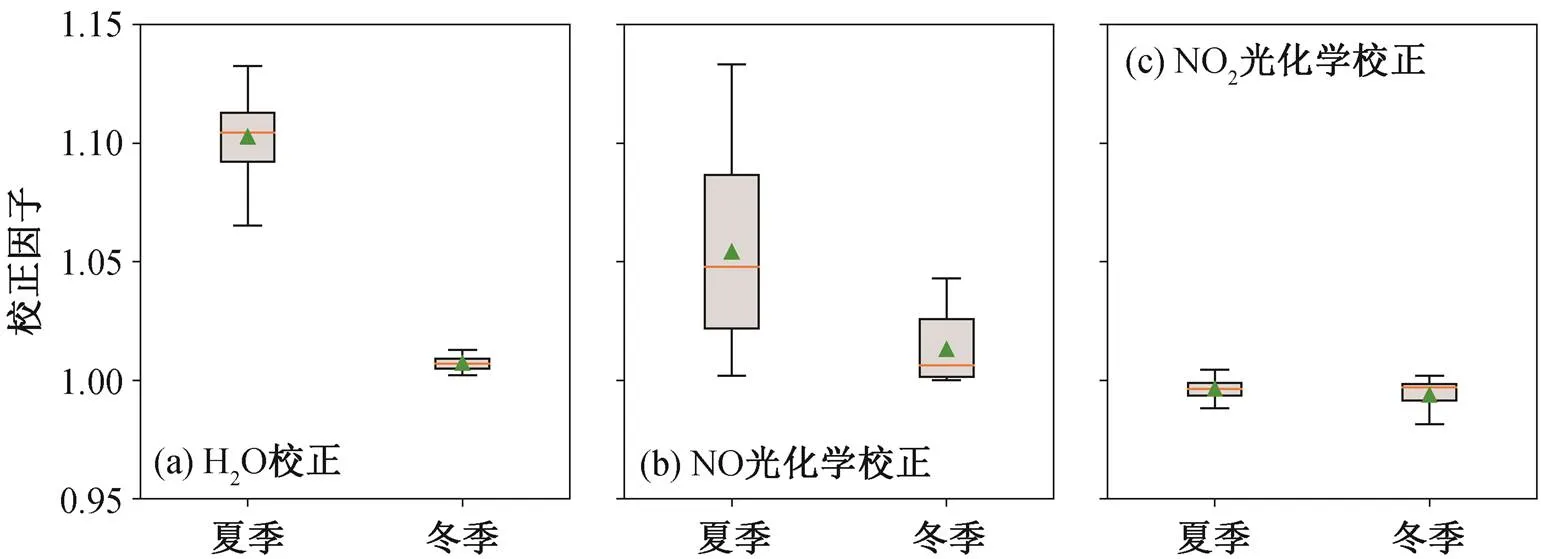
图6 2017年11月20日PCL法NOx校正结果与实测值之比

下角标PSS指光解转化炉中的光化学稳态浓度(photochemical stationary state)
如图 7 所示, 对于环境空气 NO 浓度的测量, 气体样品由管路(1)直接传输到反应室中与 O3反应并由 PMT 检测。记进入管路前的 NO 和 NO2浓度分别为[NO]0和[NO2]0, 在采样管路内, 由于光照不足, NO2的光解反应(R5)停止, 但 NO 与 O3等氧化剂的反应(R1)仍会继续, 因此 NO2在管路中不断积累, NO 则不断消耗, 仪器会低估实际大气中的 NO 浓度[NO]0。[NO]0与实际检测到的 NO 浓度[NO]E1之间存在函数关系, 可由式(6)计算:
[NO]0=[NO]E1∙exp(1[O3]∙E1),(6)
式中,E1是气体从进样口输送到发光反应腔所需的时间,1是反应 R1 的速率常数, [O3]则为管路中的O3浓度。由于大气中的 O3浓度一般远高于在管路内的消耗量, 所以在实际计算中[O3]往往直接采用环境空气 O3浓度。
如图 6(b)所示, 在本研究的观测时段内, 冬季NO 光化学修正因子NO=exp(1[O3]∙E1)平均值为1.013±0.013(1.000~1.043), 表明仪器内部光化学稳态的改变可以使测得的 NO 浓度[NO]E1比实际值[NO]0偏低 1.3%±1.3%(0.0~4.3%)。夏季NO高于冬季, 均值为 1.054±0.037(1.002~1.133), 可知仪器内部光稳态的改变最大可使夏季 NO 被低估超过10%。由式(6)可知, 臭氧浓度和E1对[NO]0的影响是指数级的(图 8), 本研究设置的E1恒定(表 1), 因此冬季与夏季NO的数值差异主要是由 O3浓度夏高冬低的季节性变化引起的。
对于 NO2的测量, 情况则相对复杂。气体样品需经管路(2)的输送进入光解转化炉, 然后由管路(3)输送至反应腔进行检测。管路(2)和(3)中均为黑暗条件, 而光解转化炉中存在强烈光照, 会建立新的化学平衡, 要计算实际[NO]0和[NO2]0与实测 NO浓度[NO]E2之间的关系, 需考虑这 3 种环境中 NOx浓度的变化, 如式(7)[55,71]所示:

式中,C1是 NO 模式下气体在管路中的停留时间,C2是 NOx模式下气体在光解转化炉中的停留时间(图 7),是 NO2的光解速率常数(表 1)。
总体来说, 实测 NO2浓度[NO2]M主要取决于待测气体在管路(1)和光解转化炉中的停留时间、光源强度、氧化剂 O3的浓度以及初始测量值[NO]E1和[NO]E2。如前所述, 由于黑暗条件下仅存在反应(R1), 通常会使[NO]E1偏低, 导致[NO2]M偏高, 即NO2的光化学校正因子NO2<1, 且NO2随着臭氧浓度的增加而下降; 管路中的停留时间E1越长, 偏差就越大(图 8(b))。若光解转化炉中的停留时间C2太长或转化效率 CE 太低, 则可能造成已经转化为 NO的部分与氧化剂反应重新产生 NO2, 使[NO]E2下降, [NO2]M偏低, 即导致NO2>1, 且NO2随着 O3浓度的增加而上升。然而, 若E1持续增加, 则管路中反应R1 对 NO2浓度的影响就会逐渐占据主导, 使NO2逐渐降低(图 8(c))。
如图 6(c)所示, 冬季观测期间, NO2的光化学校正因子NO2均值为 0.993±0.008 (0.912~1.002); 而夏季观测期间NO2均值为 0.996±0.003 (0.971~1.004), 可知冬季和夏季光解转化法 NOx仪器对NO2浓度整体均有所高估, 且冬季与夏季NO2大致在同一水平, 无显著差异(>0.05)。综合上述讨论, 由于本研究采用的光解转化效率 CE 非常高, 光解转化炉内的停留时间C2很短(表 1), 可推测造成 NO2体积分数测量结果偏高的主要原因是管路内反应(R1)造成 NO2的积累, 但整体影响较小, 在观测期间最高可造成 0.41×10⁻⁹的测量偏差。
3 结论与展望
本研究基于 2017 年夏季(6 月 26 日—7 月 2 日)和冬季(11 月 14 日—20 日)的观测数据, 对钼转化法(MCL)和光解转化法(PCL) NOx的测量进行同期对比实验。NO 监测结果表明, MCL 法和 PCL 法测量数据的相关性很好(2=0.995), 斜率为 0.97, 表明两台仪器性能稳定, 且测量精度基本上一致。NO2测量数据显示, 夏季和冬季用 MCL 法测得的 NO2体积分数分别比 PCL 法平均偏高(3.51±3.14)×10−9(30.8%±44.5%)和(6.18±4.41)×10−9(25.5%±17.6%), 其主要原因是 MCL 法会将多种其他含氮化合物热催化转化为 NO, 冬季偏差更大的原因在于冬季含氮化合物的浓度普遍更高。
本文还重点讨论了背景干扰、水汽干扰和光化学干扰对 PCL 法 NOx测量结果的影响和上述 3 类干扰的校正方法, 得到的主要结论如下。
1)观测期间, 冬季和夏季 PCL 法及 MCL 法测得的 NO 光化学零点数值均在(0.0±0.5)×10−9的范围内, 表明背景干扰较小, 仪器稳定性较好。
2)湿度校正因子NO2与 RH 和气温均正相关。由于冬季气温和 RH 较低, 因此冬季NO2显著低于夏季。观测期间, 冬季水汽对 NO2*的平均淬灭率为0.7%±0.3%, 最大可导致 NO 体积分数被低估 1.3% (1.72×10⁻⁹)。夏季 NO2*的平均淬灭率则高达 10.3% ±1.3%, 最高可以造成 NO 测量值偏低 13.2%(3.56× 10⁻⁹)。
3)NO 的光化学校正因子NO与[O3]和E1呈指数正相关关系。观测期间, 夏季NO高于冬季。冬季NO均值为 1.013±0.013 (1.000~1.043), 夏季NO均值为 1.054±0.037(1.002~1.133)。本研究设置的E1恒定, 因此冬季、夏季NO的数值差异主要源于 O3浓度夏高冬低的季节性变化。夏季[O3]较高的情况下, 仪器内 O3对 NO 的氧化最高可使 NO 测量值偏低 13.3%。
4)NO2的光化学校正因子NO2的影响因素包括待测气体的停留时间、光源强度、氧化剂 O3的浓度以及初始测量值[NO]E1和[NO]E2。观测期间, 冬季和夏季NO2大致在同一水平, 均值分别为 0.993± 0.008 和 0.996±0.003。本研究采用固定的停留时间和光源强度, 且转化效率很高, 因此可推测造成NO2体积分数测量结果偏高的主要原因是管路内反应(R1)造成 NO2的积累, 但整体影响较小, 在观测期间最高可造成 0.41×10⁻⁹的测量偏差。
综上所述, 在 NOx的常规监测与数据处理中, 对上述干扰的修正是非常必要的。尤其值得注意的是, 在夏季高温、高湿、高 O3浓度的条件下, 水汽淬灭可导致 10%以上的 NO2*荧光信号损失, 而仪器管路内 O3对 NO 的氧化最高亦可使 NO 浓度被低估10%以上。此外, 光化学修正因子对光解转化效率和停留时间的敏感性很高, 在实际监测过程中, 必须谨慎设计相关参数, 以便最大程度地减小光化学干扰对监测结果的影响。最后, 本研究重点讨论了PCL 法 NOx监测数据干扰修正的方法, 其原理同样适用于 MCL 法, 但 MCL 法 NO2的光化学修正公式需要经过适当的变形。
[1] Seinfeld J, Pandis S. Atmospheric chemistry and phy-sics: from air pollution to climate change. New York: John Wiley & Sons, 2016
[2] Brown S S, Stutz J. Nighttime radical observations and chemistry. Chemical Society Reviews, 2012, 41(19): 6405–6447
[3] Harrison R M, Peak J D, Collins G M. Tropospheric cycle of nitrous acid. Journal of Geophysical Research: Atmospheres, 1996, 101(D9): 14429–14439
[4] LI X, Brauers T, Häseler R, et al. Exploring the atmospheric chemistry of nitrous acid (HONO) at a rural site in Southern China. Atmospheric Chemistry and Physics, 2012, 12(3): 1497–1513
[5] Gu R, Shen H, Xue L, et al. Investigating the sources of atmospheric nitrous acid (HONO) in the megacity of Beijing, China. Science of The Total Environment, 2022, 812: 152270
[6] Ma J, Liu Y, Han C, et al. Review of heterogeneous photochemical reactions of NOon aerosol — a possi-ble daytime source of nitrous acid (HONO) in the at-mosphere. Journal of Environmental Sciences, 2013, 25(2): 326–334
[7] Yang W, Han C, Zhang T, et al. Heterogeneous pho-tochemical uptake of NO2on the soil surface as an important ground-level HONO source. Environmental Pollution, 2021, 271: 116289
[8] Indarto A. Heterogeneous reactions of HONO forma-tion from NO2and HNO3: a review. Research on Che-mical Intermediates, 2012, 38(3): 1029–1041
[9] Kleffmann J, Gavriloaiei T, Hofzumahaus A, et al. Daytime formation of nitrous acid: a major source of OH radicals in a forest. Geophysical Research Letters, 2005, 32(5): L05818
[10] Theys N, Volkamer R, Müller J F, et al. Global nitrous acid emissions and levels of regional oxidants en-hanced by wildfires. Nature Geoscience, 2020, 13(10): 681–686
[11] Alicke B, Geyer A, Hofzumahaus A, et al. OH for-mation by HONO photolysis during the BERLIOZ experiment. Journal of Geophysical Research: Atmos-pheres, 2003, 108(D4): PHO 3-1–PHO 3-17
[12] Atkinson R. Atmospheric chemistry of VOCs and NO. Atmospheric Environment, 2000, 34(12/13/14): 2063–2101
[13] Fischer E, Jacob D J, Yantosca R M, et al. Atmospheric peroxyacetyl nitrate (PAN): a global budget and source attribution. Atmospheric Chemistry and Physics, 2014, 14(5): 2679–2698
[14] Xue L, Gu R, Wang T, et al. Oxidative capacity and radical chemistry in the polluted atmosphere of Hong Kong and Pearl River Delta region: analysis of a severe photochemical smog episode. Atmospheric Chemistry and Physics, 2016, 16(15): 9891–9903
[15] Temple P, Taylor O. World-wide ambient measure-ments of peroxyacetyl nitrate (PAN) and implications for plant injury. Atmospheric Environment, 1983, 17 (8): 1583–1587
[16] Sun E J, Huang M H. Detection of peroxyacetyl nitra-te at phytotoxic level and its effects on vegetation in Taiwan. Atmospheric Environment, 1995, 29(21): 2899–2904
[17] Vyskocil A, Viau C, Lamy S. Peroxyacetyl nitrate: review of toxicity. Human & Experimental Toxicology, 1998, 17(4): 212–220
[18] Galloway J. Acid deposition: perspectives in time and space. Water, Air, and Soil Pollution, 1995, 85(1): 15–24
[19] Duan L, Yu Q, Zhang Q, et al. Acid deposition in Asia: emissions, deposition, and ecosystem effects. Atmos-pheric Environment, 2016, 146: 55–69
[20] Rollins A W, Browne E C, Min K E, et al. Evidence for NOx control over nighttime SOA formation. Science, 2012, 337: 1210–1212
[21] Ayres B, Allen H, Draper D, et al. Organic nitrate aerosol formation via NO3+ biogenic volatile organic compounds in the southeastern United States. Atmos-pheric Chemistry and Physics, 2015, 15(23): 13377–13392
[22] Ng N, Kwan A, Surratt J, et al. Secondary organic aerosol (SOA) formation from reaction of isoprene with nitrate radicals (NO3). Atmospheric Chemistry and Physics, 2008, 8(14): 4117–4140
[23] Riemer N, Vogel H, Vogel B, et al. Impact of the heterogeneous hydrolysis of N2O5on chemistry and nitrate aerosol formation in the lower troposphere under photosmog conditions. Journal of Geophysical Research: Atmospheres, 2003, 108(D4): 4144
[24] Pathak R K, Wang T, Wu W S. Nighttime enhancement of PM2.5nitrate in ammonia-poor atmospheric condi-tions in Beijing and Shanghai: plausible contributions of heterogeneous hydrolysis of N2O5and HNO3parti-tioning. Atmospheric Environment, 2011, 45(5): 1183–1191
[25] Boningari T, Smirniotis P G. Impact of nitrogen oxides on the environment and human health: Mn-based ma-terials for the NOx abatement. Current Opinion in Chemical Engineering, 2016, 13: 133–141
[26] Lu X, Yao T, Li Y, et al. Source apportionment and health effect of NOxover the Pearl River Delta region in southern China. Environmental Pollution, 2016, 212: 135–146
[27] Reed C, Evans M J, Crilley L R, et al. Evidence for renoxification in the tropical marine boundary layer. Atmospheric Chemistry and Physics, 2017, 17(6): 4081–4092
[28] Crawford J, Davis D, Chen G, et al. Implications of large scale shifts in tropospheric NOlevels in the remote tropical Pacific. Journal of Geophysical Re-search: Atmospheres, 1997, 102(D23): 28447–28468
[29] Cheng N, Li Y, Sun F, et al. Ground-level NO2in urban Beijing: trends, distribution, and effects of emission reduction measures. Aerosol and Air Quality Research, 2018, 18(2): 343–356
[30] Ghermandi G, Fabbi S, Veratti G, et al. Estimate of secondary NO2levels at two urban traffic sites using observations and modelling. Sustainability, 2020, 12 (19): 7897
[31] Korek M, Johansson C, Svensson N, et al. Can dis-persion modeling of air pollution be improved by land-use regression? An example from Stockholm, Sweden. Journal of Exposure Science & Environmental Epi-demiology, 2017, 27(6): 575–581
[32] Lin X, Trainer M, Liu S. On the nonlinearity of the tropospheric ozone production. Journal of Geophysical Research: Atmospheres, 1988, 93(D12): 15879–15888
[33] Mazzuca G M, Ren X, Loughner C P, et al. Ozone production and its sensitivity to NOand VOCs: results from the DISCOVER-AQ field experiment, Houston 2013. Atmospheric Chemistry and Physics, 2016, 16 (22): 14463–14474
[34] Farmer D, Perring A, Wooldridge P, et al. Impact of organic nitrates on urban ozone production. Atmos-pheric Chemistry and Physics, 2011, 11(9): 4085–4094
[35] Zheng B, Tong D, Li M, et al. Trends in China’s anthropogenic emissions since 2010 as the conse-quence of clean air actions. Atmospheric Chemistry and Physics, 2018, 18(19): 14095–14111
[36] Ren J, Xie S. Diagnosing ozone-NO-VOC sensitivity and revealing causes of ozone increases in China based on 2013–2021 satellite retrievals. Atmospheric Che-mistry and Physics Discussions, 2022, 22(22): 15035–15047
[37] Li M, Zhang Q, Zheng B, et al. Persistent growth of anthropogenic non-methane volatile organic compound (NMVOC) emissions in China during 1990–2017: dri-vers, speciation and ozone formation potential. Atmos-pheric Chemistry and Physics, 2019, 19(13): 8897–8913
[38] Lu X, Hong J, Zhang L, et al. Severe surface ozone pollution in China: a global perspective. Environmen-tal Science & Technology Letters, 2018, 5(8): 487–494
[39] Zhu Y, Huang L, Li J, et al. Sources of particulate matter in China: insights from source apportionment studies published in 1987–2017. Environment interna-tional, 2018, 115: 343–357
[40] Huang X, Ding A, Gao J, et al. Enhanced secondary pollution offset reduction of primary emissions during COVID-19 lockdown in China. National Science Re-view, 2021, 8(2): nwaa137
[41] Li K, Jacob D J, Liao H, et al. Anthropogenic drivers of 2013–2017 trends in summer surface ozone in China. Proceedings of the National Academy of Sci-ences, 2019, 116(2): 422–427
[42] Pusede S, Duffey K, Shusterman A, et al. On the effectiveness of nitrogen oxide reductions as a control over ammonium nitrate aerosol. Atmospheric Chemis-try and Physics, 2016, 16(4): 2575–2596
[43] Ren C, Huang X, Wang Z, et al. Nonlinear response of nitrate to NOxreduction in China during the COVID-19 pandemic. Atmospheric Environment, 2021, 264: 118715
[44] Li M, Zhang Z, Yao Q, et al. Nonlinear responses of particulate nitrate to NOxemission controls in the megalopolises of China. Atmospheric Chemistry and Physics, 2021, 21(19): 15135–15152
[45] Matsumoto J, Kajii Y. Improved analyzer for nitrogen dioxide by laser-induced fluorescence technique. At-mospheric Environment, 2003, 37(34): 4847–4851
[46] Osthoff H D, Brown S S, Ryerson T B, et al. Mea-surement of atmospheric NO2by pulsed cavity ring-down spectroscopy. Journal of Geophysical Research: Atmospheres, 2006, 111(D12): D12305
[47] Tuzson B, Zeyer K, Steinbacher M, et al. Selective measurements of NO, NO2and NOyin the free tro-posphere using quantum cascade laser spectroscopy. Atmospheric Measurement Techniques, 2013, 6(4): 927–936
[48] Reed C, Evans M J, Di Carlo P, et al. Interferences in photolytic NO2measurements: explanation for an apparent missing oxidant?. Atmospheric Chemistry and Physics, 2016, 16(7): 4707–4724
[49] US EPA. Recommended methods for ambient air monitoring of NO, NO2, NOy, and individual NOzspecies [S/OL]. (2000) [2022–08–12]. https://nepis. epa.gov
[50] European Committee for Standardization. Standard method for the measurement of the concentration of nitrogen dioxide and nitrogen monoxide by chemilu-minescence (EN 14211: 2012) [S/OL]. (2012) [2022–08–12]. https://standards.iteh.ai/catalog/standards/cen/ 46e97f97-9007-4b4c-8040-3ce5b0187ed5/en-14211-2012
[51] Drummond J W, Volz A, Ehhalt D H. An optimized chemiluminescence detector for tropospheric NO mea-surements. Journal of Atmospheric Chemistry, 1985, 2(3): 287–306
[52] Peterson M C, Honrath R E. NOand NOover the northwestern North Atlantic: measurements and mea-surement accuracy. Journal of Geophysical Research: Atmospheres, 1999, 104(D9): 11695–11707
[53] Zabielski M F, Seery D J, Dodge L G. Influence of mass transport and quenching on nitric oxide chemilumi-nescent analysis. Environmental Science & Technolo-gy, 1984, 18(2): 88–92
[54] Mcclenny W A, Williams E J, Cohen R C, et al. Pre-paring to measure the effects of the NOX SIP Call —methods for ambient air monitoring of NO, NO2, NOy, and individual NOz species. Journal of the Air & Waste Management Association, 2002, 52(5): 542–562
[55] Gilge S, Plass-Duelmer C, Roher F, et al. WP4-NA4: Trace gases networking: volatile organic carbon and nitrogen oxides deliverable D4. 10: standardized ope-rating procedures (SOPs) for NOxy[EB/OL]. (2014) [2022–08–14]. https://www.semanticscholar.org/paper/ WP-4-NA-4-%3A-Trace-gases-networking-%3A-Vola tile-and-D/f56e73cd8cf4afe9ea32e795e07fdb82f1c5c9 ee
[56] Pitts Jr J, Kummer W, Steer R, et al. The chemilumi-nescent reactions of ozone with olefins and organic sulfides. Washington, DC: ACS Publications. 1972: 246–254
[57] Alam M S, Crilley L R, Lee J D, et al. Interference from alkenes in chemiluminescent NOx measurements. At-mospheric Measurement Techniques, 2020, 13(11): 5977–5991
[58] Fontijn A, Sabadell A J, Ronco R J. Homogeneous chemiluminescent measurement of nitric oxide with ozone: implications for continuous selective monito-ring of gaseous air pollutants. Analytical Chemistry, 1970, 42(6): 575–579
[59] 中华人民共和国生态环境部. 环境空气氮氧化物的自动测定化学发光法(HJ 1043—2019) [S/OL]. (2019) [2022–08–12]. https://www.mee.gov.cn/ywgz/ fgbz/bz/bzwb/jcffbz/201911/t20191101_740434.shtml
[60] Villena G, Bejan I, Kurtenbach R, et al. Interferences of commercial NO2instruments in the urban atmos-phere and in a smog chamber. Atmospheric Measure-ment Techniques, 2012, 5(1): 149–159
[61] Dunlea E, Herndon S, Nelson D, et al. Evaluation of nitrogen dioxide chemiluminescence monitors in a polluted urban environment. Atmospheric Chemistry and Physics, 2007, 7(10): 2691–2704
[62] 曹玮, 曾立民, 吴宇声, 等. NOx光解测量装置的观测应用实例. 环境科学学报, 2015, 35(3): 670–676
[63] Ryerson T, Williams E, Fehsenfeld F. An efficient photolysis system for fast-response NO2measure-ments. Journal of Geophysical Research: Atmospheres, 2000, 105(D21): 26447–26461
[64] Gao R, Keim E, Woodbridge E, et al. New photolysis system for NO2measurements in the lower stratos-phere. Journal of Geophysical Research: Atmospheres, 1994, 99(D10): 20673–20681
[65] Pollack I B, Lerner B M, Ryerson T B. Evaluation of ultraviolet light-emitting diodes for detection of at-mospheric NO2by photolysis-chemiluminescence. Journal of Atmospheric Chemistry, 2010, 65(2): 111–125
[66] Clyne M, Thrush B, Wayne R. Kinetics of the che-miluminescent reaction between nitric oxide and ozone. Transactions of the Faraday Society, 1964, 60: 359–370
[67] Clough P, Thrush B A. Mechanism of chemilumines-cent reaction between nitric oxide and ozone. Tran-sactions of the Faraday Society, 1967, 63: 915–925
[68] Burkholder J, Sander S, Abbatt J, et al. Chemical kinetics and photochemical data for use in atmospheric studies: evaluation number 19 [R]: Pasadena, CA: Jet Propulsion Laboratory, National Aeronautics and Spa-ce, 2020
[69] Reimann S, Wegener R, Claude A, et al. Deliverable 3.17. Updated measurement guideline for NOx and VOCs [R/OL]. (2018–10–31) [2022–10–01]. https:// www.actris.net/sites/default/files/inline-files/WP3_D3. 17_M42_0.pdf
[70] Matthews R D, Sawyer R F, Schefer R W. Interferences in chemiluminescent measurement of nitric oxide and nitrogen dioxide emissions from combustion systems. Environmental Science & Technology, 1977, 11(12): 1092–1096
[71] Andersen S T, Carpenter L J, Nelson B S, et al. Long-term NOmeasurements in the remote marine tropical troposphere. Atmospheric Measurement Techniques, 2021, 14(4): 3071–3085
Precise Measurement and Numerical Correction of Atmospheric Nitrogen Oxides Based on Photolytic Chemiluminescence
LI Xuan, CHEN Shiyi†, LU Keding, ZENG Limin, ZHANG Yuanhang
State Joint Key Laboratory of Environmental Simulation and Pollution Control, State Environmental Protection Key Laboratory of Atmospheric Ozone Pollution Prevention and Control, College of Environmental Sciences and Engineering, Peking University, Beijing 100871; † Corresponding author, E-mail: chenshiyi@pku.edu.cn
In summer and winter of 2017, two self-developed blue light converter-photolytic chemiluminescence (BLC-PCL) NOxanalyzers and a traditional molybdenum-chemiluminescence (MCL) NOxanalyzer (Thermo 42i-TL) were applied for atmospheric NOxmonitoring. A performance comparison experiment for BLC-PCL and MCL NOxanalyzers was carried out during the observation period, and the numerical correction methods for possible interferences was discussed in detail. Results show that the two methods have stable measurement performance for NO (2=0.994, slope is 0.98). The measurement of NO2by MCL is 25%–30% higher than that of PCL. Notably, water vapor interference can cause the NOxsignals to be underestimated by 0.2%–13.2%; photochemical inter-ferences can lead to an underestimation of NO by 0–13.3% and an overestimation of NO2by 0–8.8%. These re- sults highlight the necessity of numerical correction of such interferences and the importance to carefully design related parameters such as photolysis efficiency, pipeline residence time, and pipeline humidity control.
atmospheric nitrogen oxides (NOx); chemiluminescence; precise measurement; numerical correction
猜你喜欢
云南化工(2021年9期)2021-12-21
煤气与热力(2021年10期)2021-12-02
中学生数理化·八年级物理人教版(2017年12期)2017-04-18
中国蔬菜(2016年8期)2017-01-15
分析测试学报(2015年8期)2016-01-13
分析测试学报(2015年6期)2016-01-13
少儿科学周刊·少年版(2015年1期)2015-07-07
现代检验医学杂志(2015年1期)2015-02-06
应用化工(2014年11期)2014-08-16
影像科学与光化学(2014年5期)2014-03-11