
Trust evaluation model of power terminal based on equipment portrait
2023-12-28 03:31ErxiaLiZilongHanChaoqunKangTaoYuYupengHuang
Global Energy Interconnection 2023年6期
Erxia Li,Zilong Han,Chaoqun Kang,Tao Yu,Yupeng Huang
1.Digital Grid Technology Center State Grid Shanghai Energy Interconnection Research Institute,Shanghai 201210,P.R.China
2.State Grid Shanghai Municipal Electric Power Company,Shanghai 200122,P.R.China
Abstract: As the number of power terminals continues to increase and their usage becomes more widespread,the security of power systems is under great threat.In response to the lack of effective trust evaluation methods for terminals,we propose a trust evaluation model based on equipment portraits for power terminals.First,we propose an exception evaluation method based on the network flow order and evaluate anomalous terminals by monitoring the external characteristics of network traffic.Second,we propose an exception evaluation method based on syntax and semantics.The key fields of each message are extracted,and the frequency of keywords in the message is statistically analyzed to obtain the keyword frequency and time-slot threshold for evaluating the status of the terminal.Thus,by combining the network flow order,syntax,and semantic analysis,an equipment portrait can be constructed to guarantee security of the power network terminals.We then propose a trust evaluation method based on an equipment portrait to calculate the trust values in real time.Finally,the experimental results of terminal anomaly detection show that the proposed model has a higher detection rate and lower false detection rate,as well as a higher real-time performance,which is more suitable for power terminals.
Keywords: Power terminal;Equipment portrait;Trust evaluation
0 Introduction
Security protection of power systems is based on the principles of security partitioning,dedicated networks,horizontal isolation,and vertical authentication [1].A defense system was established to effectively prevent network attacks from outside the power grid system [2].However,as attacks from within the system and latent attacks are more harmful,the security of the intranet and terminal must be strengthened [3].Many network attack events indicate that attackers invade terminals and go deeper into the system,eventually undermining the normal operation of the system and damaging facilities.For example,Iran’s nuclear system was invaded by Stuxnet in 2010,and denial-of-service attacks on terminals of the US Internet Service Provider (ISP)blocked network communication on the east coast in 2016 [4].Numerous security incidents indicate that an increasing number of attacks have been launched from terminals [5].Therefore,protecting terminal security is vital.
With the continuous development of smart grids,malicious attacks on the communication between terminals and master stations have emerged.Compared with master stations,power terminals are characterized by large numbers,wide ranges,outdoor operations,and easy access,which make them easy targets for attackers.Attackers can easily obtain large amounts of data by attacking terminals trusted by the master station,which affects the security of the entire smart grid.Therefore,it is necessary to establish a trust-evaluation mechanism for power terminals to ensure that the master station obtains the security status of the terminals in real time.
Because the power network is private,the flow data exchanged between the power terminal and master station are periodic and deterministic.The communication protocol of a power system is often a dedicated industrial control protocol [6].These protocols provide the data information and control commands of the communicating parties,including information related to but not limited to monitoring,identity,control,and message types.Most terminal exceptions are reflected in the protocols.Therefore,a large amount of communicated content can be easily obtained by analyzing these proprietary protocols,and an equipment portrait can be constructed from these contents to better represent the overall appearance of the terminal.The equipment portrait depicts the characteristics of the terminal through data features,turning the logical calculation of data into simple feature tags that reflect the network health status of the terminal through the equipment portrait [7].
To enhance the monitoring and evaluation of power terminal network security,here,a detailed study on the power terminal trust evaluation methods based on equipment portraits was conducted.Through the analysis of terminal exceptions based on the order of network flow and protocol depth analysis method,the proposed scheme realizes the monitoring,identification,and evaluation of terminal security status exceptions to ensure security access control of the master station to the terminal.
1 Review of Literature
1.1 Security protection of the power terminal
Terminal security protection in the power industry primarily focuses on encryption devices,security modules,and software models.Reference [8] proposed a scheme for a power-terminal security encryption device based on a neuralnetwork symmetric encryption algorithm that realized data encryption transmission using an external module scheme.In [9],a method to realize low-delay security protection of power terminals was proposed,addressing the serial port problems of large transmission delays and low transmission speeds between power terminals and encryption devices.In [10],a mathematical solution model was established using the reinforcement learning method;the analysis state was evaluated and the model was modified using historical data to improve the accuracy of the analysis and detection.In [11],a hierarchical control structure model of the Internet of Things (IoT)was built by optimizing the hierarchical structure of the power network and using a binary trusted security control model,which greatly improved the level of security protection of the system.
The credibility evaluation of terminals generally uses software models to synchronously monitor system operation.Once a virus is detected,the monitoring program removes or blocks access to the virus program object.Most existing research is based on the deep learning method.The evaluation model is trained to conduct real-time monitoring.A security monitoring and evaluation model for IoT terminals based on cluster analysis was proposed in [12].Combining expert knowledge and the expert's judgment of the threat level of the supervisor as a priori information,the validity and rationality of the simulation verifier model were finally verified;however,the efficiency of the method combining expert knowledge was far from satisfactory.Reference [13] proposed a security evaluation system for IoT terminals that could monitor protocol vulnerabilities;the IoT terminals could perform their own reinforcement and status detection functions.Although this system can monitor IoT terminals,it is unsuitable for power terminals.
Existing trust evaluation technologies cannot be simply applied to the security protection of power terminals.The power system is generally located in an internal private network,which has the characteristics of fixed equipment acquisition points,fixed applications,and fixed users.Therefore,it is necessary to further evaluate power terminals with basic trust based on a portrait of the equipment using the network flow and proprietary protocols of power terminals.
1.2 Equipment portrait
An equipment portrait characterizes terminals using data tagging and several representative features.The key aspect of an equipment portrait is the definition of tags,which are typically used to convert logical calculations of data into more understandable feature tags.The design of an equipment portrait requires relevant information about the equipment,such as basic attributes,access behavior,and related data.The larger the range of data involved,the better is the equipment portrait,because it can represent the overall appearance of the equipment.An equipment portrait can be defined using the following three steps:First,we obtained the terminal information and then established the equipment portrait by referring to the defense target and data characteristics of the service.The second step involved processing the terminal data using various experimental methods and models to obtain multidimensional digital labels of the equipment.
Reference [14] used operational behavior and user information to build a portrait to solve the problem of terminal data search,effectively improving the search speed of user terminals.However,they did not use portraits to conduct detailed security detection.Reference [15] used the update process of the power grid alarm data as a dynamic portrait of the failure of the power grid system terminal.The modified analysis method can locate terminal failures and predict the probability distribution of the power-grid alarm frequency at a high speed.Reference [16] proposed a network anomaly detection method for power IoT terminals based on equipment fingerprints that can effectively detect abnormal network behavior.
It can be observed that building an equipment portrait can effectively detect abnormalities and evaluate the trust of terminals.To build a complete equipment portrait system for a power system,it is necessary to consider feasible solutions from multiple perspectives,such as the terminal security authentication status and flow data.
2 Trust Evaluation Model Based on Equipment portrait
The scheme proposed in this study analyzes proprietary power protocols and builds an equipment portrait of the power terminal based on flow characteristics,as shown in Fig.1.First,the network traffic is preprocessed to extract the order of network flow,including the IP address,traffic type,message length,message time-slot,and message direction.The order is divided using a clustering algorithm,and an equipment portrait is built based on the basic traffic characteristics.Next,the protocol data segments are processed using message blocking,synchronous parsing,and keyword frequency analyses.Protocol fields are judged grammatically if they exceed protocol requirements.High-frequency keywords and content of the protocol are semantically extracted to build an equipment portrait of the terminal.Finally,an equipment portrait is constructed by combining the network flow order,syntax keyword,and semantic keyword features,and the threshold of each feature is determined experimentally to determine whether the terminal is abnormal.
2.1 Traffic exception evaluation method based on network flow order
First,the proposed scheme collects basic attribute information of the network traffic and obtains the network flow order vector.Message clustering technology was adopted through a network flow order to complete the extraction of normal characteristics.It mainly considers the IP,quantity,time-slot,direction,and total length of the network messages.The data part is not considered;therefore,it can also be used for the transmission of data-segmentencrypted messages.This process is illustrated in Fig.2.

Fig.2 Power terminal monitoring method based on network flow order
2.1.1 Construction of network flow order
The header information of the message required to construct the network flow order includes the IP address,protocol type,message length,message time-slot,and message direction.The IP addresses include the source and destination IP.The message size refers to the total length of the message,the message time lot refers to the difference between the time-slots of two adjacent messages,and the message direction refers to the acceptance or transmission at the terminal.These five pieces of message-header information form the network flow order.The collected message header information is further analyzed to obtain the network flow order vector,as shown in the Fig.3.

Fig.3 Construction of Network Flow Order
2.1.2 Exception evaluation method
This scheme extracts a whitelist of characteristic words based on the network flow order vector using a message clustering method.The implementation process is as follows.
(1)Data preprocessing
To extract message information in the network flow order,the destination IP is represented byf1,protocol type byf2,message size byf3,message time-slot byf4,and message direction byf5.As most of the power IoT uses intranet communication,the IP address is directly taken as the last eight bits,and the message time-slot is obtained by subtracting the current message time from the time of the last adjacent message,which is represented as 1 for receiving and 2 for sending.Subsequently,each message is divided into words using an expert voting algorithm.
To use the message-clustering method,a set of three tuples representing the network flow-order vector must be defined.
where setSis the set of data to be processed,that is,the set of messages.Pis the set of the attributesf1in the network flow order.Vis the set of the specific value in the attributefi.
(2)Classify by attribute
For a certain attributePiin messages,if the value ofViis the same,these messages are divided into the same cluster.Then classify the attributes in the network flow order separately to form preliminary clustering results.
Because of the stability of equipment communication in the power system,some clustering results may not meet the reference conditions for message clustering.Therefore,the clustering results require further filtering to be more accurate.Specifically,by counting the number of occurrences of each setViand dividing it by the total number of messages,the proportion of attribute values to the number of messages is obtained.If the proportion is higher than 0.05 (this value can be dynamically adjusted according to the expert system),it indicates that the attribute is representative and suitable as a feature for equipment portrait.On the contrary,if the proportion is below the threshold,filter out the attribute.
(3)Feature word extraction
The feature words are sorted in descending order of the number of setsVi,and each messageS i(S i∈Vi)in the setViis intersected to obtain the feature word set until all the feature word collections are aboutfi.We then created a whitelist of network flow orders based on a set of feature words.During security monitoring,the header information of the message is matched to the set in the whitelist of the network flow order;if it is not included in the set,it is judged as an exception.
2.2 Traffic Exception Evaluation Method Based on Protocol Resolution
The method of detecting abnormalities in power distribution terminals based on protocol parsing involves detecting abnormalities in message data segments by extracting them according to syntax and semantics.For syntax detection,a synchronous parsing method with a data segment is designed to achieve fast positioning of keywords to increase parsing speed.After identifying the key field,it is matched with the whitelist.If it is not on the whitelist,the syntax is considered abnormal.For semantic detection,the number of occurrences of each keyword in the total data messages during a certain period and the time difference between the occurrences of two adjacent keywords that are different were counted to obtain the threshold value of the keyword frequency.Thus,anomaly monitoring was achieved by monitoring the keyword characteristics of the terminals.The detailed implementation method is shown in Fig.4.

Fig.4 Power terminal traffic exception evaluation method based on protocol resolution
In the process of actual network terminal service interaction,the IEC60870-5-104 protocol provides a communication statute between the terminals of the power system,and this protocol can better ensure communication trustworthiness.Therefore,we selected the IEC60870-5-104 protocol as the target for terminal protocol parsing and extracted feature words as keywords for identification and monitoring.
The application protocol data unit of the application layer of IEC60870-5-104 protocol is composed of APCI (Application Protocol Control Information)and ASDU (Application Service Data Unit),and its protocol format is shown in Fig.5.
The application protocol data unit (APDU)is the maximum transfer unit of the IEC60870-5-104 protocol.The APDU fields consist of application protocol control information (APCI)and an application service data unit (ASDU).The control field octet group of the APCI can be divided into three groups with three formats.These are the I-format for data transmission,the S-format for monitoring,and the U-format for control.ASDU has many types of identification,but only three are detected most frequently.These are M_ME_TF_1,M_ME_NC_1,and M_ME_NA_1;the above 3 types indicate that the 104 packets contain the measured value.However,M_ME_TF_1 indicates that the value is a short float with a CP56Time2a tag,whereas the other two types are pure short float and normalization value.
2.2.1 Syntax anomaly detection
The synchronous parsing method for data segment cutting is shown in Fig.6.Because there is a fixed keyword segment location in the IEC60870-5-104 protocol,we can quickly locate the location of the keyword segment in the packet,cut into multiple read nodes,and synchronously parse keyword segments A,B,and C in the message.The use of the synchronous parsing method can accelerate keyword recognition.

Fig.5 IEC 60870-5-104 protocol

Fig.6 Synchronous parsing with known keywords
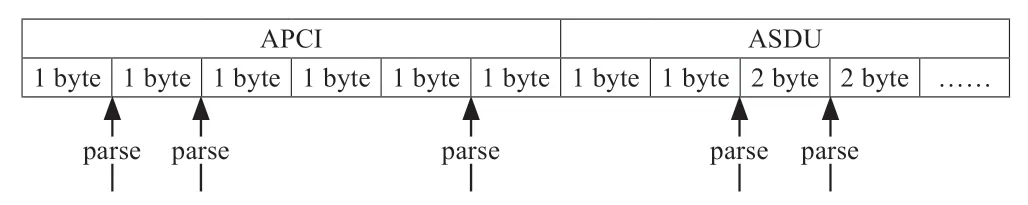
Fig.7 Synchronous parsing with known keywords
When the protocol is processed for synchronous parsing,if the keyword position is known first,multiple cutoff points are set to quickly read the corresponding keyword content according to the number of keywords.For the IEC 60870-5-104 protocol,we set the following cut points:one cut point after the 1st byte,the 1st byte keyword content indicating the start character,which is generally fixed at 0x68.Cutoff points were set before the 3rd byte and after the 6th byte,which corresponded to the content of the control field used to mark the message type.The keyword content of the 7th byte is a type identifier that identifies the data type of the message as follows:A cutoff point is set before the 11th byte,and the keyword content corresponding to the 11th and 12th bytes indicates the public address of the application service data unit,as shown in Fig.7.
After the keyword segment is recognized,it is matched with the whitelist of the keyword segment;if it is not in the whitelist,the syntax is considered abnormal.
If the location of keywords is uncertain and the content of the data segments is large during the syntax parsing of other protocols,the problem of fast positioning of keywords must be solved to achieve synchronous parsing of the data segments.Therefore,the data segment of the message is processed into blocks,(n-1)scan points are inserted according to the actual requirement,and each data block is parsed.The parsed data are matched with the keywords,and synchronous parsing for the unknown keyword location when the location is unknown is finally completed,as shown in the Fig.8.
After parsing the keywords in different situations according to the above two conditions,the known keywords and field content of the protocol are matched through a priori knowledge.If a location field or unknown data appears,the protocol message is considered to have a syntax exception.The matching whitelist can then be adjusted based on the update.
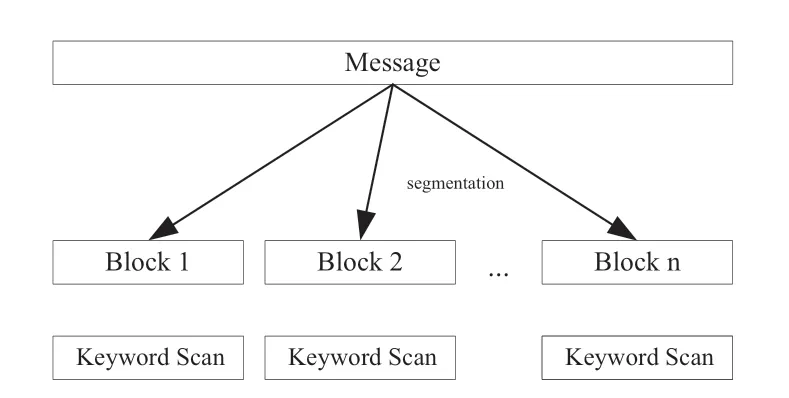
Fig.8 Synchronous parsing with unknown keywords
2.2.2 Semantic anomaly detection
The process illustrated in Section 2.2.1 is simple and efficient for exception detection at the syntax level of the protocol.However,attackers can execute malicious attacks using normal protocols and cannot find exceptions at the protocol syntax level.Therefore,a more detailed anomaly detection at the protocol semantics level is required.However,the operational logic of the protocol is complex,and different protocols have different designs.Terminal communication is usually divided into control messages and information messages.Based on the characteristics of device stability,some fields appear frequently in message communication,which can be considered as the characteristics in the data transmission of the message,that is,key fields.The statistics of the proposed scheme includes the number of times it is used by the key fields of all protocol messages and the correlation between adjacent fields,constructing the communication characteristics of the protocol information,and designing ideas as follows:
Step 1:By collecting the traffic data for normal terminal communication,converting it into natural language,and counting the numberxiof repetitive fields in its data segment,the frequencyfiof each keyword can be determined by calculating the ratio ofxito the total messageT.The formula used is as follows:
For example,in the identification of IEC60870-5-104 protocol data,the recurring keywords in APCI type are:I-format,S-format,U-format,and the three most recurring keywords in ASDU type are:M_ME_TF_1,M_ME_NC_1,M_ME_NA_1,and we calculate the frequency of each keyword using equation (1).
Step 2:The time difference between the first appearances of different adjacent keywords was calculated;the maximum time difference was taken as the maximum response time,and the minimum value was the fastest response time.
Step 3:Based on the above three data values,the semantic keyword characteristics of the protocol are obtained.According to the actual running state,fiis recorded and the window range ofT,that is,the farthest recording point is set.A fewfiwith higher frequency are selected to form the semantic portrait of the terminal.Whenfideviates significantly from the current data,or when the keywords exceed the normal time range,the terminal is considered to be in an abnormal state.
2.3 Trust Evaluation Method Based on Equipment portrait
A terminal equipment portrait comprises three aspects:terminal network traffic features,semantic keyword features,and syntactic keyword features.Owing to the fixed business logic of terminals,the traffic data generated during the access process exhibit periodicity and stability.Therefore,a terminal security baseline is established based on the equipment portrait.The terminal trust value is calculated based on a comprehensive evaluation model by monitoring the deviation of the real-time interaction behavior and the security baseline.Different trust-value ranges correspond to different security levels.When the trust value of the terminal is lower than a certain threshold,an alarm is generated,thus realizing the continuous trust evaluation and security monitoring of the terminal.
The terminal trust evaluation method proposed in this study first extracts feature information from real-time network traffic features,semantic keyword features,and syntactic keyword features of the terminal and constitutes a set of trust evaluation impact factors by comparing the degree of deviation of real-time features of the terminal from the features in the security baseline,such as the degree of deviation of packet size and packet number,the degree of deviation of source IP and destination IP in traffic features,and the degree of deviation of semantic and syntactic keyword features.
Second,the evaluation set is determined based on a terminal security protection strategy,and a terminal evaluation model is established to calculate the realtime trust value.This trust value is then combined with the weighted terminal-based trust value to obtain a comprehensive trust value of the terminal.The process used to calculate the trust value is shown in Fig.9.
(1)Establishment of the impact factor set
The set of impact factors includes those that can cause changes in the trust value of the terminal,expressed asU={TFD,SFD,GFD},whereTFD,GFD,andSFDindicate the degrees of deviation of the traffic features,syntactic keyword features,and semantic keyword features.The method of calculation o feature deviation is as follows:

Fig.9 Process of trust value calculation
1)TFDincludes the degrees of deviation in packet sizes,packet counts,source and destination IP,and MAC addresses.The set ofTFDcan be expressed as {TFD1,TFD2,TFD3,...,TFDi},which is calculated as follows:
wherePTFDiindicates the weight value assigned to the corresponding feature.xindicates the average value in the terminal security baseline ofTFD,andεindicates the standard deviation in the terminal security baseline ofTFD.
2)GFDincludes the degree of deviation in the position and the content of the key fields in the message.TheGFDset can be expressed as {GFD1,GFD2,...,GFDi} and the formula for calculation is as follows:
where,PGFDiindicates the weight value assigned to the corresponding feature.xindicates the average value in the terminal security baseline ofGFD.εindicates the standard deviation in the terminal security baseline ofGFD.
SFDcould include the degrees of deviation,in keyword frequency,time-slots of keywords,and keyword combination frequency in the message.TheSFDset can be expressed as {SFD1,SFD2,...,SFDi} and is calculated as follows:
wherePSFDidenotes the weight value assigned to the corresponding feature.xdenotes the average value in the terminal security baseline ofSFD,andεindicates the standard deviation in the terminal security baseline ofSFD.
(2)Establishment of the evaluation set
The trust evaluation module evaluates each impact factor and obtains a score,which can be expressed as (takingTFDas an example):STFD={STFD1,STFD2,STFD3,STFD4,...,STFDi}.The evaluation set consists of different evaluation levels corresponding to different scores and can be expressed asF={Untrusted terminal,Suspicious terminal,Trusted terminal},as shown in Table 1.Therefore,different trust value ranges can correspond to evaluation levels in the set ofF,which can be expressed asSTFD∈F.The specific threshold division here is discussed in Section 4.1.

Table 1 Evaluation level corresponding to the trust value
(3)Establishment the evaluation matrix
The affiliation of the ith element in the impact factor setUwith the first element in the evaluation setFis denoted asei1.The evaluation result of the ith element is denoted by the fuzzy setei={ei1,ei2,…,ein}.The fuzzy set of m impact factors constitutes the evaluation matrixEm n*indicates a fuzzy relationship between the set of impact factorsUand evaluation setFand is expressed as follows:
(4)Determination of the weight set of impact factors
The importance of each impact factor is different in the evaluation process;therefore,relevant algorithms are used to determine the corresponding weight set for each impact factor,and the set of weights is expressed asW={w1,w2,…,wn}.We obtained the weight based on the Analytic Hierarchy Process (AHP)method using the SPSS AU data scientific analysis platform.
(5)Determination of the evaluation model
After determining the evaluation matrixEm*nand the weight vector of impact factorsW,the vectorWon the impact factor setUis transformed to a fuzzy vectorXon the setVby the fuzzy change,which can be expressed as:X=W1*m*Em*n={x1,x2,…,xn}.
(6)Obtaining the terminal evaluation trust values
After the comprehensive evaluation model is determined,the evaluation trust value of the terminal is calculated using the following formula:
where,Sindicates the trust value corresponding to the impact factors in the setU.Vindicates the final comprehensive evaluation of the trust value of the terminal.
(7)Calculation of comprehensive trust
If it is the first trust evaluation of the terminal,a base trust value of 0.8 is set for the terminal.The base trust value for the terminal is then calculated using the following Bayesian formula:
wherein,T0indicates the base trust value of the terminal;Yindicates the number of normal access visits to the terminal;andNindicates the number of historical abnormal access visits to the terminal.
The formula for calculating the comprehensive trust value is as follows:
whereαindicates the weight,T0is the base trust value of the terminal,andVis the trust value after comprehensive fuzzy evaluation.
3 Experiment and Analysis
3.1 Model Simulation
To verify the effectiveness of the proposed model in practical applications,two servers were utilized to construct a simulated environment for the terminal and master stations.The server operating system is Centos7_x64,and the configuration is Intel®Xeon CPU E3-1230 V3@3.40GHz.The proposed trust evaluation model was integrated into a trust evaluation module deployed on a secure access gateway.Semantic and syntactic analyses were performed using self-developed protocol parsing software.The business interaction process between the terminal and master stations was simulated in this environment.
We chose a public dataset [17],which consisted of normal and attacking traffic data captured from 28 terminal devices.Different protocol data packets,flow rates,and transmit ports between the normal and attack flow data were compared to construct an equipment portrait.In subsequent experiments,we set the time-slot to 12 h.The experiment was conducted from two aspects:network flow order and syntax and semantics.
For the network flow order,we used a Python script,particularly data plane development kit,to analyze the normal data packets and the attacking datasets.Considering the actual power network environment,we selected the target of the network flow order analysis as the IEC60870-5-104 data packets.The analysis mainly focused on the total size and number of 104 data packets.Some exceptions were detected in the analysis of the number and size of the data packets,which can narrow the search range for malicious attacks.Fig.10 shows the total number and size of data packets corresponding to normal traffic and attacking traffic,that we collected during the same time-slot.As shown in Fig.10,the peak values of the total size and number of data packets have an obvious difference.The peak values of the number of normal and attacking traffic data were 800 and 10,000 bytes,respectively,whereas the total size was 100,000 bytes and 7,000,000 bytes,respectively.The number and total size of the normal data packets were uniformly distributed.The distribution was approximately 500 bytes,and the total size was approximately 120,000 bytes.By contrast,we find almost the same results for the number and size of data packets in the dataset,with some exceptions.However,this can be considered an exception when there are peak values of more than 10,000 packets and 6,000,000 bytes.This indicates that flooding or other similar attacks may have occurred in our network.
In addition to the number and total size of IEC60870-5-104 data packets,the source and destination IPs are considered significant features for confirming whether traffic has been attacked.The bar charts in Figs.11 and 12 show the number of traffic records for different source and destination IPs in normal and attack traffic.The black curve represents the growth rate of the proportion of IP traffic records relative to the total number of records.Any point on the curve represents the proportion of traffic records for all previous IPs to the total.In normal traffic,the peak value appears at the device whose IP is 192.168.1.192,the traffic records of the source IP and destination IP are 140,000 and 120,000,respectively.However,in attack traffic,these two values are 240,000 and 210,000,respectively.In addition,the most active terminal in the attacking traffic,whose IP is 192.168.1.165,is not even on the list of the top 20 active devices in normal traffic,which means that this terminal may be under attack.

Fig.11 Distribution of source IP traffic

Fig.12 Distribution of the destination IP traffic
We then determine whether the binding between the MAC and IP addresses changes as a characteristic of endpoint security monitoring.At the data link layer,we chose ARP to analyze the packets.The analysis focused on identifying each MAC and IP address,and binding them to create an ARP list buffer.The changes in the ARP list buffer were monitored every 60 s.From the results shown in Fig.13,we found that in the normal dataset,the MAC and IP address bindings did not change,whereas in the attack dataset,one MAC address was bound to five IP addresses.This MAC is a suspicious device that may be the victim of an ARP spoofing attack.
Next we conducted experiments for the semantic and syntactic analysis of 104 protocol packets.
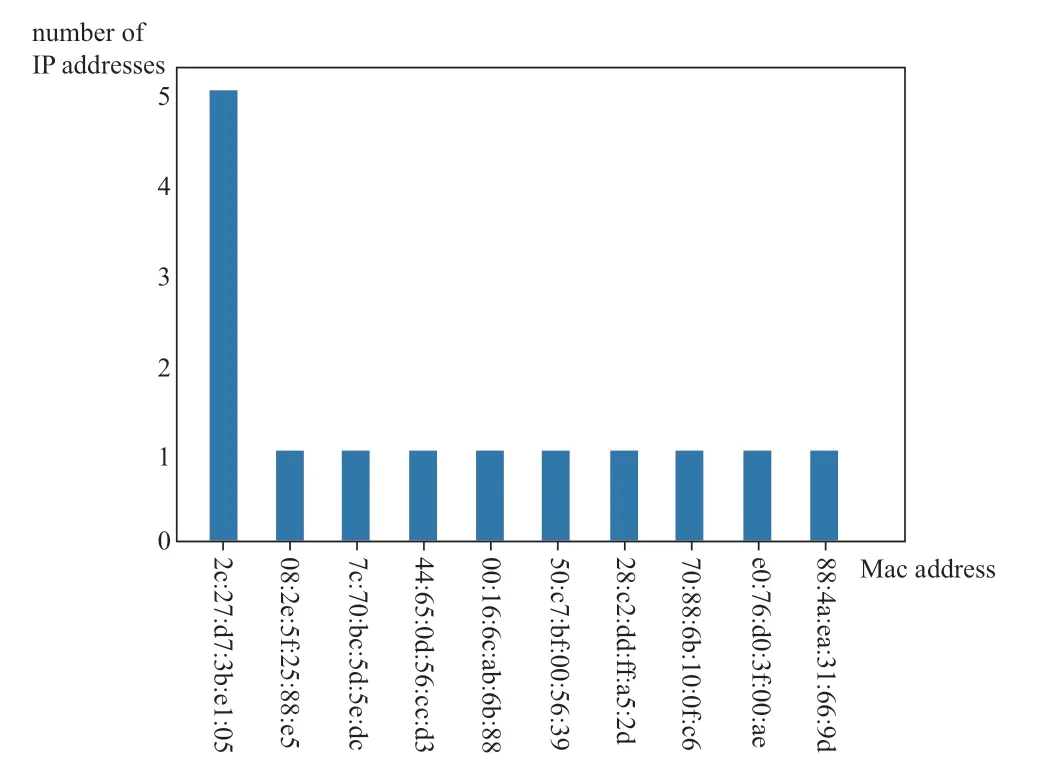
Fig.13 ARP list buffer
We parsed the 104 data packets and executed data segmentation on APCI and ASDU.By collecting data from the control field octet group,we obtained the distribution of the APCI format type,as shown in Fig.14.From the results,we know that I-Format contributes approximately 83.50% of the 104 normal data packets,whereas S-Format and U-Format messages contributed 12% and 4.50%,respectively.We use this distribution as a feature to evaluate a terminal’s trust level.
In addition to the distribution of the APCI format type,we analyzed the distribution of the ASDU type identification.We ignored the types that account for less than 1% and mainly analyzed the top three types.The results are shown in Fig.14.The figure shows that the type with the highest proportion is M_ME_TF_1.This accounted for 65.13%,whereas M_ME_NC_1 and M_ME_NA_1 contributed 31.69% and 2.69%,respectively.We also considered this distribution as a feature for evaluating the trust level of the terminal.

Fig.14 Distribution of APCI format type (left)and main ASDU type identification (right)
Based on the above experiments and analysis,we set 12 h as the time period and evaluated trust in network traffic for five time periods.After several experiments,we selected the total number and size of packets,the binding between the MAC and IP of the device,the frequency of I-Format and the frequency of M_ME_TF_1 as the features describing the equipment portrait of the terminal.Based on this,we performed real-time trust evaluation on the terminal,and the detailed trust evaluation results are shown in Table 2.

Table 2 Results of terminal trust evaluation
Based on the above experiments,we analyzed the results of the normal distribution range and established a baseline for terminal evaluation.The default trust level of the terminal is 1,the total size of 104 packets is 120,000 bytes,there are 500 packets in a single time-slot,and the MAC address of the terminal is bound to the IP address 192.168.1.224.83.5 Of the 104 packets,83.5% belonged to the I-Format,whereas M_ME_TF_1 accounted for 65% of all 104 packets.After analyzing these characteristics,our evaluation model output a trust score between 0 and 1.The trust values corresponding to the upper and lower bounds of acceptable deviations in each feature of the terminal were calculated through multiple experiments to derive the threshold values for distinguishing the trust levels.Terminals with scores between 0.85 and 1 can be judged as trusted terminals,while those with scores between 0.6 and 0.85,and between 0 and 0.6 were judged as suspicious and untrustworthy terminals,respectively.Therefore,our evaluation model outputs a trust value between zero and one by evaluating each feature of the compared terminals.
We simulated Terminal A and artificially expanded the size of the transmitted 104 data packets to 121,000 bytes and the number of 104 data packets to 550.This is slightly larger than the normal size.Until the end of the time-slot,Terminal A did not bind its MAC to any other IP address.We also parsed 104 data packets and executed data segmentation for APCI and ASDU.We found that I-Format and M_ME_TF_1 contributed 86% and 60% of the 104 data packets,respectively,which were close to the normal distribution range.The small increase in the total number and size of the 104 data packets was within an acceptable range.Based on the formula in the trust evaluation method proposed in Section 3.3,the trust value of Terminal A was calculated as 0.95,which was judged as a trusted terminal.
We also simulated Terminal B and changed the binding between the MAC and IP addresses five times.From the results,we observed that both the total size and number of packets (104)were similar to the normal distribution range.However,the binding between the MAC and IP addresses changed five times in one time-slot.Multiple changes in the binding between the MAC and IP indicate that the terminal may have been tampered with.Based on the formula in the trust evaluation method proposed in Section 3.3,the trust value of terminal B was calculated to be 0.23 and B was no longer to be trusted.
During the evaluation of Terminal C,the frequency of the U-Format was much higher than the normal distribution range,and the remaining features were close to the normal distribution range.This implies that someone may have attempted to send external control commands to a network system.The frequency of M_ME_TF_1 was much lower than that of the normal distribution range.Based on the formula in the trust evaluation method proposed in Section 3.3,the trust value of C is 0.64,which indicates a suspicious terminal.
Terminal D successfully passed syntax and semantic evaluations.The binding of its MAC and IP addresses did not change,but the total size and number of the 104 packets were 8000 and 6,303,247,respectively,which is far higher than the normal distribution range and clearly not a temporary small increase.Based on the formula for the trust evaluation method proposed in Section 3.3,the trust value of is 0.38 and terminal D can be judged as an untrusted terminal.
Because the power network is private,the business logic between the power terminals and master station is deterministic,and the network traffic data are periodic and deterministic.When a terminal is attacked or compromised,its network behavior exhibits anomalous changes.Therefore,the abnormal detection of a terminal can be achieved by establishing an equipment portrait for power terminals and constructing a security baseline.The model proposed in this study is for real-time security monitoring and trust assessment of terminals.For large attacks against terminals,such as death ping and ARP spoofing attacks,the terminal features exhibit obvious anomalous changes.The model can quickly detect changes and adjust trust values based on the corresponding weights.The terminal is marked as suspicious or untrusted,and an alarm is issued to notify the relevant modules for processing.For slow or small attack types targeted at terminals,a model based on equipment portraits monitors various characteristics of the terminals in real time.If some characteristics exhibit small fluctuations,it will cause a small change in the trust value.If the fluctuations continue over a period of time,the trust value will decrease significantly,thus detecting anomalies and issuing an alarm to notify the relevant modules and determine whether the terminal has abnormalities.
3.2 Experiment and Analysis
To facilitate a comparison with existing terminal anomaly detection schemes,this section uses the detection and false detection rates,which are important indicators for measuring the effectiveness of the application of detection methods for terminal anomalies,to evaluate the performance of the model.The evaluation metrics were as follows:
• Detection rate=number of terminal anomalies detected in the model/number of anomalous samples.
• False detection rate=number of terminal anomalydetection errors/number of anomalies detected.
To test the detection rate of the model,the dataset was divided into eight groups,and each group was tested ten times.The experimental results are the averages of the complete set of tests for each group.
To enhance the comparability of the experiments and avoid overly single experimental results,we selected Schemes 1 [18] and 2 [19] to compare and analyze the proposed scheme using the same dataset in the power system scenario.The comparative experimental results are as follows.
(1)Comparison and analysis of experimental results for terminal anomaly detection rate.

Fig.15 Results of terminal abnormality detection rate for three schemes
Fig.15 shows that the terminal anomaly detection rate of the model proposed in this study is 93% on average,which is relatively stable among the eight groups of data,whereas the detection rates of Schemes 1 and 2 are applied less effectively,and the detection rates are different in different groups.
Comparison and analysis of experimental results of terminal anomaly false detection rate.

Fig.16 Results of terminal abnormality false detection rate for three schemes
The proposed scheme has relatively small advantages in detection rate compared to the other two schemes,but its false detection rate is significantly lower than the other two schemes,as shown in Fig.16.The false detection rate of the proposed scheme is as low as 5%,while the false detection rates of Schemes 1 and 2 fluctuate greatly and are significantly higher than 5%.Therefore,it can be observed that the proposed scheme has better application effects than the other two schemes in the experiment.
(2)Real-time analysis of model detection analysis
To comprehensively analyze the effect of application of the proposed method and confirm its effectiveness in solving the current problems of terminal anomaly detection,a realtime analysis of the anomaly detection of different schemes was conducted.Two sets of data were selected as the test group to analyze the relationship between the detection of different data volumes and the running times of the different schemes.The experimental results are listed in Table 3.
As can be observed from the table,with the same number of data,the proposed scheme can complete detection in the shortest time and obtain the corresponding detection results.Compared with the proposed scheme,the detection times of the other two schemes were relatively long.Experimental results show that the proposed scheme is more real-time than the other two schemes.By integrating and analyzing the experimental results with the two sets of experimental results above,it was found that the detectioncapability and applicability of the proposed scheme are stronger than those of the other two schemes.

Table 3 Real-time comparison of the three scheme
4 Conclusions
This study constructs equipment portraits from the features of network flow,syntax and semantics,and the access behavior of power terminals.For the network flow feature,we proposed an exception monitoring method based on the network flow order.We collected the base attributes of the protocol packets from a normal network flow and preprocessed them into triple layer form.By extracting keywords,a whitelist of the network flow features can be obtained.We propose an anomaly detection method based on protocol parsing for the syntax and semantics of protocol packets.By constructing a protocol keyword whitelist and using protocol segmentation to realize protocol parallel parsing,the key field location is quickly located,and syntax anomaly detection is realized.For the feature of access behavior,we analyzed the data packets,obtained the baseline of the key features of access behavior,and improved the detection efficiency of anomalies and different network behaviors in the power system.
The trust evaluation method in this study is currently only applicable to terminals in the distribution power IoT.Due to its fixed business behavior,we can analyze the semantics and syntax of distribution communication protocols based on normal traffic,extract features and then construct equipment portraits,and monitor terminal anomalies.For terminals with unstable business behavior,it is not possible to determine anomalies only by depicting equipment with normal traffic.
In future work,we will focus on processing redundant data and designing a lightweight data analysis scheme because of the need to collect and analyze mass data in equipment portrait construction to realize security monitoring of different kinds of power terminals.
Acknowledgements
This study was supported by the National Key Research and Development Program of China (No.2021YFB2401 200).
Declaration of Competing Interest
The authors have no conflicts of interest to declare.
 Global Energy Interconnection2023年6期
- Global Energy Interconnection的其它文章
- Over-limit risk assessment method of integrated energy system considering source-load correlation
- Optimal dispatch approach for rural multi-energy supply systems considering virtual energy storage
- Federated double DQN based multi-energy microgrid energy management strategy considering carbon emissions
- Coordinated planning for flexible interconnection and energy storage system in low-voltage distribution networks to improve the accommodation capacity of photovoltaic
- Layered power scheduling optimization of PV hydrogen production system considering performance attenuation of PEMEL
- Application of four machine-learning methods to predict short-horizon wind energy