China's Im port and Export w ith M ajor European Countries during June 2010
2010-05-26 03:25
世界制造技术与装备市场 2010年5期
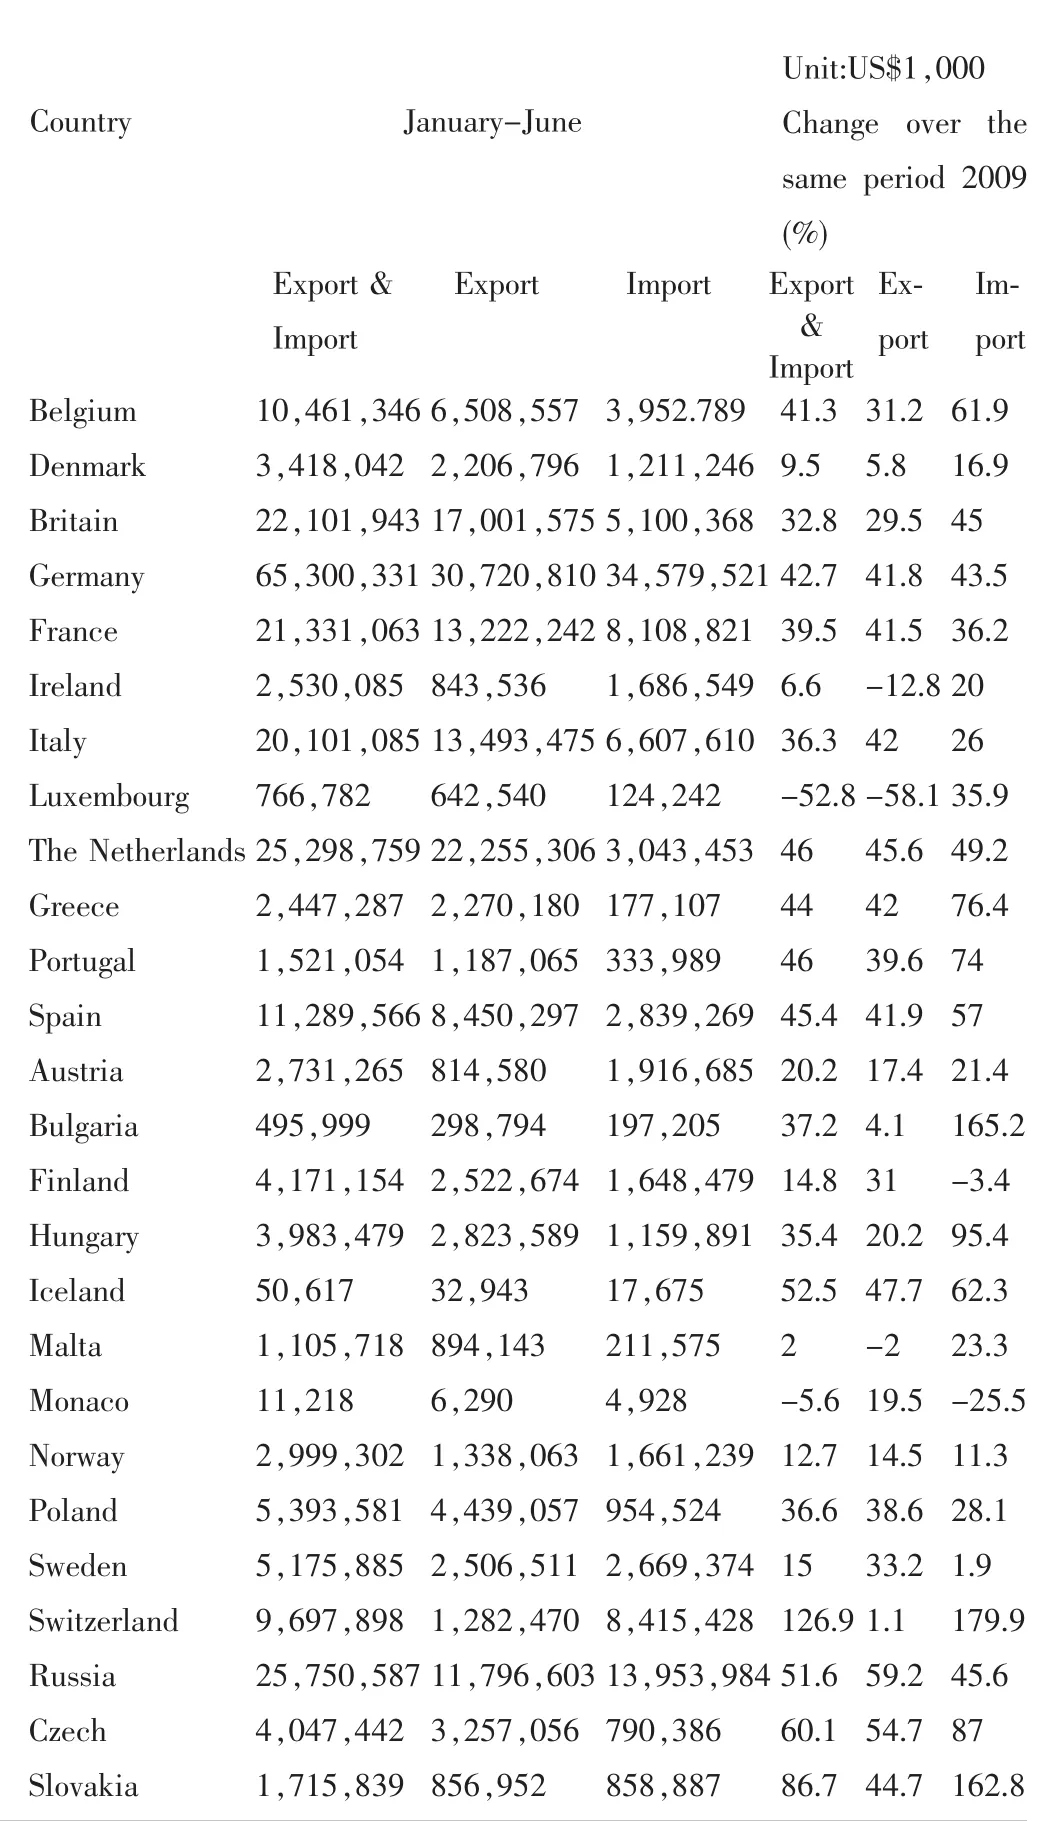
Country January-June Unit:US$1,000 Change over the same period 2009(%)Export&Import Export Export Import Export&Import Import Belgium Denmark Britain Germany France Ireland Italy Luxembourg The Netherlands Greece Portugal Spain Austria Bulgaria Finland Hungary Iceland Malta Monaco Norway Poland Sweden Switzerland Russia Czech Slovakia 10,461,346 3,418,042 22,101,943 65,300,331 21,331,063 2,530,085 20,101,085 766,782 25,298,759 2,447,287 1,521,054 11,289,566 2,731,265 495,999 4,171,154 3,983,479 50,617 1,105,718 11,218 2,999,302 5,393,581 5,175,885 9,697,898 25,750,587 4,047,442 1,715,839 6,508,557 2,206,796 17,001,575 30,720,810 13,222,242 843,536 13,493,475 642,540 22,255,306 2,270,180 1,187,065 8,450,297 814,580 298,794 2,522,674 2,823,589 32,943 894,143 6,290 1,338,063 4,439,057 2,506,511 1,282,470 11,796,603 3,257,056 856,952 3,952.789 1,211,246 5,100,368 34,579,521 8,108,821 1,686,549 6,607,610 124,242 3,043,453 177,107 333,989 2,839,269 1,916,685 197,205 1,648,479 1,159,891 17,675 211,575 4,928 1,661,239 954,524 2,669,374 8,415,428 13,953,984 790,386 858,887 41.3 9.5 32.8 42.7 39.5 6.6 36.3-52.8 46 44 46 45.4 20.2 37.2 14.8 35.4 52.5 2-5.6 12.7 36.6 15 126.9 51.6 60.1 86.7 31.2 5.8 29.5 41.8 41.5-12.8 42-58.1 45.6 42 39.6 41.9 17.4 4.1 31 20.2 47.7-2 19.5 14.5 38.6 33.2 1.1 59.2 54.7 44.7 61.9 16.9 45 43.5 36.2 20 26 35.9 49.2 76.4 74 57 21.4 165.2-3.4 95.4 62.3 23.3-25.5 11.3 28.1 1.9 179.9 45.6 87 162.8