
SENSITIVITY STUDY OF THE EFFECTS OF WAVE-INDUCED VERTICAL MIXING ON VERTICAL EXCHANGE PROCESSES*
2010-07-02 01:37LIANGBingchen
水动力学研究与进展 B辑 2010年3期
LIANG Bing-chen
Key Laboratory of Ocean Engineering, Shandong Province, Ocean University of China, Qingdao 266100, China, E-mail: bingchenliang@yahoo.com.cn
LEE Dong-yong
Coastal and Harbour Engineering Research Center, Korea Ocean Research and Development Institute, Ansan, Korea
LI Hua-jun, ZHANG Jing
College of Engineering, Ocean University of China, Qingdao 266100, China
SENSITIVITY STUDY OF THE EFFECTS OF WAVE-INDUCED VERTICAL MIXING ON VERTICAL EXCHANGE PROCESSES*
LIANG Bing-chen
Key Laboratory of Ocean Engineering, Shandong Province, Ocean University of China, Qingdao 266100, China, E-mail: bingchenliang@yahoo.com.cn
LEE Dong-yong
Coastal and Harbour Engineering Research Center, Korea Ocean Research and Development Institute, Ansan, Korea
LI Hua-jun, ZHANG Jing
College of Engineering, Ocean University of China, Qingdao 266100, China
The hydrodynamic model COHERENS-SED, developed by the present authors through introducing wave-enhanced bottom stress, wave dependent surface drag coefficient, wave-induced surface mixing, SWAN to COHERENS, is modified to account for wave-induced vertical mixing. The COHERENS-SED model can also be used for one-dimensional, two-dimensional, three-dimensional current and salinity calculations. One-dimensional model and three-dimensional model are used to study the effects of the wave-induced vertical mixing. The horizontal current velocity profiles obtained by the model are in good agreement with the analytical velocity profiles under the same input conditions. Numerical results show that higher wave height would generally generate larger vertical eddy viscosity and lower horizontal velocity. The results for fresh water in Yellow River Delta show that the wave-induced vertical mixing increases the momentum of fresh water transferring ability downwards to seabed and salt water’s mixing with upper fresh water. Fresh water flume length is compressed considerably.
Yellow River Delta, COHERENS, SWAN, COHERENS-SED, wave-induced vertical mixing
1. Introduction
It is well known that the wave can significantly affect the circulation and mixing, as witnessed by many studies. But wave-induced vertical mixing remains not well understood. Most of the widely used three-dimensional models assume wave independentvertical mixing coefficients in simulating the coastal circulation[1-6]. However, the wave-induced vertical mixing can significantly enhance turbulence, as the result more turbulence generated by the horizontal current velocity gradient as a result of wave motion along elliptical tracks. Overestimated Sea Surface Temperature (SST) and underestimated Mixed Layer (ML) depth in summer are common problems for ocean circulation models[7]. It is believed that the two problems are caused by insufficient surface mixing. Craig and Banner[8]and Mellor[9]suggested that surface waves can enhance mixing in the upper ocean. However, it remains a challenging task to parameterize the wave-induced mixing in three-dimensional models. Qiao[10]obtained the spatial and temporal distributions ofλwTto be used in an ocean model. Adding wave-induced vertical mixing to the vertical diffusivity in a global ocean circulation model yields a temperature structure in the upper 100 m closer to the observed climatology data than a model without the wave-induced mixing. Shanfeng presented a numerical study of several hydrographic phenomena with wave-induced vertical mixing[11]. Moreover, some reseachers begin to study the role of wave-induced vertical mixing during the past several years[12-14]. However, detailed effects of different wave parameters on vertical mixing are not available. On the other hand, the role played by the wave-induced vertical mixing in vertical exchanges between fresh water and salt water in estuary was studied poorly. In the present work, the effects of wave on vertical mixing are introduced into wave-current-sediment coupling model COHERENSSED, to improve the understanding of the following problems.
The first problem is related with the effects of wind waves on the transferring of the momentum induced by constant surface wind to seabed. Second problem concerns with the effects of fresh water plume evolution of Yellow River Estuary, which will be studied in detail. Finally, it is the problem of the sensitivity of the effects of wave-induced vertical mixing on surface momentum transfer and salt mixing, which will be studied by analyzing numerical results of one and three dimensional models.
2. Theoretical description of one and threedimensional models
2.1Description of one-dimensional model
In the present work, one-dimensional model means a point model to be used in the vertical direction. In a one-dimensional application, all horizontal gradients, except for the slope of the sea surface elevation and the horizontal pressure gradient, are not considered. Vertical advection by the sinking velocity is neglected in the momentum equations. So the governing equations of momentum are expressed as

whereu,vare current velocities inx,ydirections,f=2Ωsinφis Coriolis coefficient,ρis the water density. In the present work, the vertical eddy diffusion coefficientTνis assumed to be equal to the vertical viscosity coefficient.Tνconsists of two components in the present work. One is from the current and the other one is induced by the wave. SoTνwill be expressed as:
whereνcTandνwTare the current-induced vertical eddy diffusion coefficient and the wave-induced vertical eddy diffusion coefficient, respectively.
The current velocity can be decomposed into two components, a mean and a fluctuation[10],
whereUianduirepresent the means and the fluctuations of the velocity, espectively, and subscriptsi=1,2,3 represent axes of the Cartesian coordinates (x,y,z). The velocity fluctuation can be further decomposed into the turbulence portionuicand the wave-induced fluctuationuiw. Thus, the Reynolds stress can be written as

where the first term on the right-hand side is the wave-induced Reynolds stress. The fourth term is the turbulence viscosity. The second and third terms of Eq.(5) are related with the wave-induced vertical eddy viscosity or diffusivity, that is, the vertical eddy viscosity coefficientνwT, which can be expressed as[10]:
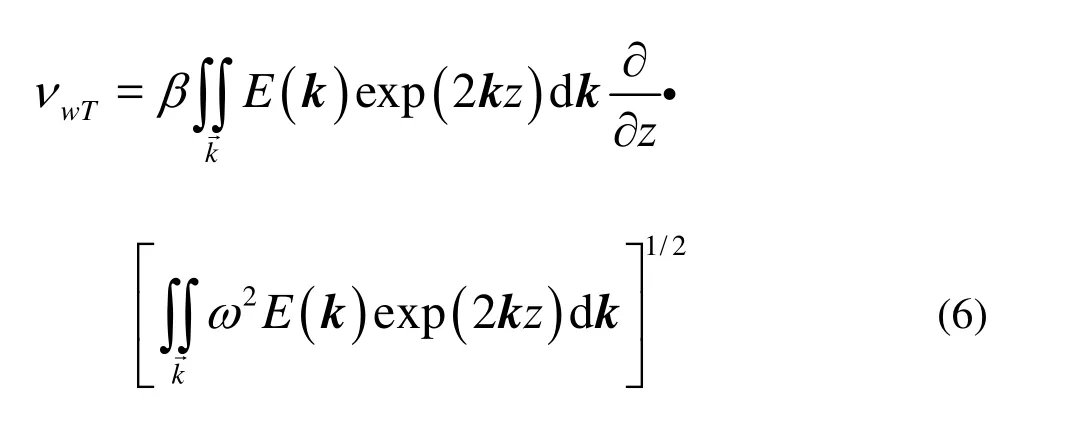
whereE(k) represents the wave number spectrum, which involves wind wave and swell,Hrepresents the wave height,ωis the wave angular frequency,kis the wave number, andzis the vertical coordinate, with positive direction downward and withz=0at the surface. Coefficientβ=O(1) should be calibrated by observations. Current-induced verticaleddy diffusion coefficientνcTis determined based on the following formulation.

One equationk−εturbulence close model is adopted to calculatek,ε.

whereBis the gravity effect term.
2.2Description of the three-dimensional modelMomentum and continuity equations are[15]:

whereu,v,ware the current velocities inx,y,zdirections,gis the gravitational acceleration,νHandνTare the horizontal viscosity coefficient and the vertical eddy viscosity coefficient, respectively, withνTbeing calculated by Eq.(3),τxx,τxy,τyx,τyyare the horizontal components of the stress tensor. The salinity governing equation is


whereCis the salinity concentration.
3. Modeling setting
3.1 Setting of one-dimensional model
130 m and 20 m are taken as the water depth input for the one-dimensional model, which stand for the cases of “infinite deep water depth” and “finite water depth”, respectively, and will be called a_group and b_group.
To identify the effects of different wave parameters, 2 m, 3.5 m and 5 m are taken as the wave height and 8 s, 10 s and 12 s are taken as the wave period in different cases.
The following six conditions are simulated.
(1) Wind velocity inx-direction isu=20m/s
and wind velocity iny-direction isv=0m/s.
(2) Vertical eddy viscosity coefficientTνbeing described asAzin Eq.(3) takes three different values,
that is,Az=0.05, that calculated by turbulence
modelk−εand that calculated by Qiao, respectively.
(3) The non-slip condition is assumed for the bottom boundary such that the horizontal current velocitiesu=v=0.
(4) The surface shear stress isas from
(5) The horizontal current velocity profiles and the vertical eddy viscosity coefficient keep stable.
(6) All other associated parameters are the same except for the different settings given by numerical experiments.
3.2Setting of three-dimensional model and wave model
The grid consists of 94×100 points and the vertical water is divided into 9 layers. The computed map ranges from 118o15'E - 119o50'E in longitude direction and 37o17'N - 38o30'N in latitude direction. The resolution in longitude and latitude is around 1000m and the discharge is 500 m3/s. Four main component tidesK1,O1,M2,S2are combined to provide the time series surface elevation as open boundary conditions.
The time step of the baro-tropic model is 15 s and that of baro-clinic model is 150 s. Open boundary conditions of wave height and period are 2.8 m and 8 s, respectively.
4. Results of model discussion
4.1 Verification of the numerical model
4.1.1 Verification of wind-induced current for 130 m
water depth (a_group)


According to Fig.1, both numerical and analytical results withAztaking a constant value of 0.05 give the maximum surface wind-induced current velocity of around 2 m/s. The numerical results agree well with the analytical results, which shows the model’s effectiveness on simulating the horizontal current momentum transferring downward.

Fig.1 Vertical distribution of horizontal velocity and vertical eddy viscosity coefficient
4.1.2 Verification of the wind-induced current for 20 m water depth (b_group)
The wind-induced flow velocity takes the following analytical expressions with vertical the eddy coefficientAzbeing constant as[16]
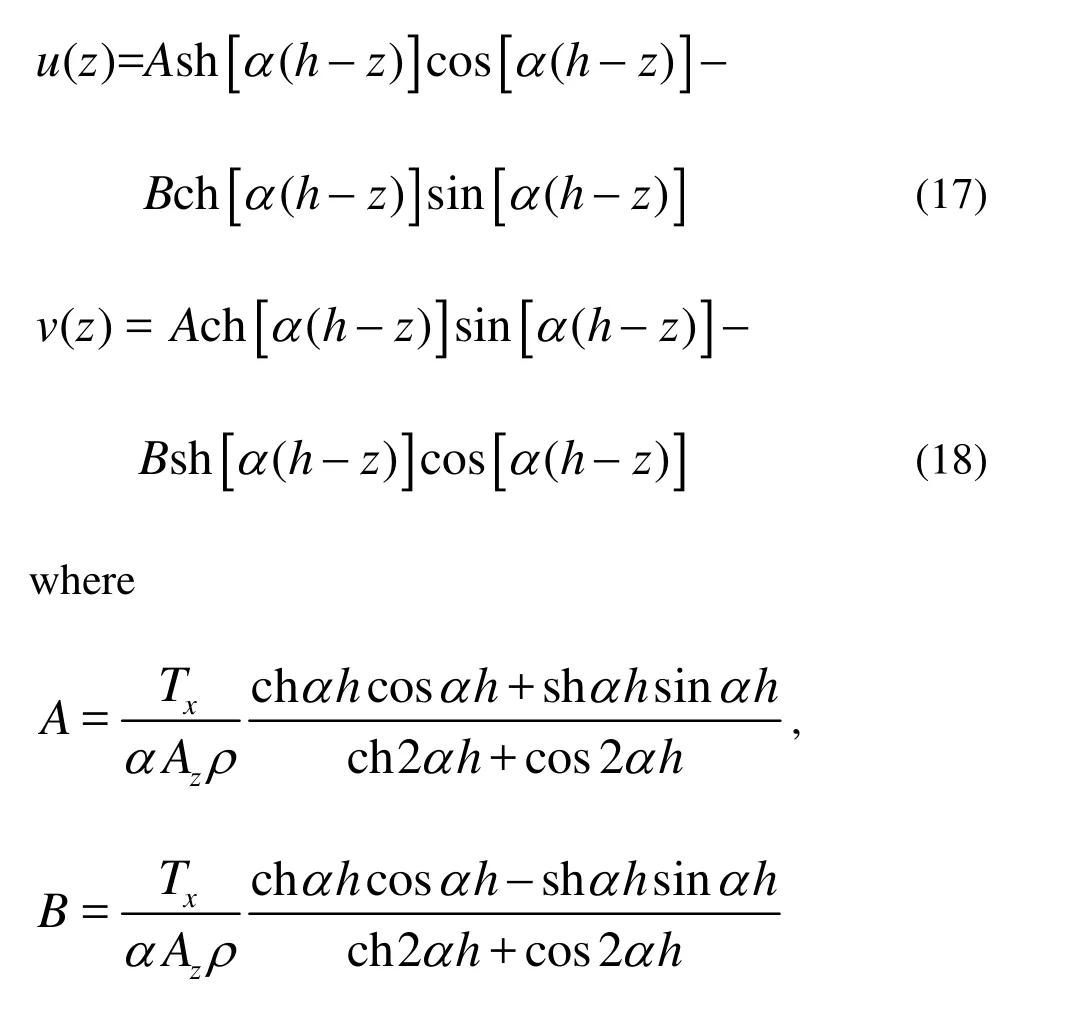
According to the left figure of Fig.2, the analytical results withAz=0.05 is the same as the model simulation results whenAztakes a constant value of 0.05, and both give the maximum surface wind-induced current velocity of around 0.73 m/s, which implies that the numerical model is reasonable and accurate.

Fig.2 Vertical distribution of horizontal velocity and vertical eddy viscosity coefficient
4.1.3 Verification of the wave-current coupling model

Fig.3 Depth averaged current velocity and direction of observation station 1
According to Fig.3, the simulation results agree in an acceptable manner with the measurements. The wave-current interaction retards the turning time of the current to around 30 h. Such phenomenon can be explained by a strong wind around 30 h. So the obvious difference of the current direction around 30 h might be the result of the retarding effect of the enhanced bottom shear stress caused by strong waves.
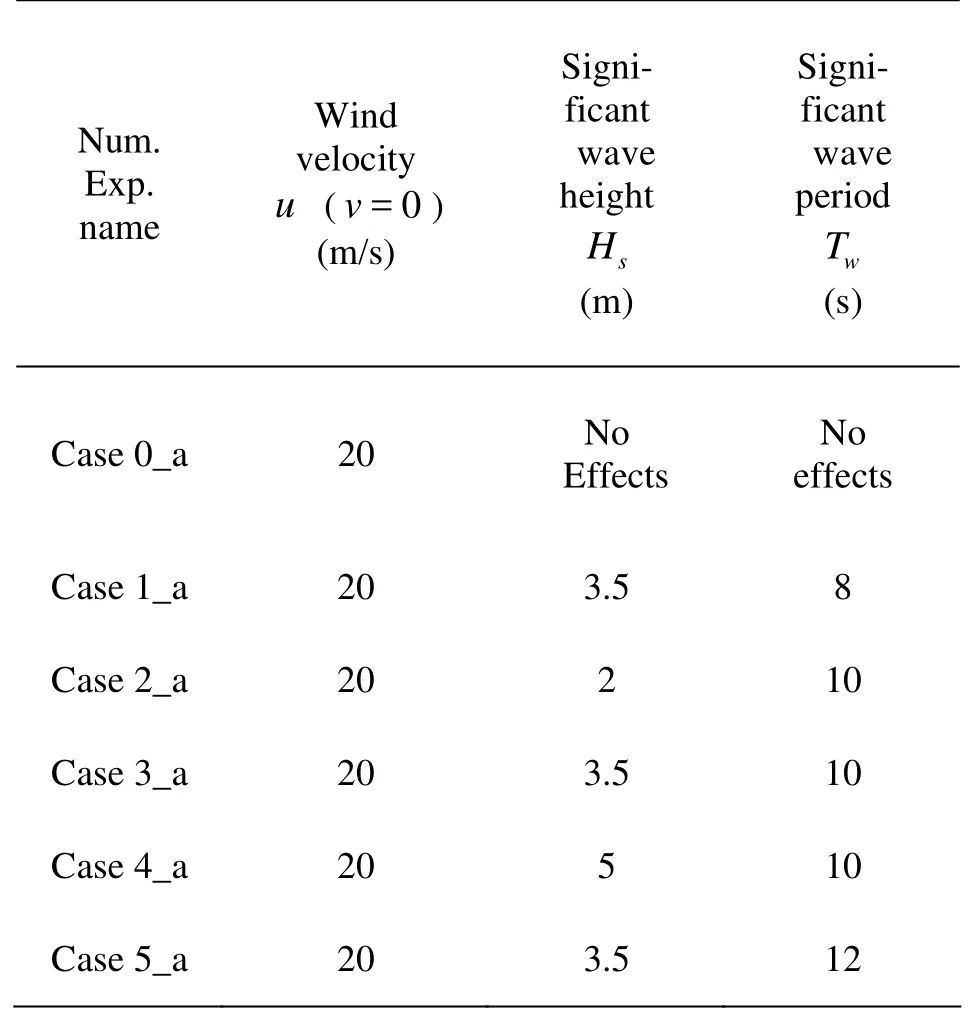
Table1 Numerical experiments with water depth is130 m
4.2Discussion of one-dimensional model
4.2.1 Wind-induced current for 130 m water depth (a_group)
The following cases of 130 m water depth are named as a_group. According to different significant wave heights and wave periods, six numerical experiments are carried out, as shown in Table 1. In Case 1_a to Case 5_a, calculations are carried out with vertical eddy viscosity coefficientAzgiven by Qiao et al.[10]. In Case 0_a,Azis obtained by turbulence modelk−ε.

Fig.4(a) Vertical distribution of horizontal velocity and vertical eddy viscosity coefficient
As seen from the left figure of Fig.4(a), where the wave period is 10 s with vertical eddy viscosity coefficientAzbeing calculated by turbulence modelk−εonly, in the water column between 8m below surface and the surface, the velocity is much larger than those in other conditions in whichAzis calculated jointly by turbulence modelk−εand Qiao’s equation accounting for the wave-induced vertical mixing, which shows that a large wave heightwould generate a small horizontal velocity around the surface. As the wave height is increased from 2 m to 5 m, the horizontal velocity decreases gradually around the surface.
In the right figure of Fig.4(a), where the wave period is 10 s withAzbeing calculated by turbulence modelk−εonly, the vertical eddy viscosity is much smaller than those in other conditions in whichAzis calculated by the combination of Qiao’s equation and turbulence modelk−ε. As the wave height is increased from 2 m to 5 m, the vertical eddy viscosity also increases. The increasing rate around surface is great, and becomes much smaller below 8 m.

Fig.4(b) Vertical distribution of horizontal velocity and vertical eddy viscosity coefficient
In the left figure of Fig.4(b), where the wave height is 3.5 m, andAzis not influenced by the wave-induced vertical mixing, the velocity is much larger than those in other conditions in whichAzis calculated by the combination of Qiao’s equation and turbulence modelk−εaround water surface. As the wave period increases from 8 s to 12 s, the horizontal velocity increases gradually in the top of water. In a deep water, however, it changes but a little.
In the right figure of Fig.4(b), where the wave height is 3.5 m, andAzis obtained by turbulence modelk−εonly, the vertical eddy viscosity is much smaller than those in other conditions in whichAzis calculated by the combination of Qiao’s equation and turbulence modelk−ε. As the wave period increases from 8 s to 12 s, the vertical eddy viscosity decreases near the surface.
4.2.2 Wind-induced current with 20 m water depth (b_group)
The following cases with 20 m water depth are named as b_group. The input conditions are the same as for a_group except for the water depth. Just like a_group, six numerical experiments are carried out, as shown in Table 2.

Table 2 Numerical experiments with water depth is 20 m
As seen from the left figure of Fig.5(a), where the wave period is 10 s and the vertical eddy viscosity coefficientAzis calculated by turbulence modelk−εonly, in the water column between 8 m below surface and the surface, the velocity is much larger than those in other conditions in whichAzis calculated jointly by turbulence modelk−εand Qiao’s equation except for the case of wave height being 2 m, which shows that a larger wave height generates a smaller horizontal velocity around the surface. With the wave height increasing from 2 m to 5 m, the horizontal velocity decreases gradually above the middle of the water column, but below the middle of the water column, it changes but a little.

Fig.5(a) Vertical distribution of horizontal velocity and vertical eddy viscosity coefficient
In the right figure of Fig.5(a), whenAzis calculated by turbulence modelk−εonly, the vertical eddy viscosity is much smaller than those in other conditions in whichAzis calculated by the combination of Qiao’s equation and turbulence modelk−ε. With the wave height rising from 2 m to 5 m, the vertical eddy viscosity increases.
As seen from the left figure of Fig.5(b), whenAzis calculated by turbulence modelk−εonly, in the depth of 8 m’s water column, the horizontal current velocity is much larger than those in other conditions in whichAzis calculated by the combination of Qiao’s equation and turbulence modelk−ε. With the wave period rising from 8 s to 12 s, the horizontal velocity decreases in the top half water generally. However, for the “finite water depth”b_group, the horizontal velocity profiles of the three cases with 8 s, 10 s and 12 s wave period are intersected, while for the “infinite deep water”a_group, corresponding profiles are not intersected, as shown in the left figure of Fig.4(a).
In the right figure of Fig.5(b), whenAzis calculated by turbulence modelk−εonly, the vertical eddy viscosity is much smaller than those in other conditions in whichAzis calculated by the combination of Qiao’s equation and turbulence modelk−ε. With the wave period rising from 8 s to 12 s, the vertical eddy viscosity decreases around the water surface.

Fig.5(b) Vertical distribution of horizontal velocity and vertical eddy viscosity coefficient
Results of both “infinite deep water” a_group and “finite water depth” b_group show that a larger wave height can generate a larger vertical eddy viscosity and a smaller horizontal velocity generally, which are due to higher wave’s generation of larger velocity gradient induced by faster wave motion velocity along elliptical tracks. However, numerical results shown in Figs.4(b), 5(b) show that larger wave period causes smaller vertical eddy viscosity and higher horizontal velocity generally, which is due to longer period wave’s generation of smaller velocity gradient induced by slower wave motion velocity, when wave heights are same.
4.3Discussion of Yellow River Delta case
In order to study the effects of the wave-induced vertical mixing on the momentum transferring, the current velocity of the cross-section in Yellow River estuary based on the current modeling of Yellow River Delta is obtained. The modeling of three-dimensional current under joint action of wave and current in Yellow River Delta was verified in Liang et al.[17], where the model’s effectiveness isshown. Two numerical experiments are carried out, as shown in Table 3. Wave parameters are calculated by the wave model SWAN with the open boundary condition and with wave height and period being 2.8 m and 8 s, respectively.
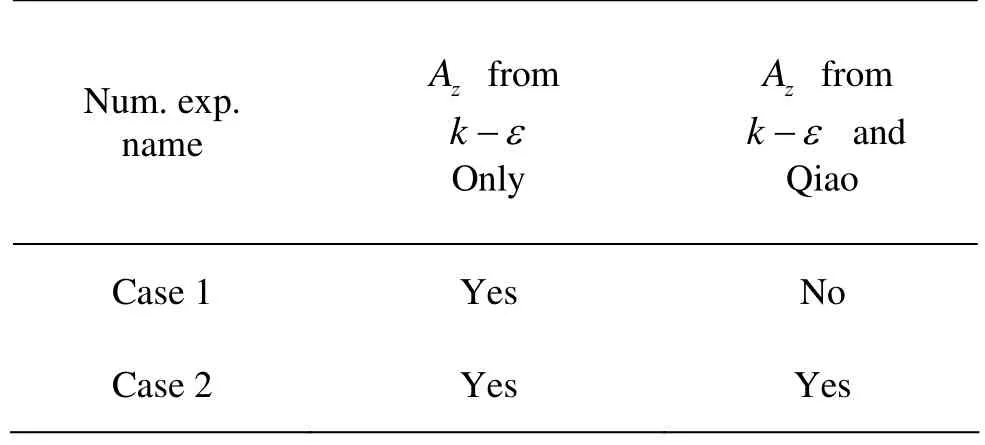
Table 3 Numerical experiments of Yellow River Delta

Figure 7 shows that a high current velocity zone exists in the upper part of the water column for both cases. However, the thickness of the high velocity zone in the two cases is different. Generally, wave’s existence increases the thickness of high velocity zones and makes the contour lines of velocity steeper, which may be attributed to the enhancement of the vertical mixing ability of the momentum generated by the wave. The wave-induced vertical mixing causes a larger thickness than what can be achieved in thek−εcase. The current velocity in the case of using Qiao’s method in calculation of vertical eddy viscosity coefficient enhanced by wave is lower among the two cases, which is the result of the wave-induced higher vertical eddy viscosity coefficient. Meanwhile, by comparing the two section pictures on A-A cross section in Fig.7, it is easy to see that the wave-induced vertical mixing inhibits fresh water to spread in the open sea. According to the pictures, the high current velocity only exists in a thin surface layer and the current velocity decreases rapidly.
Figure 8 shows that the salinity concentration caused by the wave-induced vertical mixing is depth independent due to the strong vertical exchange between salt water in lower layers and fresh water in upper layers. That phenomenon shows that the presence of wave enhances the vertical exchanging ability of salt and fresh water. However, it is a quite different phenomenon for the case without wave-induced vertical mixing. Salinity concentration contour lines for the case without wave’s effects on vertical mixing change greatly around the surface instead of being constant as in cases with wave’s such impacts.

Fig.6 Distribution field of significant wave height (A-A stands for cross-section of Yellow River mouth)
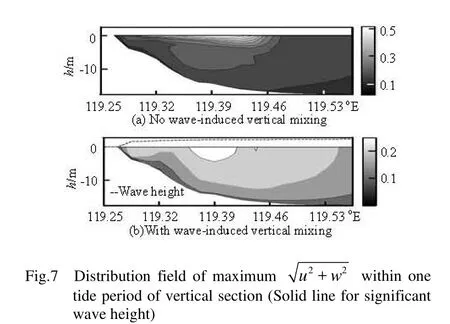
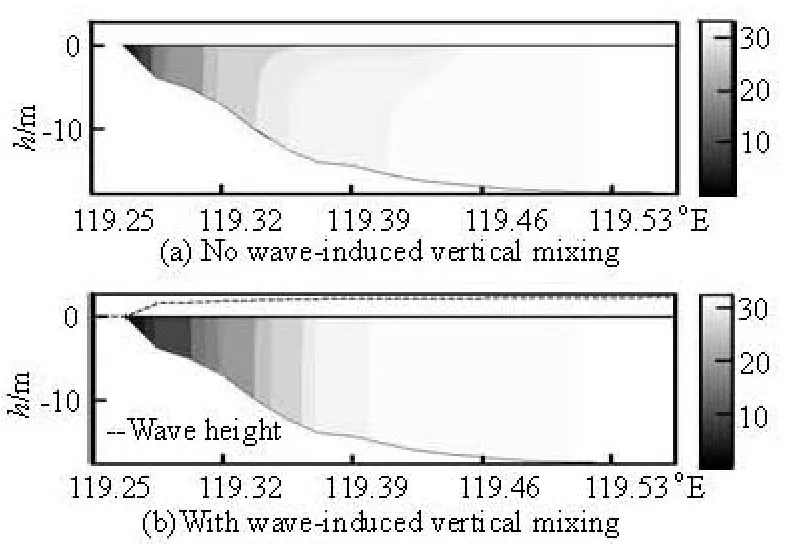
Fig.8 Distribution field of mean salinity concentration within one tide period of vertical section (Solid for significant wave height)
5. Conclusions
Numerical results for simple cases are similar to analytical results and agree well with measurements, which shows the model’s effectiveness.
Results of both “infinite deep water” a_group and “finite water depth” b_group show that higher wave height can generate larger vertical eddy viscosity and lower horizontal velocity generally, due to a higher wave’s generation by a larger velocity gradient induced by a greater wave motion velocity along elliptical tracks. Larger velocity gradient will produce stronger turbulence, which increases the wave-induced vertical mixing. However, numerical results shown in Figs.4(b), 5(b) indicate that a larger wave period generates a smaller vertical eddy viscosity and a higher horizontal velocity generally, due to a longer period wave’s generation by a smaller velocity gradient induced by a smaller wave motion velocity, when wave heights are same. So the enhancement of turbulence induced by wave particle motion becomes smaller.
The results of fresh water plume at Yellow River mouth show that the wave-induced vertical mixing enhances the momentum of fresh water vertical mixing and salt mixing between fresh water of upper layers and salt sea water of lower layers, which is the result of stronger turbulence exchanging ability increased by wave time- and space-variable motion. So the fresh water flume length is compressed considerably.
The results of the present work show that large differences both of wave height and wave period lead to significantly different effects on vertical profiles of the horizontal current velocity.
Acknowledgement
This work was supported by the Project from Korea Ocean Research and Development Institute “Study on wave-curre interaction and development of local wave and wave Setup prediction model”.
[1] TANG Jun, SHEN Yong-ming and QIU Da-hong. Numerical simulation of longshore currents and pollutant movement in waves and currents in coastal zone[J].Acta Oceanologica Sinica,2008, 30(1): 147-155(in Chinese).
[2] LI Chang-liang, LIANG Bing-chen and ZHANG Jing. Modeling of suspended sediment transport with wave-induced longshore current in Huanghe (Yellow) River Delta[J].Acta Oceanologica Sinica,2009, 28(3): 65-74.
[3] WANG Baoxing, CHADWICK A. J. and OTTA A. K. Derivation and application of new equations for radiation stress and volume flux[J].Coastal Engineering,2008, 55(4): 302-318.
[4] TANG H. S., KEEN T. R. and KHANBILVARDI R. A model-coupling framework for nearshore waves, currents, sediment transport, and seabed morphology[J].Communications in Nonlinear Science and Numerical Simulation,2009, 14 (7): 2935-2947.
[5] LETTMANN K. A., WOLFF J. O. and BADEWIEN T. H. Modeling the impact of wind and waves on suspended particulate matter fluxes in the East Frisian Wadden Sea (southern North Sea)[J].Ocean Dynamics, 2009, 59(2): 239-262.
[6] JIANG Heng-zhi, SHEN Yong-ming and WANG Shoudong. Numerical study on salinity stratification in the Oujiang River Estuary[J].Journal of Hydrodynamics,2009, 21(6): 835-842.
[7] KANTHA L. H., CLAYSON C. A. An improved mixed layer model for geophysical applications[J].J. Geophys. Res.,1994, 99: 25235-25266.
[8] CRAIG P. D., BANNER M. L. Modeling waveenhanced turbulence in the ocean surface layer[J].Journal of Physical Oceanography,1994, 24: 2546-2559.
[9] MELLOR G. L. The three-dimensional current and wave equations[J].Journal of Physical Oceanography,2003, 33: 1978-1989.
[10] QIAO Fang-li, YUAN Ye-li and YANG Yong- zeng et al. Wave-induced mixing in the upper ocean: Distribution and application to a global ocean circulation model[J].Geophysical Research Letters,2004, 31(11): DOI: 10. 1029/2004 GL019824.
[11] SHAN feng. Numerical study on several hydrographic phenomena in the Yellow Sea and the East China Sea[D]. Ph. D. Thesis, Qingdao: Ocean University of China, 2009(in Chinese).
[12] ARDHUIN F., JENKINS A. D. On the interaction of surface waves and upper ocean turbulence[J].Journal of Physical Oceanography,2006, 36: 551-557.
[13] BABANIN A. V., GANOPOLSKI A. and PHILLIPS W. R. C. Wave-induced upper-ocean mixing in a climate model of intermediate complexity[J].Ocean Modelling,2009, 29(3): 189-197.
[14] YUAN Li-rong, SHEN Yong-ming and TANG Jun. Analysis of mixing of pollutants in water waves and currents[J].China Ocean Engineering,2007, 21(1): 115-124.
[15] LIANG Bing-chen, LI Hua-jun and LEE Dong-yong. Numerical study of three-dimensional suspended sediment transport in waves and currents[J].Ocean Engineering,2007, 34(11-12): 1569-1583.
[16] YE An-le, LI Feng-qi.Physical oceanography[M]. Qingdao: Press of Ocean University of Qingdao, 1992(in Chinese).
[17] LIANG Bing-chen, LI Hua-jun and LEE Dong-yong. Bottom shear stress under wave-current interaction[J].Journal of Hydrodynamics,2008, 20(1): 88-95.
November 13, 2009, Revised January 15, 2010)
* Project supported by the Natural National Science Foundation of China (Grant No. 50809065), the National Science Foundation of Shangdong Province (Grant No. Q2007E05).
Biography:LIANG Bing-chen (1976-), Male, Ph. D., Associate Professor
2010,22(3):410-418
10.1016/S1001-6058(09)60072-X

- 水动力学研究与进展 B辑的其它文章
- NUMERICAL SIMULATIONS OF WAVE-INDUCED SHIP MOTIONS IN TIME DOMAIN BY A RANKINE PANEL METHOD*
- A SIMPLIFIED NUMERICAL MODEL OF 3-D GROUNDWATER AND SOLUTE TRANSPORT AT LARGE SCALE AREA*
- THE EFFECT OF RECLAMATION IN AREAS BETWEEN ISLANDS IN A COMPLEX TIDAL ESTUARY ON THE HYDRODYNAMIC SEDIMENT ENVIRONMENT*
- IMPROVED DEM-CFD MODEL AND VALIDATION: A CONICAL-BASE SPOUTED BED SIMULATION STUDY*
- FLOWS THROUGH ENERGY DISSIPATERS WITH SUDDEN REDUCTION AND SUDDEN ENLARGEMENT FORMS*
- ANALYTICAL STUDY OF WAVE MAKING IN A FLUME WITH A PARTIALLY REFLECTING END-WALL*