
Improvement of pump-probe optical measurement technique using double moving stages
2013-12-29 02:05ZhangChunweiZhaoWeiweiBiKedongYongGuoqingGaoXuesongWangJianliChenYunfei
Zhang Chunwei Zhao Weiwei Bi Kedong Yong GuoqingGao Xuesong Wang Jianli Chen Yunfei
(Jiangsu Key Laboratory for Design and Manufacture of Micro-Nano Biomedical Instruments, Southeast University, Nanjing 211189, China)
Several techniques have been developed to measure the thermal properties of nanomaterials, such as the 3ω method[1-3], the microbridge technique[4]and the modulated thermoreflectance microscopy[5]. The pump-probe optical technique is widely applied to characterize the thermal diffusivity[6], electron-phonon coupling factor[7-8], thermal conductivity[9-11]and interfacial thermal conductance[12-13]of various nanomaterials due to its high sensitivity to thermal properties.
Variations of this technique have been developed based on a similar principle[14-16]. The beam pulse from a femtosecond laser oscillator can be split into two beams. The intense beam (pump beam) passes through an acousto-optic modulation (AOM), which creates a pulse train at a modulation frequency, and is focused on the metal surface. After thermal excitation in the metal, the optical properties of the metal are changed, and the change is probed by another weaker beam (probe beam) which is time-delayed relative to the pump beam by a moving stage. Once the change of surface temperature of metal has been tracked, the thermal properties can be obtained accurately. Typically, the time-delayed difference between pump and probe path is controlled by a mechanical moving stage; thus, the misalignment of the mechanical stage and the divergence of the beam can significantly influence the measurement results. For a single moving stage, without misalignment and divergence of the probe beam, the maximum delay time between the pump and probe paths is typically 4 ns, which is too short to obtain the accurate thermal properties for some samples with multilayer structures, low thermal diffusivity, and poor interface contacts.
A single-mode optical fiber is introduced into the setup by some research groups[16]to avoid the misalignment in long-range scanning, before the probe beam is focused on the surface of metal. However, care must be taken to ensure that the incident light is parallel to the axis of the fiber. Otherwise, part of the probe beam is exhausted into the fiber. Taketoshi et al.[17]used two laser oscillators to implement the transient thermoreflectance measurement, in which the beam from the front laser is used to excite the surface of metal, and the beam from the back laser is employed to probe the changes of temperature profile. In the setup, the time-delayed difference between the pump and probe beams is controlled by an electrical delay technique rather than a mechanical moving stage, which avoids the problems from misalignment and divergence. However, this method requires two laser oscillators, which makes the measurement more complicated and costly. Currently, time domain pump-probe transient thermoreflectance (TDTR) has been widely applied to investigate thermal transport in thin film and bulk materials, due to its high sensitivity to the thermal properties of nanomaterials. In the technique, it is crucial to overcome the difficulties from alignment and divergence.
In order to extend the observation time of temperature decay, and keep the adjustment of beam paths more convenient, based on the previous measurement system[18], we develop a femtosecond laser transient thermoreflectance system with double moving stages through inserting one mechanical stage in the pump beam path. Compared with the setup with one single moving stage, the maximum delay time between the pump and probe beams is prolonged from 4 to 8 ns, which greatly extends the scanning time.
1 Experimental Setup
The schematic of the optical layouts used in a femtosecond laser transient thermoreflectance system with double moving stages is illustrated in Fig.1. The experimental setup is almost identical to the previous system[18], except for inserting a mechanical moving stage in the pump path. The pulse train, which originates from a mode-locked laser oscillator (Mira Model 900-F) with about 1 W power output at a frequency of 76 MHz, and a pulse width of 200 fs at the wavelength of 810 nm, is divided into two beams by a beam splitter. The polarization of the intense pump beam is rotated 90° by a polarizer, which facilitates removing any scattered pump light from the rough surface of metal before the beam is detected by the detector. After the pump beam passes through the AOM, which creates a train of pulse at a specific frequency, the pump beam becomes divergent. The pump expander is applied to collimate the beam to reduce relative shift and divergence at long-range scans. The pump pulse generates a transient thermal response at the metal surface and the weaker probe beam is used to monitor the temperature changes of the surface. The probe beam passes through the same optics as the pump beam does and is focused on the active area illuminated by the pump beam. After being reflected off from the surface of the sample, the probe beam carrying the thermal response information
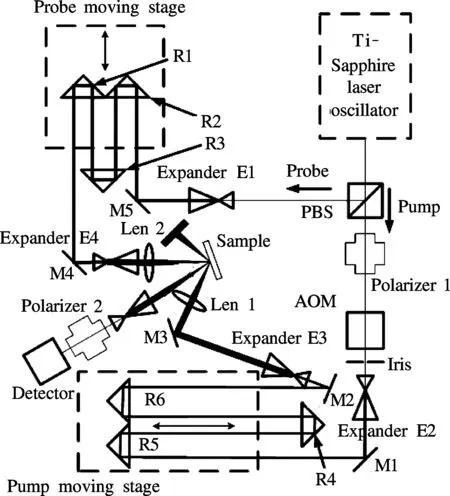
Fig.1 Schematics of the TDTR with double moving stages
is forwarded into a photodiode which turns the optical signals into electrical signals. The electrical signals include nontransient and transient signals[19]. For the purpose of extracting the transient signals, the lock-in amplifier distinguishes the signals using the frequency from a function generator as a reference and transfers them into the computer.
The principle of the double moving stages is shown in Fig.2. For this technique, the scanning process is divided into two steps. First, the pump beam is kept located at zero position, where the data from 0 to 4 ns are obtained by moving the mechanical stage in the probe path. Secondly, after the probe beam comes back to the zero position again, the pump beam is automatically driven to the 4ns position of the stage by the computer, where we can get the scanning data from 4 to 8 ns by moving the mechanical stage in the probe path again. If the two sets of scanning data can be connected with each other smoothly at the 4 ns junction, it indicates that the first 4 ns scanning data are perfect. Otherwise, the two beam paths need to be readjusted. Therefore, the last additional 4 ns scanning data obtained by introducing a mechanical moving stage in the pump path can be used to verify the first 4 ns scanning data.

Fig.2 Principle of the double moving stages
For the long-range scanning process, the measurement signals are significantly sensitive to the overlap level of the pump and probe beams. Therefore, both beams are required to be aligned as possible as we can. At first, the probe beam needs to be parallel to the moving direction of probe moving stage, by carefully adjusting mirror M5 in Fig.1, which avoids the misalignment of the returned probe beam. To ensure the reflected probe beam from R2 is parallel to the incoming beam, the face of retroreflectance R2 must be vertical to the incoming beam reflected from mirror M5. If the conditions mentioned above are met, the retroreflectance R2 will move together with the moving stage and change the incoming probe beam direction by 180°.
It is more difficult to achieve an ideal returned beam from retroreflectance R1, because two correlation conditions must be met simultaneously. To overcome the difficulties, we first direct the probe beam from retroreflectance R3 to a distance of about 10 m or more. At the distance, the tiny shift of the probe beam can be amplified almost 20 times (The delay stage moves 0.3 m, while the beam travels 0.6 m with two cycles), which facilitates adjusting the direction of retroreflectance R3. The probe beam stage is moved back and forth, and meanwhile, retroreflectance R3 is adjusted carefully until the spot shift cannot be seen, which indicates that the drift of probe beam is negligible. Finally, the probe beam is perpendicular to the face of retroreflectance R3. We vary the position of retroreflectance R1, until the spot of the probe beam at a distance of 10 m or more keeps stable. Once the spot of the probe beam stays at the right position, the probe beam is aligned well. For the purpose of obtaining 8 ns delay time, the pump beam should also be aligned, as we have done with the probe beam.
The signals are not only sensitive to the alignment of both beams, but also prone to be affected by the beam divergence. Therefore, it is necessary to collimate both of the beams. A perfect beam with 1/e2radiusr0diverges with respect to[16]
whereλis the wavelength of beam;lis the distance the light travels. Obviously, if the beam is not collimated correctly, the beam radius will increase significantly as the stage moves, which results in unreasonable temperature profiles. Some techniques are developed to reduce the divergence of the beam. Schmidt et al.[9]presented an expander in the upstream of the moving stage to minimize the beam divergence at long delay times. Here, the method is applied in our system, but we adjust the expander intentionally to compress the beam which makes the beam almost parallel when impinged onto the sample.
We measure the diameters of both beams with a beam profiler at different delay time points, as shown in Fig.3.
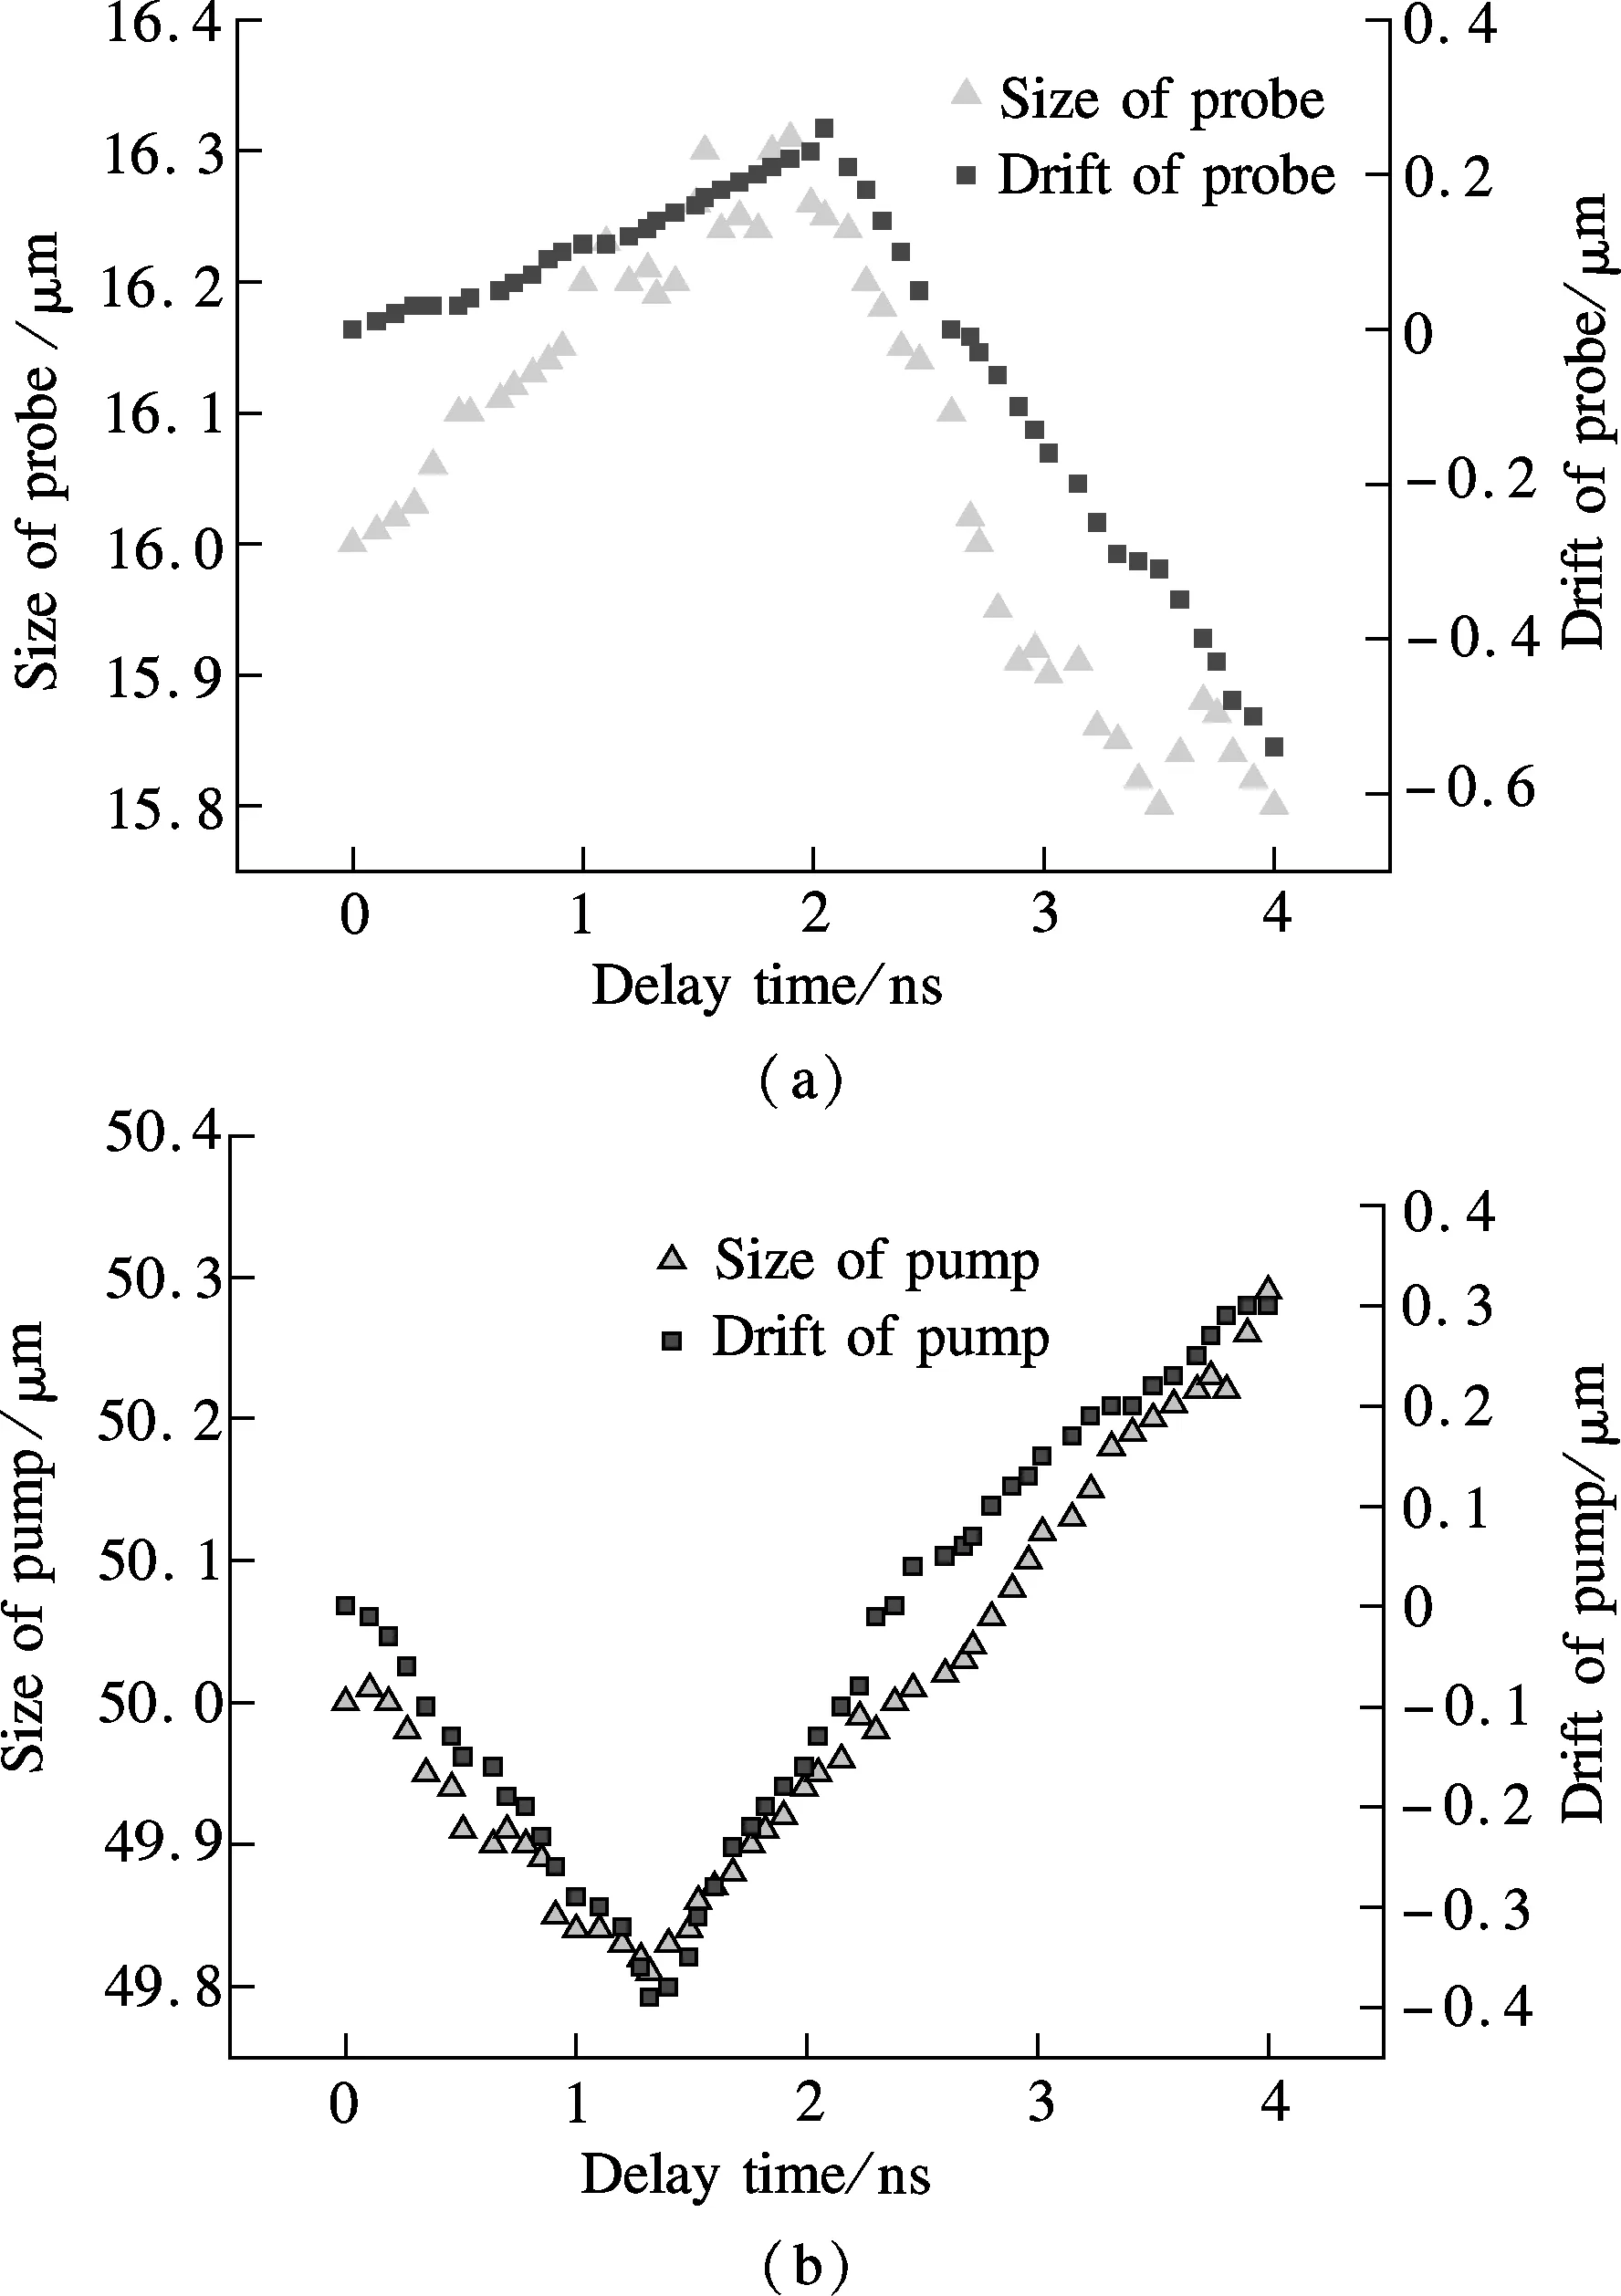
Fig.3 Measured spot sizes and variation of center position of probe and pump beam at different delay time points. (a) Probe beam sizes and center locations; (b) Pump beam sizes and center locations
Obviously, the divergence of both beams is less than 0.5 μm and the drift of both beams is less than 1 μm during the delay time (4 ns). Both Figs.3(a) and (b) exhibit a sharp variation at different delay time, which is due to the mechanical error of the moving stage. It is reasonable to assume that the effects of misalignment and divergence of both beams on the experimental results during the whole scanning process can be ignored, compared with the beams spot sizes (typically 16 to 50 μm). In addition, in order to further minimize the effects, some techniques can be used, such as enlarging the pump beam spot size and reducing that of the probe beam. However, the signal to noise ratio is depressed while enlarging the pump beam diameter. Therefore, in our system, the probe beam spot size is adjusted to be 16 μm and that of the pump beam is set to be 50 μm.
2 Experimental Results
Combined with the mechanical moving stage in the pump path, the measurement setup not only presents a long-range scanning (0 to 8 ns), but also possesses the ability to verify the data from the short-range scanning (0 to 4 ns). To test the improved technique, we prepared two samples, Al/Si and Cr/Si, by means of the magnetron sputtering method. The two samples are chosen due to their large interfacial thermal conductance[20-23], which results in a rapid cooling of metal films. Consequently, the voltage magnitude of signals is more sensitive to the divergence and shift of both beams.
The measured results together with fitting curves are shown in Fig.4. In fact, the data from the lock-in amplifier denote the intensities of the probe beam at different delay time points. When the pump pulse is impinged on the surface of metal, electrons in the metal absorb the energy of the photons, which results in the change of the surface reflectance of metal. The variation of reflectance is characterized by the sharp rise of signal, when both beams are spatially and temporally overlapped. The electron-electron collision lasts no longer than one picosecond for most metals[24]. Afterward, the electrons transfer the excess energy to the phonons by interaction between electron and phonon[7-8], which results in the temperature rise of the metal lattices. Subsequently, the temperature decay profile can be described by the Fourier thermal transport equation.
In order to determine the thermal properties, the experimental data are required to be compared with an appropriate model of the thermal transport[14, 25-26]. The thermal properties of interest are treated as free parameters, which are adjusted to minimize the difference between the model and the experimental data by means of the least square fitting. Therefore, the temperature profile from the measurement can significantly influence the fitting values of thermal properties of interest. In the improved system, the criterion of evaluation is whether the measurement data from the two periods are perfectly combined at the 4 ns
point or not. If the scanning data from 0 to 4 ns can be connected smoothly with those from 4 to 8 ns, it is reasonable to believe that the system is perfect.
For the voltage signals of Al/Si and Cr/Si, after being normalized to the value at the 0.1 ns point, the thermal model is fitted to the experimental values by changing the thermal conductance of interface as shown in Figs.4(a) and (b). In the case, the interfacial thermal conductance of both samples are 220 and 185 MW/(m2·K), respectively, in good agreement with the literature values[23, 25, 27]. To demonstrate both values, we also fit the phase data. In the method, the information of the phase includes the real and image components from the lock-in amplifier, which avoids the difficulty of normalization and cancels out the effects from the noise. We obtain the thermal conductance of interface 220 and 175 MW/(m2·K), respectively, which well agrees with the values from magnitude fit. The data around 4 ns are also presented in Figs.4(c) and (d). Irrespective of Al/Si or Cr/Si, data from the two periods can be connected smoothly, which implies that the misalignment and divergence of both beams can be ignored.
3 Conclusion
Based on our previous measurement system with one single mechanical moving stage, we develop a femtosecond laser transient thermoreflectance system with double moving stages. The system can not only extend the measurement range, but also verify the short-range scanning data, which ensures the experimental data more believable. To verify the reliability of the system, we measured both samples and fitted the magnitude data to obtain the thermal conductance of the interface, which are in good agreement with literature values. In addition, phase data are also fitted to further demonstrate thermal conductance of the interface from magnitude fit. The system is expected to be used to further investigate the thermal transport in nanometer scale, particularly, to facilitate measuring the materials with multilayered structures, low thermal diffusivity, and low interfacial thermal conductance.
[1]Cahill D G. Thermal conductivity measurement from 30 to 750 K: the 3ω method[J].RevSciInstrum, 2002,73(10): 802-808.
[2]Raudzis C E, Schatz F, Wharam D. Extending the 3ω method for thin-film analysis to high frequencies [J].JApplPhys, 2003,93(10): 6050-6055.
[3]Cahill D G, Bullen A, Lee S M. Interface thermal conductance and the thermal conductivity of multilayer thin films [J].HighTempHighPress, 2000,32(2): 135-142.
[4]Swartz E T, Pohl R O. Thermal-boundary resistance [J].RevModPhys, 1989,61(3): 605-668.
[5]Rosencwaig A, Opsal J, Smith W L,et al. Detection of thermal waves through optical reflectance [J].ApplPhysLett, 1985,46(11): 1013-1015.
[6]Paddock C A, Eesley G L. Transient thermoreflectance from thin metal-films [J].JApplPhys, 1986,60(1): 285-290.
[7]Hostetler J L, Smith A N, Czajkowsky D M, et al. Measurement of the electron-phonon coupling factor dependence on film thickness and grain size in Au, Cr, and Al [J].AppliedOpt, 1999,38(16): 3614-3620.
[8]Wang H D, Ma W G, Guo Z Y, et al. Measurements of electron-phonon coupling factor and interfacial thermal resistance of metallic nano-films using a transient thermoreflectance technique [J].ChinesePhysB, 2011,20(4):040701-1-040701-8.
[9]Schmidt A, Chiesa M, Chen X Y, et al. An optical pump-probe technique for measuring the thermal conductivity of liquids [J].RevSciInstrum, 2008,79(6):064902-1-064902-5.
[10]Chiritescu C, Cahill D G, Nguyen N, et al. Ultralow thermal conductivity in disordered, layered WSe2crystals [J].Science, 2007,315(5810): 351-353.
[11]Zhu L D, Sun F Y, Zhu J, et al. Nano-metal film thermal conductivity measurement by using the femtosecond laser pump and probe method [J].ChinesePhysLett, 2012,29(6):066301-1-066301-4.
[12]Norris P M, Smoyer J L, Duda J C, et al. Prediction and measurement of thermal transport across interfaces between isotropic solids and graphitic materials[J].JournalofHeatTransfer, 2012,134(2):020910-1-020910-7.
[13]Stoner R J, Maris H J. Kapitza conductance and heat-flow between solids at temperatures from 50 to 300 K [J].PhysRevB, 1993,48(22): 16373-16387.
[14]Smith A N, Hostetler J L, Norris P M. Thermal boundary resistance measurements using a transient thermoreflectance technique [J].MicroscaleThermophysEng, 2000,4(1): 51-60.
[15]Gengler J J, Roy S, Jones J G, et al. Two-color time-domain thermoreflectance of various metal transducers with an optical parametric oscillator [J].MeasSciTechnol, 2012,23(5):055205-1-055205-8.
[16]Capinski W S, Maris H J. Improved apparatus for picosecond pump-and-probe optical measurements [J].RevSciInstrum, 1996,67(8): 2720-2726.
[17]Taketoshi N, Baba T, Ono A. Electrical delay technique in the picosecond thermoreflectance method for thermophysical property measurements of thin films [J].RevSciInstrum, 2005,76(9):094903-1-094903-8.
[18]Zhang C W, Bi K D, Wang J L, et al. Measurement of thermal boundary conductance between metal and dielectric materials using femtosecond laser transient thermoreflectance technique[J].SciChinaSerE, 2012,55(4): 1044-1049.
[19]Stevens R J, Smith A N, Norris P M. Signal analysis and characterization of experimental setup for the transient thermoreflectance technique [J].RevSciInstrum, 2006,77(8):084901-1-084901-8.
[20]Hopkins P E, Serrano J R, Phinney L M A F, et al. Criteria for cross-plane dominated thermal transport in multilayer thin film systems during modulated laser heating [J].JournalofHeatTransfer, 2010,132(8):081302-1-081302-10.
[21]Hopkins P E, Hattar K, Beechem, T, et al. Reduction in thermal boundary conductance due to proton implantation in silicon and sapphire [J].ApplPhysLett, 2011,98(23):231901-1-231901-3.
[22]Hopkins P E, Phinney L M, Serrano J R, et al. Effects of surface roughness and oxide layer on the thermal boundary conductance at aluminum/silicon interfaces [J].PhysRevB, 2010,82(8):085307-1-085307-5.
[23]Hopkins P E, Norris P M, Thermal boundary conductance response to a change in Cr/Si interfacial properties [J].ApplPhysLett, 2006,89(13):131909-1-131909-3.
[24]Qiu T Q, Tien C L. Heat-transfer mechanisms during short-pulse laser-heating of metals [J].JournalofHeatTransfer, 1993,115(4): 835-841.
[25]Cahill D G. Analysis of heat flow in layered structures for time-domain thermoreflectance [J].RevSciInstrum, 2004,75(12): 5119-5122.
[26]Schmidt A J, Chen X Y, Chen G. Pulse accumulation, radial heat conduction, and anisotropic thermal conductivity in pump-probe transient thermoreflectance [J].RevSciInstrum, 2008,79(11):114902-1-114902-9.
[27]Stevens R J, Smith A N, Norris P M. Measurement of thermal boundary conductance of a series of metal-dielectric interfaces by the transient thermoreflectance technique[J].JournalofHeatTransfer, 2005,127(3): 315-322.
 Journal of Southeast University(English Edition)2013年4期
- Journal of Southeast University(English Edition)的其它文章
- Improvement of pump-probe optical measurement technique using double moving stages
- Effect of aggregation intervalon vehicular traffic flow heteroscedasticity
- Elastoplastic response of functionally graded cemented carbidesdue to thermal loading
- Application of neural network merging model in dam deformation analysis
- Annoyance-type speech emotion detection in working environment
- Mechanical analysis of transmission lines based on linear sliding cable element