
Comprehensive analysis on the sediment siltation in the upper reach of the deepwater navigation channel in the Yangtze Estuary*
2014-06-01 12:30KUANGCuiping匡翠萍CHENWei陈维
水动力学研究与进展 B辑 2014年2期
KUANG Cui-ping (匡翠萍), CHEN Wei (陈维)
College of Civil Engineering, Tongji University, Shanghai 200092, China, E-mail: cpkuang@tongji.edu.cn
GU Jie (顾杰)
College of Marine Sciences, Shanghai Ocean University, Shanghai 201306, China
HE Lu-lu (贺露露)
College of Civil Engineering, Tongji University, Shanghai 200092, China
Comprehensive analysis on the sediment siltation in the upper reach of the deepwater navigation channel in the Yangtze Estuary*
KUANG Cui-ping (匡翠萍), CHEN Wei (陈维)
College of Civil Engineering, Tongji University, Shanghai 200092, China, E-mail: cpkuang@tongji.edu.cn
GU Jie (顾杰)
College of Marine Sciences, Shanghai Ocean University, Shanghai 201306, China
HE Lu-lu (贺露露)
College of Civil Engineering, Tongji University, Shanghai 200092, China
(Received October 5, 2013, Revised January 13, 2014)
The results from both the field measurements and numerical simulation were reported to comprehensively analyze the sediment siltation in the upper reach of the Deepwater Navigation Channel Project in the Yangtze Estuary after the project has been implemented. In this research, firstly some basic information about the river evolution in the Yangtze Estuary is analyzed, including the variations of water depths in the Hengsha Passage and the inlet cross-sections of the North Passage and the South Passage, and changes of diversion ratios of ebb flow and sediment flux in the North Passage and the South Passage. Then the Delft3D-FLOW model is applied to simulate the hydrodynamics and sediment transport in the Yangtze Estuary. This model has been calibrated and the simulated results agree well with the measured data of the tidal levels, flow velocities and suspended sediment concentration (SSC), indicating that the model can well simulate the hydrodynamics and sediment transport of the Yangtze Estuary caused by the Deepwater Navigation Channel Project. The research results show that the development of the Hengsha Passage and decrease of diversion ratio of ebb flow and sediment flux in the North Passage are the main reasons of sediment siltation in the upper reach of the Deepwater Navigation Channel in the Yangtze Estuary.
Yangtze Estuary, Hengsha Passage, deepwater navigation channel, numerical simulation, sediment siltation
Introduction
Estuary is a place where sea and land meet, which links flow and sediment transport between river and sea. Due to estuarine sandbars, the natural water in the estuary is usually shallower than that of inland river and sea. With the development of commodity economy and increase of trade, shipping becomes more and more large-scale and needs deepwater navigation channel. In 1848, the French started regulating the Seine Estuary by constructing two widely spaced long training walls and dredging works in the lower reach of the navigable waterway. In 1863, the Dutch began training the Rhine River through the dredging of a new Rotterdam channel and constructing two dikes. The American managed the Columbia River Estuary and southwest waterway of the Mississippi River Estuary respectively in 1885 and 1904, and the British regulated the Mersey River Estuary in 1890 to form deeper waterway[1].
In China, the general practice for controlling the river mouth sandbars was initiated in the early twentieth century. From 1905 to 1910, a 1395 m long training wall with 3.74 m elevation was completed in the left bank of the Wusong Estuary in Shanghai. In 1959, some measurements were carried out in the Lingdingyang (one of the eight outlets of the Pearl River Estuary). After four times large-scale engineering practices, the water depth reached 11.5 m in August of 2000. In 1980, the renovation was carried out in the Yong River, including building groins and diversion dikes.Between 1989 and 1994, a 5.2 km long emerged dike and 2.75 km long submerged dike were conducted in the Han River Estuary, and then the submerged dike was heightened into emerged dike.
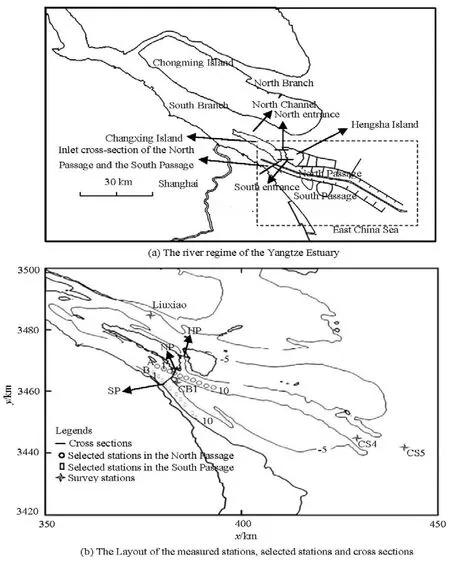
Fig.1 Yangtze Estuary
The North Passage, formed between 1949 and 1954, is the youngest channel among the four outlets of the Yangtze Estuary into the open sea, with a natural water depth of about 6 m. The situation of lacking fairway depth has severely affected its role as a golden channel of the Shanghai Harbor. A lot of researches about the Yangtze Estuary have been carried out, focusing on the impacts of major projects on the hydrodynamics[2], salinity[3], wave[4], sediment transport[5], bed evolution[6]and so on. Several research methods have also been employed in this area during the past 20 years, such as numerical model[7,8], GIS[9], in situ measurement[10], etc.. Since the Deepwater Navigation Channel Project began its construction in 1998, the local area of the Yangtze Estuary has been significantly affected. Many scholars conducted a lot of researches regarding hydrodynamics and sediment characteristics of the Yangtze Estuary. Zhou et al.[11]studied the changes and distributions of the maximum turbidity along the North Passage before and after Phase I of the Deepwater Navigation Channel Project and its influence on the sedimentation in the North Passage. Xie et al.[12]studied the migration behavior of the fine silt particles of dredged sediment after dumping at different locations in the Deepwater Navigation Channel of the Yangtze Estuary. Pan et al.[13]quantitatively discussed the characteristic of erosion and siltation distribution in the North Passage. Manyresearches focused on the impacts of Deepwater Navigational Channel Project based on in situ data and numerical model. However, little research was conducted from the evolution of river regime to explore the reasons of the sediment siltation in the upper reach of the North Passage.
This paper insists of three main parts. Firstly, some measured data are used to study the sediment siltation in the upper reach of the Deepwater Navigation Channel. For this purpose, we have collected in situ data about the changes of water depth in the Hengsha Passage and the inlet cross-section of the North Passage and the South Passage, and changes of diversion ratios of sediment and ebb flow in the North Passage and the South Passage. Secondly, a numerical model of the Yangtze Estuary is established to simulate the tidal current and sediment transport. Finally, the impacts of the V-shaped diversion dike and the Coriolis force on the Deepwater Navigation Channel are briefly discussed.
1. Studied area
The Yangtze Estuary is the seaward end of the Yangtze River, which is the largest river in China with an annual mean freshwater discharge of 28 300 m3/s measured at the Datong Gauging Station from 1950 to 2011. The Yangtze Estuary is a meso-tidal estuary with a mean tidal range of 2.66 m (mainly semi-diurnal tide) at the mouth (measured at the Zhongjun Tide Gauging Station) and a tidal flow velocity of approximately 1 m/s. The annual mean suspended sediment input was 3.886×10⁸t from 1956 to 2009. Sediments in the Yangtze Estuary are mainly composed of fine sand, silt and clay. Geometrically, the Yangtze Estuary is a triple-bifurcation, four-outlet, multi-shoal system, with a length of about 120 km and a width of about 90 km at the mouth (see Fig.1).
In the period of 1998 and 2010, a large-scale Deepwater Navigation Channel Project was carried out in the North Passage of the Yangtze Estuary to improve the navigability. It included the construction of two widely spaced training walls, nineteen long groins and diversion works (see Fig.1(a)). The project was executed in three stages. Phase I (1998-2001) involved the construction of two training walls and ten groins in the North Passage, diversion works at the distributary inlet of the North Passage and the South Passage. Furthermore, the Jiangya North Channel (between the Jiangya Shoal and the Jiuduansha Shoal) was dammed and dredging was executed with an annual maintenance of nearly 1.6×10⁷t. The waterway was deepened to 8.5 m. During phase II (2001-2004), the training walls were extended seawards, five of the earlier constructed groins were lengthened, nine new groins were constructed in the North Passage and the waterway was deepened to 10 m at an annual dredging rate of more than 4×10⁷t. As a part of the overall navigation project, the reclamation project of the Hengsha East Shoal was carried out in Phase II. During Phase III (2006-2010), the depth of the waterway was increased to 12.5 m by the end of 2010 by local adjustment to the engineering works and dredging, and the annual amount of dredging required for maintaining the deep waterway was more than 6× 10⁷m3.
2. Field data analysis
2.1 Effects of the Hengsha Passage on the North Passage
The Hengsha Passage was formed by the heavy floods of 1954. It is located between the Changxing Island and the Hengsha Island (see Fig.1(a)), and is a unique independent passage oriented in the N-S direction in the Yangtze Estuary with the North Channel in its north and the North Passage in its south. The width, length and water depth of this passage are about 1 200 m, 8 000 m and 10 m respectively[14].
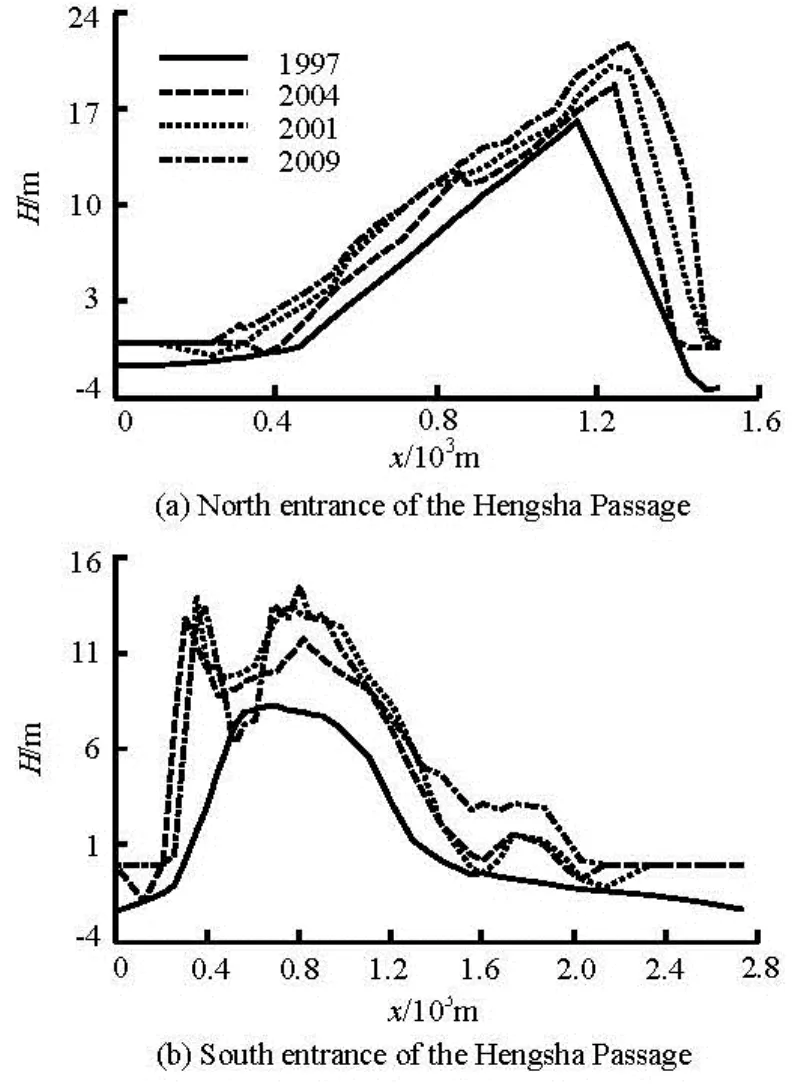
Fig.2 Water depth (H) along the cross-section of the Hengsha Passage from 1997 to 2009[15]
In the recent fifty years, the progress of the Hengsha Passage experienced three stages: scouredexpanded stage, silted at mid-segment stage, and narrowed-deepened stage[14]. The essential reason of the channel development was the phase difference caused by tidal wave deformation due to estuarine bifurcation, which led to the water surface slope along the passage. The tidal range of the north entrance of the passage ishigher than that of the south entrance. The difference of water level between the north and south entrance was larger during the flood season than that during the dry season, and larger during the spring tide than that during the neap tide. The difference of the tidal range and phase affects flow velocity greatly. When the cross-section water surface slope of the passage decreases, the flow velocity slows down, leading to the siltation of suspended sediment. Contrarily, the river bottom is scoured. Especially the deep trough of the North Passage moved southward, which is beneficial for the sediment and water exchange between the North Channel and the North Passage, and plays an important role in increasing the water depth in the Hengsha Passage.
Figure 2 shows the water depth along the crosssection of the Hengsha Passage from 1997 to 2009. It can be seen from Fig.2(a) that in 1997, the width of the north cross-section of the Hengsha Passage was 1 000 m, and the river was of a V-shape. The main channel was close to the Hengsha Island with the maximum water depth of 14 m. In 2001, the cross-section of north entrance was scoured entirely at the range of 1 m-2 m, and the scour was deeper in the area close to the Hengsha Island than that close to the Changxing Island. The main channel shifted toward the Hengsha Island about 100 m. In 2004, the cross-section of north entrance was scoured entirely with the main channel shifting toward the Hengsha Island, and the width was broadened about 200 m. In 2009, the cross-section of north entrance was further scoured, and the thalweg was scoured about 2 m. Generally speaking, the crosssection of north entrance was scoured entirely and the main channel shifted toward the Hengsha Island during 1997 to 2009. Figure 2(b) shows that the width of the south cross-section of the Hengsha Passage was 1 200 m with a maximum water depth of 8 m in 1997. The river pattern exhibited a U-shape, and the main channel was close to the Changxing Island. In 2001, the cross-section of south entrance was scoured entirely with the width being broadened about 1 800 m. The cross-section experienced erosion and the near shore was more heavily scoured. The central part of the channel was high and convex, and turned into two V-shaped deep grooves. The maximum water depth exceeded about 12 m. In 2004, the cross-section of south entrance continued to be scoured entirely. The deep groove shifted downward, and the central part of the cross-section was most heavily scoured. In 2009, the two deep grooves shifted downward a little, but the central part of the cross-section experienced significant deposition with siltation thickness of about 4 m.
The cross-section morphology of the Hengsha Passage changed sharply in 2009, which may be related to the building of the Changxing Submerged Dike in 2007. The project of construting the Changxing Submerged Dike is a part of Phase III of the Deepwater Navigation Channel Project, which is located on the sand spit in the southeast of the Changxing Island with a length of 1 840 m. Because of the obstruction of submerged dike, the water level near the Changxing Island is higher than that near the Hengsha Island during the ebb tide, and causes the transverse circulation which carries the sediment from eastern bank to the central part and silts there. The deepening of the Hengsha Passage implies that more flow passes the Hengsha Passage and less flow into the North Passage which may cause the sediment siltation in its upper reach.
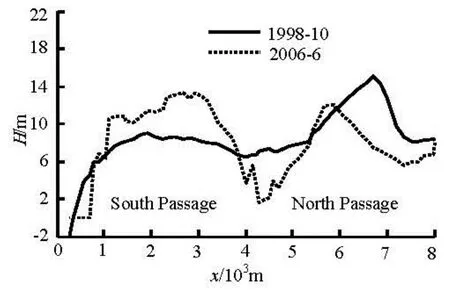
Fig.3 Water depth along the inlet cross-section of the North Passage and the South Passage in 1998 and 2006[16]
2.2 Changes of water depth in the inlet cross-section of the North Passage and the South Passage
Figure 3 demonstrates the water depth along the inlet cross-section of the North Passage and the South Passage in 1998 and 2006. In 1998, the main channel was located at the central of the North Passage with the maximum water depth up to 15 m (less than 9 m in the South Passage), and the wetted cross-section area of the North Passage was larger than that of the South Passage, indicating that the North Passage had a better developing of river regime than the South Passage. The inlet section of the North Passage in 2006 was silted and main channel shifted southward with the maximum water depth of 12 m from 15 m in 1998. Meanwhile, the inlet section of the South Passage was universally scoured with the maximum water depth of over 13 m from less than 9 m in 1998. Accordingly, the wetted cross-section area increased in the South Passage and decreased in the North Passage, leading to the cross-section area in the South Passage larger than that in 2006.
2.3 Changes of diversion ratios of ebb flow in the North Passage and the South Passage
Figure 4 is the diversion ratios of ebb flow in the South Passage and the North Passage from 1998 to 2006. The diversion ratios of ebb flow were about 60% and 40% in the North Passage and the South Passage respectively before the Deepwater Navigation Channel Project constructed in 1998. There was an obviously increasing trend in the diversion ratios ofebb flow in the South Passage and decreasing trend in the North Passage respectively after the engineering was ended, and especially sharp changes appeared in the first two years. The diversion ratios of ebb flow of both the North Passage and the South Passage were about 50% in August 2000. Thereafter, the diversion ratio of ebb flow in the South Passage was greater than that in the North Passage. In 2006, the diversion ratios of ebb flow in the South Passage and the North Passage were 55% and 45% respectively. It is obvious that the river regime of the South Passage shows a good trend.
Fig.4 Diversion ratios of ebb flow (r) in the South Passage and the North Passage from 1998 to 2006
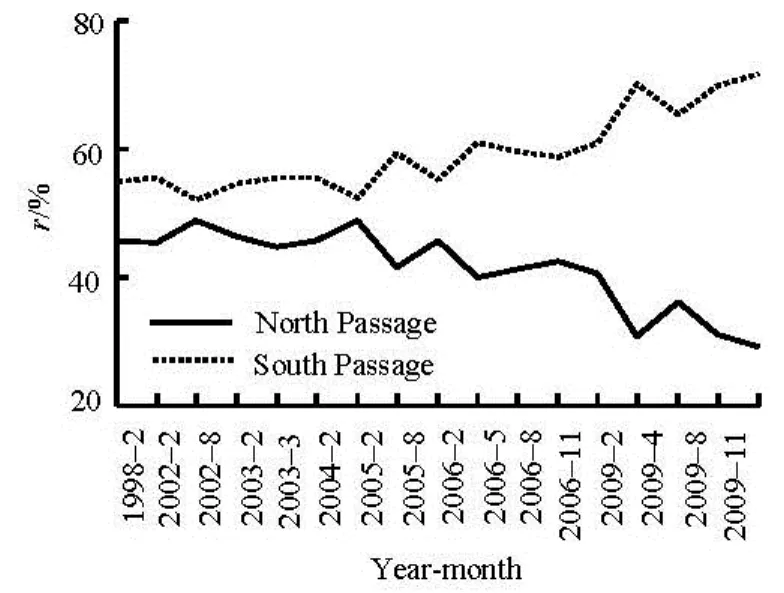
Fig.5 Diversion ratios of sediment in the North Passage and the South Passage from 1998 to 2009
2.4 Changes of diversion ratios of sediment flux in the North Passage and the South Passage
Diversion ratios of sediment flux in the North Passage and the South Passage from 1998 to 2009 are showed in Fig.5. The diversion ratios of sediment were calculated based on the averaged SSC in the cross-section including shoals and deep trough. The data were measured using the acoustic Doppler current profilers (ADCP) by Survey Bureau of Hydrology and Water Resources of Yangtze River Estuary[17]. Before the Deepwater Navigation Channel constructed in 1998, the diversion ratios of sediment flux in the North Passage and the South Passage were 45% and 55% respectively. In August 2002, the diversion ratio of sediment in the North Passage was the same as that in the South Passage with both about 50%. After that the diversion ratio of sediment in the North Passage decreased and in the South Passage increased. In August of 2004, the diversion ratio of sediment in the North Passage again was the same as that in the South Passage with both about 50%. After the completion of Phase II in 2004, the diversion ratio of sediment in the North Passage always presented a decreasing trend and decreased to 30%, and the diversion ratio of sediment in the South Passage increased to 70% in November 2009. It can be concluded that the sediment in the South Channel of the Yangtze River is mainly transported to the open sea via the South Passage.
3. Numerical model
3.1 Computational domain and model grid
The computational domain covers the whole Yangtze Estuary. Landward boundary of the Yangtze Estuary is at Jiangyin, the upper limit of tidal current. There are three open sea boundaries, respectively the east one at 123oE, the north one at 33oN and the south one at 30o30'N. Curvilinear grids (see Fig.6) were generated by Delft3D-RGFGRID with a high grid resolution in the North Passage of the Yangtze Estuary. The total number of grids is 658×305. The grid size ranges from 60 m in the estuary to 700 m in the open sea.
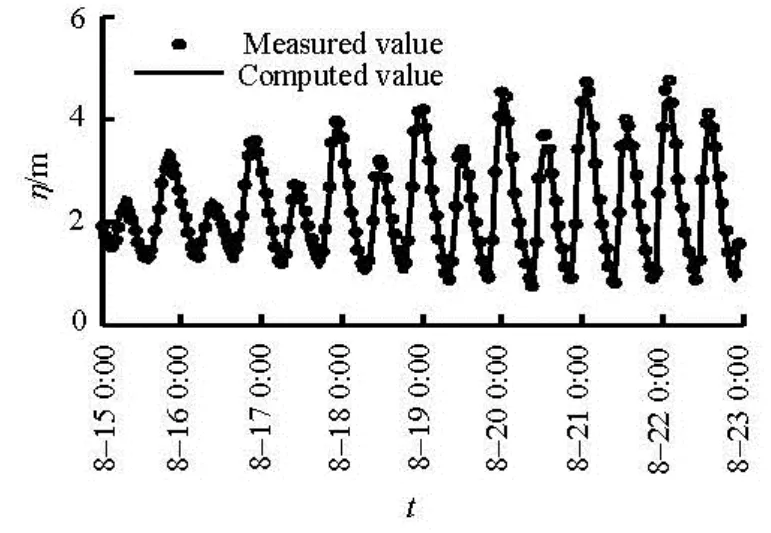
Fig.6 Calibrations of the tidal level ()η in 2005
3.2 Computational procedure and parameter settings
Delft3D is a numerical model based on the finite difference method. A staggered grid was used to discretize the 3-D shallow water equations in space. The alternating direction implicit method (ADI method) was applied for the time integration of 3-D shallow water equations. The extended ADI method and a central difference scheme were applied for the horizontal and vertical convective terms respectively. The cyclic method was applied for the spatial discretization of the horizontal convective terms of the transport equation. For the time integration of the horizontal diffusion term, the Crank-Nicholson method was applied,source terms were integrated explicitly. In the vertical direction, the fluxes were discretized with a central difference scheme, the time integration is fully implicit. Further numerical details can be found in the user manual of Delft3D-FLOW.
Hydrodynamic processes in this model include tidal flow and sediment transport. The jetties and groins for the deepwater navigation channel project were set up in the model as Current Deflection Walls which allow the water to flow over when the water level were high enough. The time step of the model was 60 s. The Manning coefficient was adopted as the roughness coefficient in a range from 0.010 to 0.016, which was calculated in view of the empirical formula with the function of water depth that roughly responses to river bed roughness.
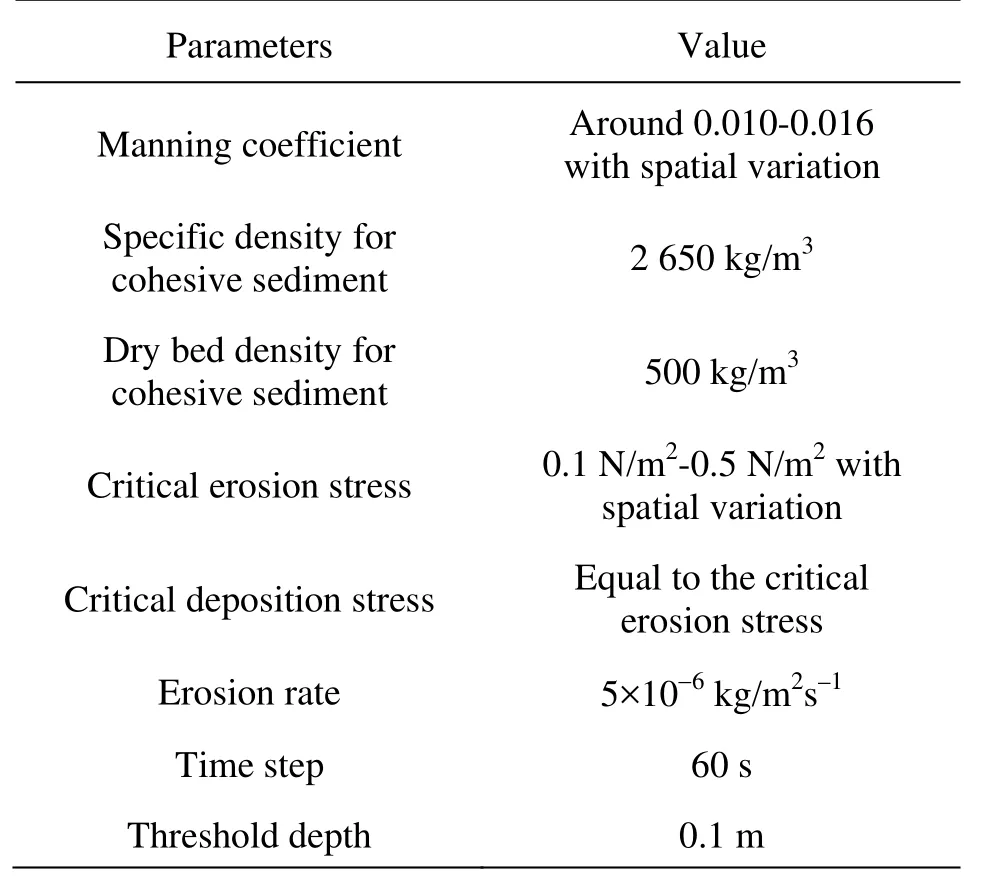
Table 1 Model parameters
This model takes cohesive sediment into account, with the main sediment composition in this area having a D50of 8×10⁻⁶m. The setting velocities had an averaged value of 4×10⁻⁴m/s. A constant value of 10 m2/s was adopted for both horizontal eddy viscosity and diffusivity. Parameter settings details are listed in Table 1. The wetting and drying technique was used in this model to predict the water covering and uncovering processes in the intertidal zones[18]. The wetting and drying were performed at grid cell centers for water level points and at grid cell faces for velocity points. A specified threshold depth was set to 0.1 m, i.e., a grid cell was flooded if the water depth was larger than the specified threshold depth and dried if the water depth was smaller than half this value.
3.3 Initial and boundary conditions
Open boundary conditions were specified as time-varying tidal levels at three open sea boundaries. At the landward boundary, monthly-averaged runoff and sediment concentration were determined from a long time series of field data. Tidal levels were derived from 8 tidal constituents, i.e., M2, K2, S2, N2, K1, P1, O1, and Q1. The initial tidal level, flow velocity and sediment concentration were defined as 2 m, 0 m/s and 0.2 kg/m3respectively. The observed monthly mean value of 0.03 kg/m3for sediment concentration was prescribed along the offshore boundaries.
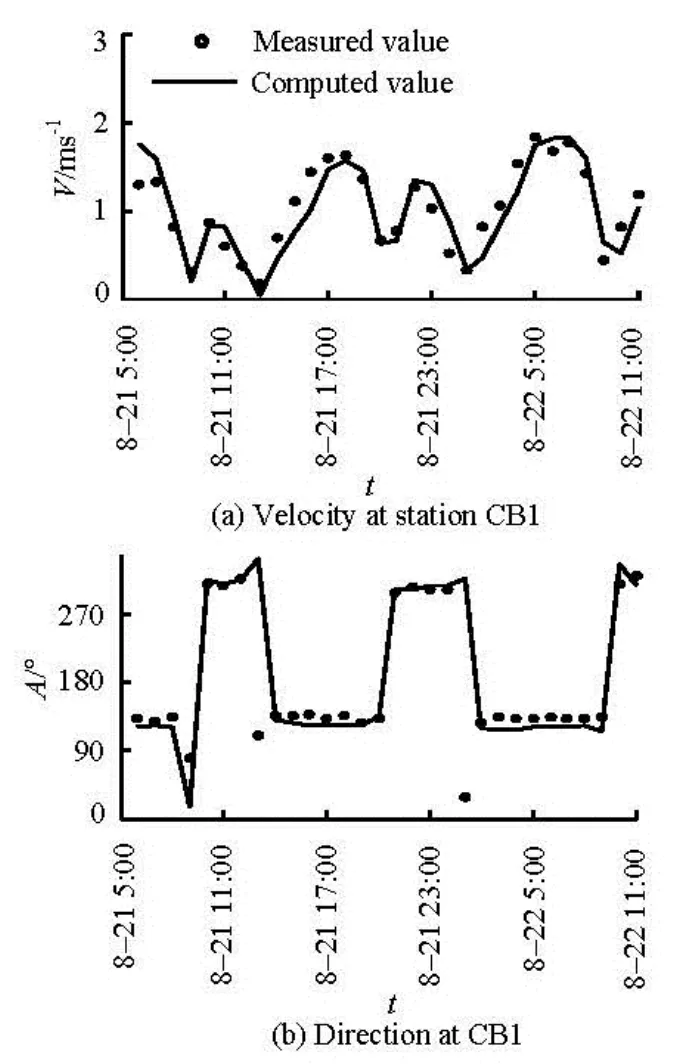
Fig.7 Verifications of the flow velocity (V) and direction (A) in 2005
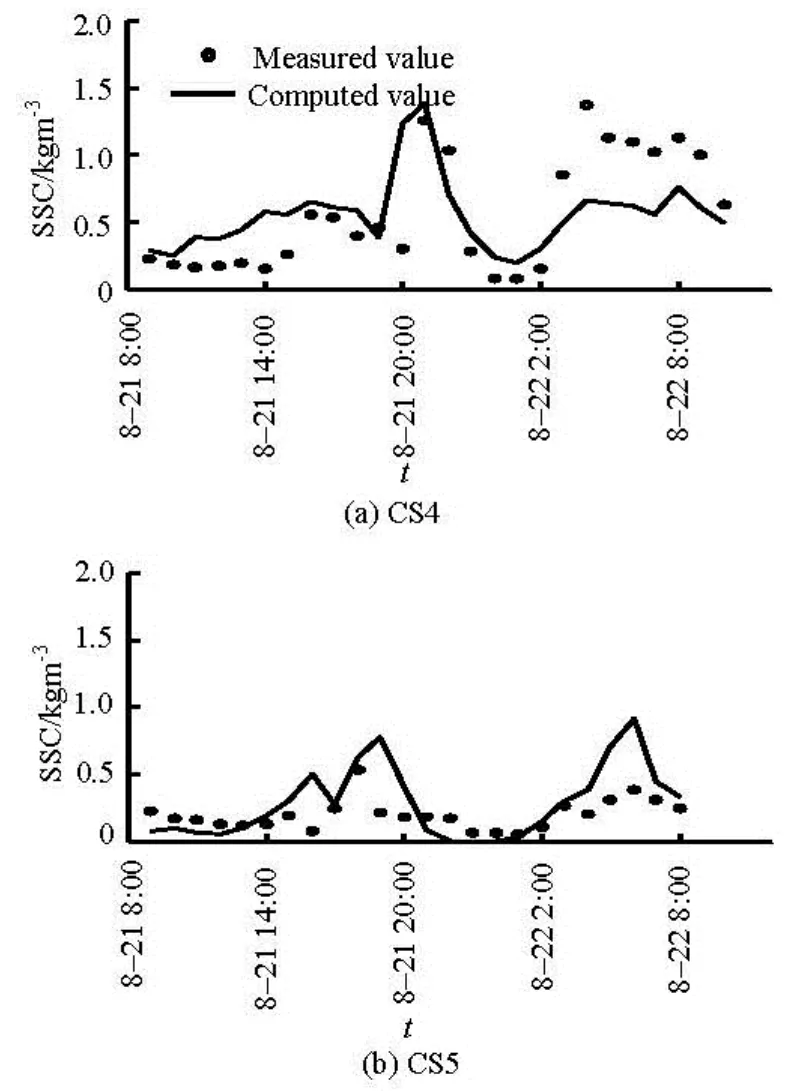
Fig.8 Verifications of the SSC (2005)
3.4 Model calibration
This numerical model has been calibrated with the measured tidal level from 00:00 of August 15 to 00:00 of August 23, 2005 and the measured tidal velocity and sediment concentration data from 09:00 of August 19 to 08:00 of August 20, 2005[19]. The layouts of the survey stations are shown in Fig.1(b). Calibration of the tidal level is shown in Fig.6, and the tidal current velocity and suspended sediment concentration (SSC) are showed in Figs.7 and 8 respectively.
The Nash-Sutcliffe efficiency coefficient (E) was used to evaluate the model performance against the measured tidal level, flow velocity magnitude, direction and SSC time series. E is defined as[20]
where Xmodis the computed result, Xobsis in situ observed data,is the mean value of in situ observed data, N is the number of in situ observed data.
The predictive efficiency of a model is classified as excellent for E larger than 0.65, very good for E in the range of 0.5 to 0.65, good for E in the range of 0.2 to 0.5 and poor for E less than 0.2. The calculated values of E show the model prediction is excellent with E ranging 0.96-0.99 for tidal levels, 0.89-0.96 for flow velocity magnitudes, 0.75-0.98 for flow velocity directions and 0.21-0.45 for SSC. Therefore, this model shows reliable performance in simulating hydrodynamics and sediment transport of the Yangtze Estuary.
4. Computed results analysis
The calibrated model was applied to analyze the hydrodynamics and sediment transport in the North Passage, the South Passage and their adjacent areas. The distributions of flow and sediment concentration were analyzed to explain why the sediment siltation takes place in the upper reach of the Deepwater Navigation Channel. Some selected stations and cross-sections are shown in Fig.1(b).
4.1 Analysis of flow fields in the Hengsha Passage and the North Passage
In order to comprehensively clarify the impacts of the Hengsha Passage on the hydrodynamics of the North Passage, the flow fields at the instants of maximum flood and ebb in the Yangtze Estuary are showed in Fig.9. At the maximum flood (Fig.9(a)), the currents enter into the South Passage and the North Passage from the open sea, with the flow velocity in the South Passage obviously higher than that in the North Passage. The flows reach the upper reaches of the North Passage and the South Passage, then parts of current in the South Passage backflow into the North Passage. It makes the upstream of current in the North Passage be blocked into the south entrance of the Hengsha Passage, and enters into the North Channel along the Hengsha Passage with higher velocity. From the whole flow field, it can been seen that the current is hindered due to the disorder flow state, and especially the current in the North Passage from the south entrance of the Hengsha Passage to the upper reach of the North Passage is restrained to a certain degree. At the maximum ebb (Fig.9(b)), the currents enter into the North Passage and the South Passage via the South Channel, and the ebb current is larger than the flood current due to the influence of the upstream runoff. Furthermore, parts of current in the North Channel enter into the North Passage via the Hengsha Passage, and this part of current has a more significant impact on the North Passage than on the Hengsha Passage. It can also be seen from the flow fields that the flow velocity in the upper reach of the North Passage is generally lower than that in the South Passage.
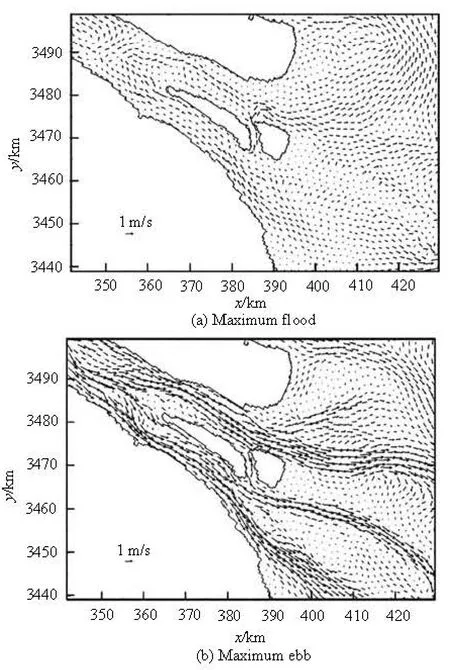
Fig.9 Flow fields at the instants of the maximum flood and ebb in the Yangtze Estuary
4.2 Velocity and SSC distributions along the North Passage and the South Passage
The computed peak flood and ebb velocity andSSC distributions along the upper reaches of the North Passage and the South Passage at a tidal cycle are showed in Fig.10 (at the positions shown in Fig.1(b)). The peak ebb velocity is significantly higher than the peak flood velocity in the middle and lower reaches while it is slightly lower in upper reach of the North Passage. A decrease of peak velocity occurs in the A2-A4 reaches, where the peak SSC also decreases. The A2-A4 locates the North Passage above the Hengsha Passage, where deposition is experienced. The peak velocity along the South Passage is higher than that along the North Passage with a value of about 5%, however, the peak SSC along the South Passage is far greater than that along the North Passage with approximately 4 times. The peak SSC increases along the South Passage from the upstream to the downstream. It can be concluded that the South Passage is in an absolutely erosion state.
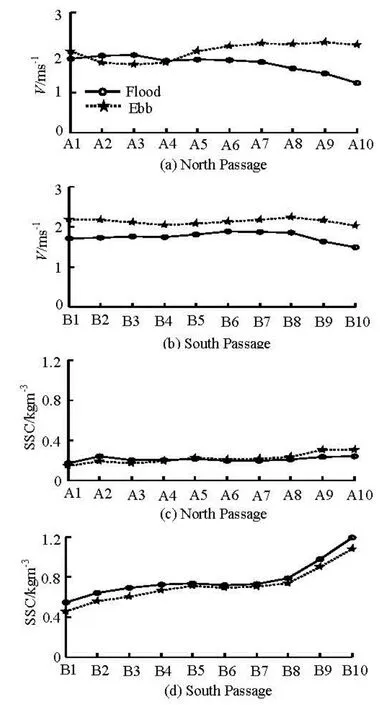
Fig.10 Computed peak flood and ebb velocities and SSC distributions along the upper reaches of the North Passage and the South Passage in a tidal cycle
4.3 Analysis on flow and sediment flux rate in Hengsha Passage, South Passag and North Passage
The computed flood and ebb discharges for the Hengsha Passage, South Passage and North Passage are showed in Table 2. In the flood period, the averaged discharges of the South Passage and the North Passage are 26 333 m3/s and 10 990 m3/s respectively, and the ratio of the averaged discharges between the South Passage and the North Passage is 2.5:1. The flood volume of the South Passage is obviously larger than that of the North Passage. The averaged discharge of the Hengsha Passage is 7 705 m3/s, and the ratio of the averaged discharge between the Hengsha Passage and the North Passage is 0.7:1, which indicates that the flood volume of the Hengsha Passage is also large. In the ebb period, the averaged discharges of the South Passage and the North Passage are 47 187 m3/s and 28 263 m3/s respectively, and the ratio of the averaged ebb discharge between the South Passage and the North Passage is 1.7:1, which shows that the ebb volume of the North Passage is also much smaller than that of the South Passage. The averaged ebb discharge of the Hengsha Passage reaches 10 213 m3/s, and the ratio of the averaged ebb discharge between the Hengsha Passage and the North Passage is 0.36:1, which shows that the ebb current of the Hengsha Passage also accounts for a larger proportion in the entire flow flux of the North Passage.
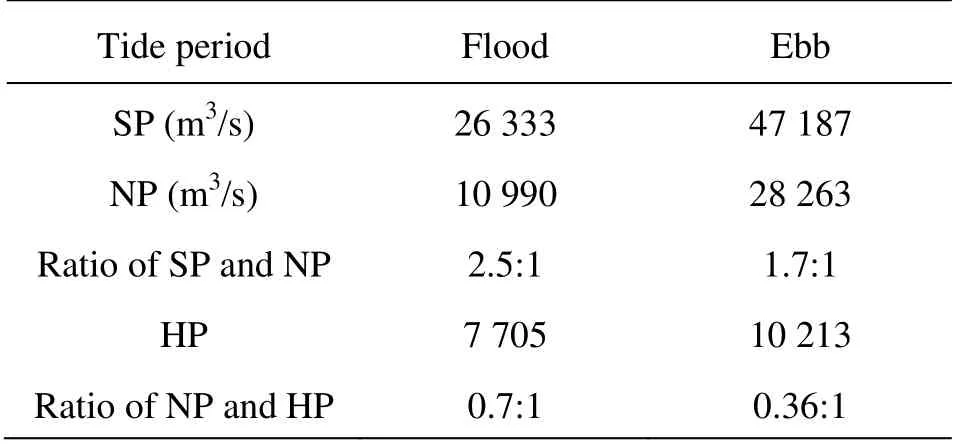
Table 2 Computed flood and ebb discharges and ratio in Hengsha Passage, South Passage and North Passage
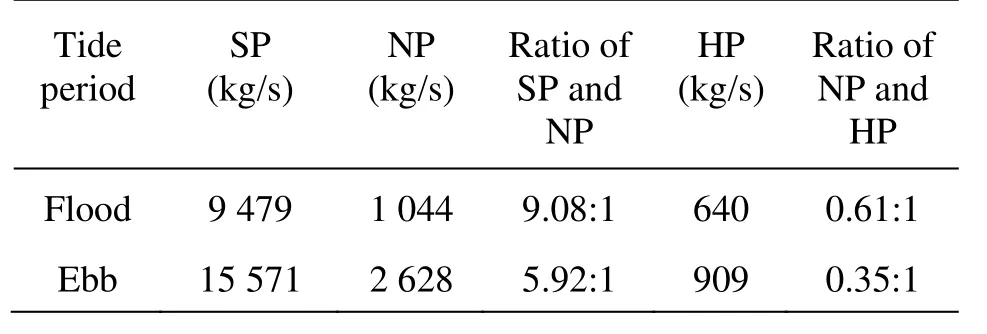
Table 3 Computed flood and ebb sediment flux rates of the Hengsha Passage, the South Passage and the North Passage
Table 3 presents the computed flood and ebb sediment flux rates of the Hengsha Passage, the South Passage and the North Passage. During the flood tide, the averaged sediment flux rates of the South Passage and the North Passage are 9 479 kg/s and 1 044 kg/s respectively, and the ratio of the averaged sediment flux rates between the South Passage and the North Passage is 9.08:1. The flood sediment transport capa-city of the South Passage is much stronger than that of the North Passage, and the river bed of the South Passage is easily scoured. The averaged sediment flux rate of the Hengsha Passage is 640 kg/s, and the ratio of the averaged sediment flux rate between the Hengsha Passage and the North Passage is 0.61:1, which indicates that the Hengsha Passage account great proportion for flood tide of the North Passage. During the ebb tide, the averaged sediment flux rates of the South Passage and the North Passage are 15 571 kg/s and 2 628 kg/s respectively, and the ratio of the averaged sediment flux rates between the South Passage and the North Passage is 5.92:1, which shows that the ebb sediment transport capacity of the North Passage is also much weaker than that of the South Passage. The averaged sediment flux rate of the Hengsha Passage reaches to 909 kg/s, and the ratio of the averaged sediment flux rate between the Hengsha Passage and the North Passage is 0.35:1, which shows that the Hengsha Passage may prevent parts of sediment of the upper reach of the North Passage entering the open sea.
From the above computed results, it can been seen that the Hengsha Passage connects the North Channel and the North Passage, which makes an impact on the development of river regime of the North Passage, especially in the upper reach above the Hengsha Passage. It results in the fact that the flow velocity and sediment flux rate of the North Passage above the Hengsha Passage is smaller than those of the South Passage. However, the decreased velocity and sediment flux rate of the North Passage has an adverse influence on the river regime of the North Passage, and gives rise to the sediment siltation in the upper reach of the North Passage.
5. Discussions
The Yangtze Estuary is a meso-tidal estuary, and the tide is irregular semi-diurnal tide with diurnal inequality phenomenon. Due to the influence of the runoff, the ebb current is generally larger than that of the flood current, forming the dominant ebb current channels, such as the North Channel and the South Channel of the South Branch. The Coriolis force makes the ebb flow move southward and the flood flow move northward, causing the different ebb flow volumes through different branches, for example, the tidal volume of the South Branch and the South Channel is generally larger than that of the North Branch and the North Channel respectively. Generally speaking, the south branches are scoured and broadened with a developmental trend, while the north branches are silted and narrowed with a decline trend.
The direction of the south branch of V-shaped diversion dike at the head of the Deepwater Navigation Channel is slightly northward, which is in accord with the direction of the flow influenced by the Coriolis force. On the one hand, because of the development (being broadened and deepened) of the Hengsha Passage, in the upper reach of the North Passage, the flood flow volume decreases due to more flow diverted by the Hengsha Passage, and the ebb flow velocity decreases due to blocking of the entering flow from the Hengsha Passage. On the other hand, the V-shaped diversion dike and the Coriolis force enhance the ebb flow into the South Passage and the development of the South Passage, causing the sediment to be carried to the area near to the Changxing Island. Sediment is deposited in the upper reach of the North Passage due to the reduction of the flow velocity.
6. Conclusion
This paper details the Deepwater Navigation Channel of the Yangtze Estuary. The measured data have been applied to explore the sediment siltation in the upper reach of the Deepwater Navigation Channel, including the changes of water depth in the Hengsha Passage and the inlet cross-section of the North Passage and the South Passage, and changes of diversion ratios of sediment and ebb flow in the North Passage and the South Passage. For further studying the reason for the sediment siltation in the upper reach of the Deepwater Navigation Channel, a hydrodynamic numerical model of the Yangtze Estuary based on Delft3D-FLOW is established. The model is verified using the field measured tidal level, flow velocity magnitude, direction and SSC. The main reasons of sediment siltation in the upper reach of the North Passage behind the Deepwater Navigation Channel are: (1) The diversion ratio of ebb flow in the North Passage decreases about 15%, while increases around 15% in the South Passage, (2) The diversion ratio of sediment flux in the South Passage increases around 20%, and more sediment are transported to open sea via the South Passage, (3) The velocities and SSC in the North Passage are both lower than those in the South Passage, which indicates the hydro-sediment dynamics of the North Passage are weakened, (4) The Hengsha Passage connects the water exchange between the North Channel and the North Passage, which makes an adverse influence on hydrodynamics of the North Passage above the Hengsha Passage.
[1] THOMAS C., SPEARMAN J. and TUMBULL M. Historical morphological change in the Mersey Estuary[J].Continental Shelf Research,2002, 22(11-13): 1775- 1794.
[2] CHEN Wei, GU Jie and QIN Xin et al. Numerical analysis of the sediment deposition in the upper reach of the deepwater navigation channel in the ChangjiangRiver Estuary[J].Chinese Journal of Hydrodynamics,2012, 27(2): 199-207(in Chinese).
[3] LIU Hua, WU Wei and HE You-sheng et al. Studies on numerical modeling of water environment in the Yangtze Estuary-numerical simulation of hydrodynamic flows[J].Chinese Journal of Hydrodynamics.2000, 15(1): 17-30(in Chinese).
[4] XU Fu-min and ZHANG Chang-kuan. Study of the effect of storm waves on the rapid deposition of the Yangtze River Estuary channel[J].Chinese Journal ofHydrodynamics,2004, 19(2): 137-143 (in Chinese).
[5] LIU G., ZHU J. and WANG Y. et al. Tripod measured residual currents and sediment flux: Impacts on the silting of the Deepwater Navigation Channel in the Changjiang Estuary[J].Estuarine, Coastal and ShelfScience,2011, 93(3):192-201.
[6] KUANG C., LIU X. and GU J. et al. Numerical prediction of medium-term tidal flat evolution in the Yangtze Estuary: Impacts of the Three Gorges Project[J].Conti-nental Shelf Research,2013, 52: 12-26.
[7] ZHANG Wan-shun, ZHAO Yan-xin and XU Yan-hong et al. 2-D numerical simulation of radionuclide transport in the Lower Yangtze River[J].Journal of Hydro-dynamics,2012, 24(5): 702-710.
[8] WANG Y., SHEN J. and HE Q. A numerical model study of the transport timescale and change of estuarine circulation due to waterway constructions in the Changjiang Estuary, China[J].Journal of Marine Sys-tems,2010, 82(3): 154-170.
[9] LI Hong-ling, ZHANG Ying. Research on RS and GIS based visualization of Deepwater Channel in Changjiang Estuary[J].China Harbour Engineering,2005, (5): 12-14 (in Chinese).
[10] LUO Xiao-feng, CHEN Zhi-chang. Analysis of salinity’s variation in the North Channel of the Yangtze Estuary[J].Port and Waterway Engineering,2006, (11): 79-82(in Chinese).
[11] ZHOU Hai, ZHANG Hua and RUAN Wei. Distribution of maximum turbidity and its influence on the sedimentation of north passage before and after the construction of the first stage of Yangtze Estuary Deepwater Channel Regulation Project[J].Journal of Sediment Research,2005, (5): 58-65(in Chinese).
[12] XIE Rui, WU De-an and YAN Yi-xin et al. Fine silt particle pathline of dredging sediment in the Yangtze River deepwater navigation sediment in the Yangtze river deepwater navigation channel based on EFDC model[J].Journal of Hydrodynamics,2010, 22(6): 760-772.
[13] PAN Ling-zhi, DING Ping-xing and GE Jian-zhong et al. Analysis of influence of Deep Waterway Project on morphological change in North Passage of Changjiang Estuary[J].Journal of Sediment Research,2011, (5): 51-59(in Chinese).
[14] YUN Cai-xing.Basic law of recent evolution of estuary[M]. Beijing, China: China Ocean Press, 2004(in Chinese).
[15] CHENG Hai-feng, LIU Jie and ZHAO De-zhao. Analysis of river bed evolution and prediction of its trend for Hengsha Passage[J].Journal of Waterway andHarbor,2010, 31(5): 365-369(in Chinese).
[16] LIU Jie, CHEN Ji-yu and XU Zhi-yang. River-bed evolution in the braided reach of the south and north passage after implementing Yangtze estuary deepwater navigational improvements[J].Advance in Water Scie-nce,2008, 19(5): 605-612(in Chinese).
[17] YANG Ting, TAO Jian-feng and ZHANG Chang-kuan et al. Analysis on annual variation of diversion ratio of flow and sediment in Yangtze River Estuary after regulation project[J].Yangtze River,2012, 43(5): 84-88(in Chinese).
[18] GUO Y., WU X. and PAN C. et al. Numerical simulation of the tidal flow and suspended sediment transport in the Qiantang Estuary[J].Journal of Waterway, Port, Coastal and Ocean Engineering,2012, 138(3): 192- 203.
[19] SUN Bo. Numerical study on the impact of Three Gorges and South-Branch Water Transfer Project on saline wedge of the Yangtze River Estuary, Shanghai[D]. Master Thesis, Shanghai, China: Tongji University, 2009(in Chinese).
[20] ALLEN J, SOMERFIELD P. and GILBERT F. Quantifying uncertainty in high-resolution coupled hydrodynamic-ecosystem models[J].Journal of Marine Systems,2007, 64(1-4): 3-14.
10.1016/S1001-6058(14)60033-0
* Project supported by the Key Subject Foundation of Shanghai Education Committee (Grant No. J50702), the National Key Basic Research Development Program of China (973 Program, Grant No. 2012CB957704).
Biography: KUANG Cui-ping (1966-), Female, Ph. D., Professor
GU Jie, E-mail: jgu@shou.edu.cn

- 水动力学研究与进展 B辑的其它文章
- Effect of compressive stress on the dispersion relation of the flexural–gravity waves in a two-layer fluid with a uniform current*
- Coupled hydroelastic vibrations of an elliptical cylindrical tank with an elastic bottom*
- Experimental investigations of transient pressure variations in a high head model Francis turbine during start-up and shutdown*
- Improved conservative level set method for free surface flow simulation*
- Capillary effect on the sloshing of a fluid in a rectangular tank submitted to sinusoidal vertical dynamical excitation*
- Two-phase air-water flows: Scale effects in physical modeling*