
The extraction and smoothing algorithms for γ-ray spectrum of a CdZnTe detector system
2014-08-05 09:13XUPeng许鹏WANGSong王宋CAIXingHui蔡星会LIRuSong李如松andHUOYongGang霍勇刚
Nuclear Science and Techniques 2014年5期
XU Peng(许鹏),WANG Song(王宋),,CAI Xing-Hui(蔡星会),LI Ru-Song(李如松),and HUO Yong-Gang(霍勇刚)
1Xi’an Research Institute of Hi-Tech,Xi’an 710025,China
The extraction and smoothing algorithms for γ-ray spectrum of a CdZnTe detector system
XU Peng(许鹏),1WANG Song(王宋),1,∗CAI Xing-Hui(蔡星会),1LI Ru-Song(李如松),1and HUO Yong-Gang(霍勇刚)1
1Xi’an Research Institute of Hi-Tech,Xi’an 710025,China
The extraction algorithms for pulse amplitude and smoothing of energy spectrum have a great influence on energy spectrum of γ-rays during the digital detection and analysis procedure.For a CdZnTe digital γ detector system,different extraction algorithms for pulse amplitude and smoothing of energy spectrum are discussed in this paper.The results show that extraction of pulse amplitude using the first-order derivative method and smoothing of energy spectrum using the wavelet transformation method may obtain energy spectrum with good performance.
Pulse amplitude extraction,Energy spectrum smoothing,Optimization algorithm
I.INTRODUCTION
Cadmiumzinctelluride(CdZnTe)digitalγdetectorsystem is composed of a CdZnTe detector,a high speed data acquisition card and relevant software[1,2].The data acquisition card receives analog signals from the detector and converts them into digital signals[3].The software extracts the signal amplitude,analyzes the statistics,and outputs the energy spectrum.The energy spectrum depends on the extraction algorithm and statistical characteristics of the physical procedures[4].For obtaining desired CdZnTe γ-spectra,different algorithms to extract the pulse amplitude and to smoothing the energy spectrum,and the algorithm optimization,are investigated in this paper.
II.METHODOLOGY
The method to obtain the pulse amplitude affects the peak position and energy resolution of the spectrum.We studied three amplitude extraction algorithms to find a suitable one.
A.Amplitude extraction algorithms
1.Extremum method(Fig.1(a))
In this method,each pulse maximumsymaxand pulse minimumyminare extracted,andA=0.9(ymax−ymin)is the pulse amplitude,consideringtheimpactofnoisesandbackflushing. The energy spectrum is obtained by statistically treating all the pulse amplitudes.
2.First derivative method(Fig.1(b))
Using the first derivative of pulse amplitudes,channel addresses of the maximum values can be achieved[5].Thechannel addresses oft1sandt1bin Fig.1(a)corresponding to zero value of the first derivative are the initial and final channel,respectively.The amplitude valuesAcan be extracted from the addresses of(t1s,y1s)and(t1b,y1b)of the original pulses:A=y1s−y1b.
3.Second derivative method(Fig.1(c))
The channel addresses of the maximum and minimum values of the second derivative amplitudes are obtained.The initial and final channel addresses oft2sandt2bin Fig.1(a) are acquired.The amplitude valuesAcan be extracted from the addresses of(t2s,y2s)and(t2b,y2b)of the original pulses:A=y2s−y2b.
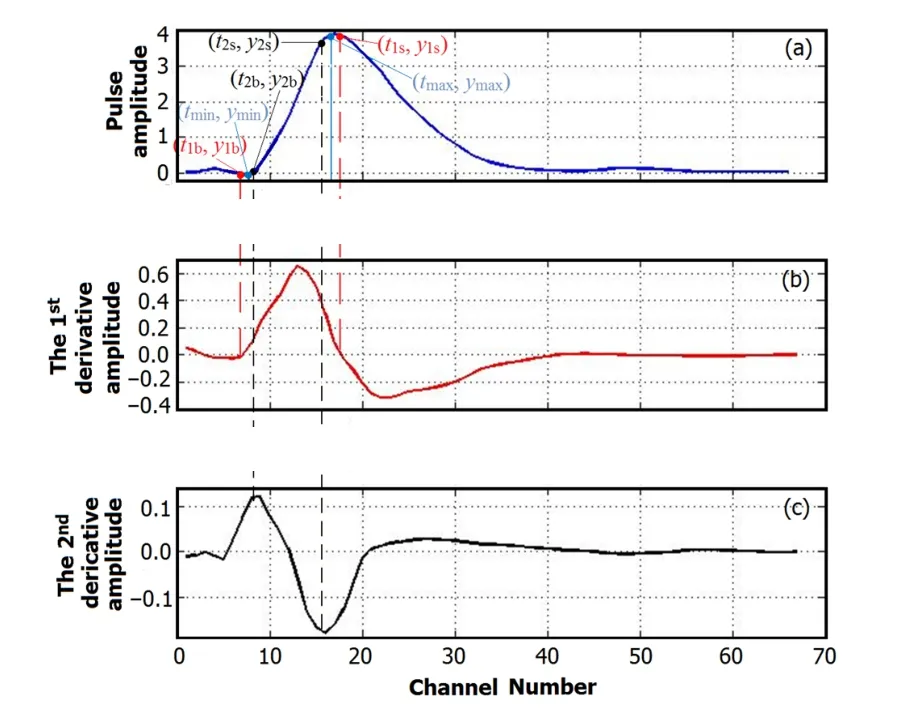
Fig.1.(Color online)Illustration of the methods.(a)original pulse, (b)the first derivative pulse,(c)the second derivative pulse.
B.Filtering algorithm for energy spectrum
1.Wavelet transformation
Wavelet transformation is applied to decompose and reconstruct the pulse signals[6].To suppress signal noises inthe reconstruction process,coefficients of the branches with larger noise are reduced,while coefficients of the branches with larger signal feature are kept[7].The processes of suppressing noise are as follows[8–10]:
(1)The sym4 wavelet basis function is applied to decompose the original signals into three parts.
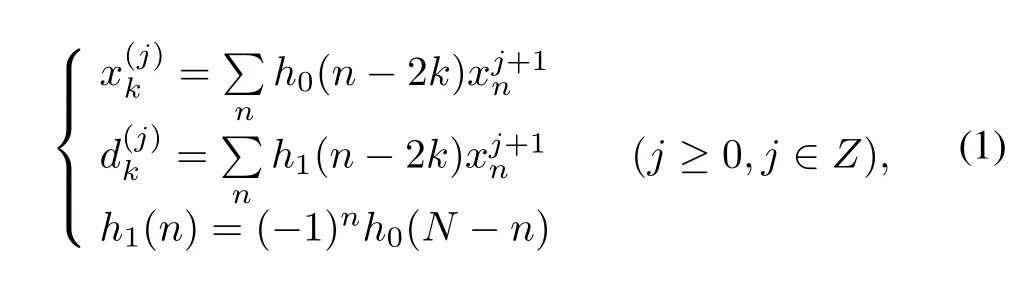
whereandare respectively the coefficients of low and high frequencies under the decomposition scale ofj.h0(n)andh1(n)are the coefficients of low-pass filter and high-pass filter.
(2)Soft threshold method is applied to contract the high frequency coefficients of the three parts.
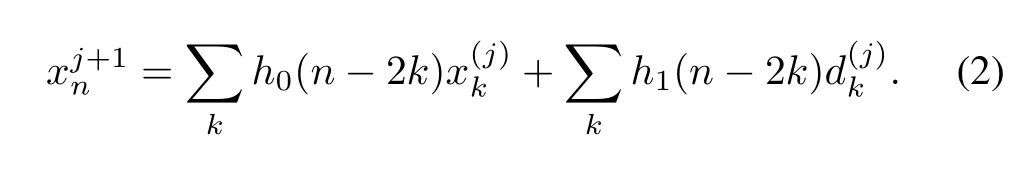
(3)According to the low frequency coefficients for the third parts and the high frequency coefficients for the three parts treated by the threshold values,the wavelet reconstruction is performed to restore the original signal. Wavelet reconstruction formula is given in Eq.(2):
2.Finite impulse response(FIR)filter
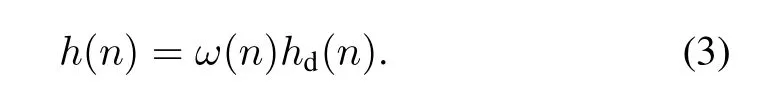
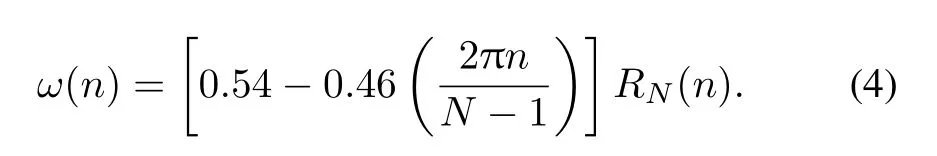
The basic idea of FIR filter is separating the low frequency signals from high frequency noises with an appropriate window function and cut-off frequency[11].With an ideal filter frequency responseHd(ejω),an FIR filter frequency responseHd(ejω)=h(n)e−jω(n=0→N−1)is applied to approachHd(ejω).A limited sequence of window functionω(n)is used to cut offhd(n):
In this paper,the sampling frequency isf=108Hz,with the angular frequency of Ωs=2π×108rad/sec.The cutoff frequency of transmission band isf=103Hz,with the angular frequency being Ωp=2π×103rad/sec.The initial frequencyofthestopbandisf=2×10³Hz,withtheangular frequencyofΩst=2π×103rad/sec.Theattenuationconstant of the stop band is not less than−50dB.
For the hamming window in the data processing,the minimum value of decay constant is−53dB,and the stop-band is larger than−50dB,so the hamming window function is chosen as
The amplitude function of frequency response is:
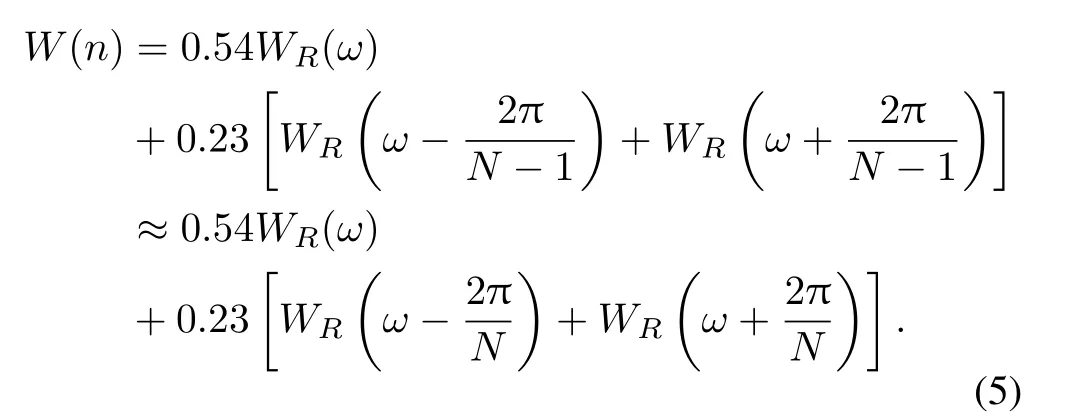
Using this method,99.6%energy can be focused in the main lobe of the window spectrum.The width of main lobe is 2π/N.And the peak value of the side lobe is less than 1% of the peak value of main lobe.
3.Least square smooth
Theleastsquaresmoothmethodisasfollows.Toobtainthemthpoint in the smoothed spectrum,k+1 points are selected on each side of themthpoint to form a window including 2k+1 data points.In this window,the polynomial fitting method is applied to fit the original data,and the value ofmthpoint of the fitting polynomial is the value of the smoothed spectrum at themthpoint.As themthpoint moves,the entire smoothed spectrum is obtained[12].
Letymbe the original data and¯ymbe the smoothed data, the smoothed value of themthpoint is
as theqorder polynomial is used to approachym

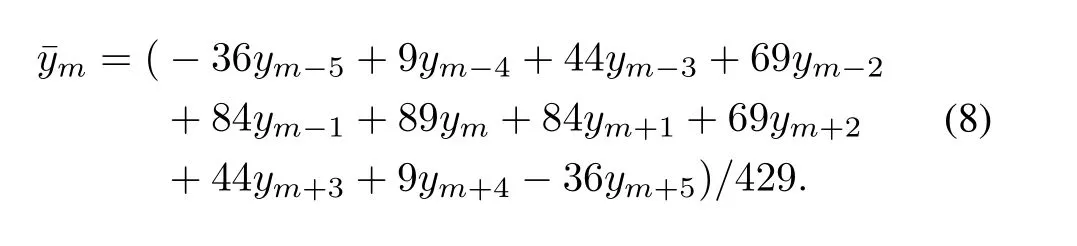
We use 11 points smoothing(k=5,a window of 11 data points).Quadratic polynomial is applied to fit the data,and the least square method is used to obtain the coefficients of the polynomial.The 11 points smoothing formula is
III.COMPARISON OF ALGORITHMS
CdZnTe digital γ detector system is used to measure60Co γ-rays,and algorithms are compared and assessed for their capabilities of obtaining the energy spectra of different amplitudes and smoothing results[13].The above algorithms are applied to treat the obtained impulse data of γ-rays.Several metrics are used to evaluate the effects of different algorithms such as energy resolution,integral nonlinearity peakto-Compton ratio,peak area,etc.
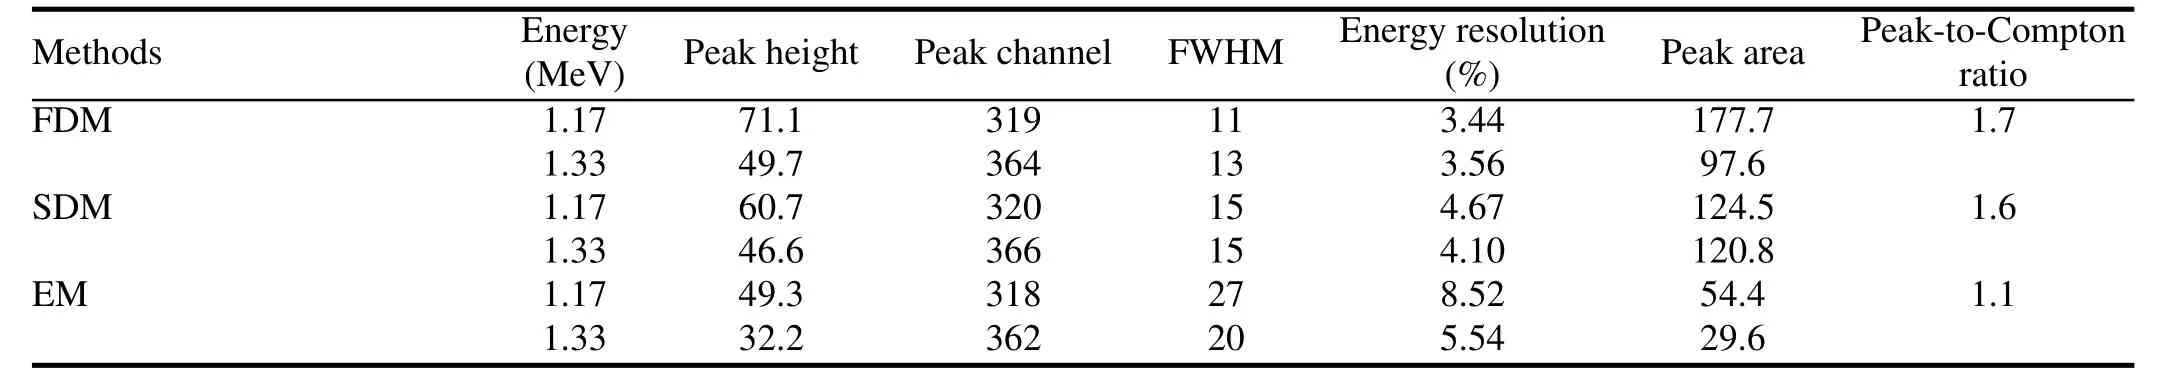
TABLE 1.Parameters calculated with the 1stderivative(FDM),the 2ndderivative(SDM)and the extreme methods(EM)
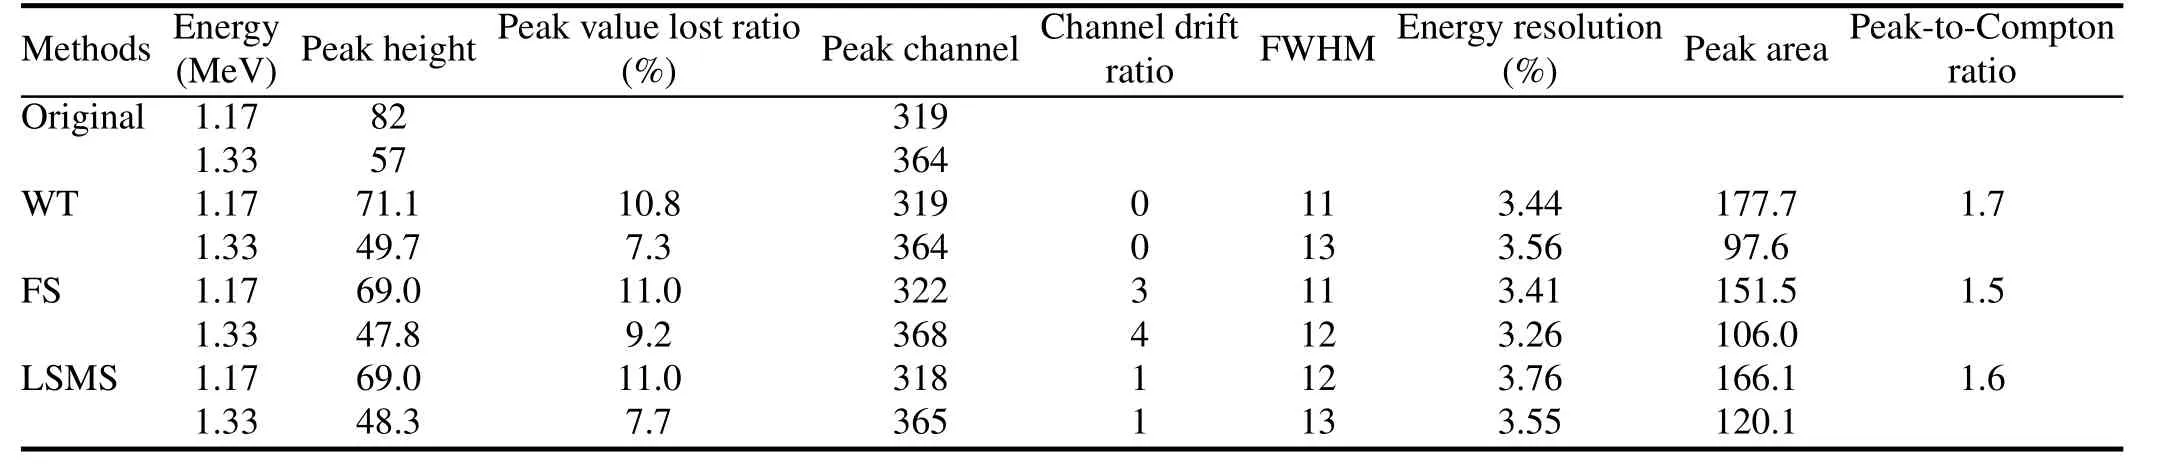
TABLE 2.Smooth results by wavelet transform(WT),filter smooth(FS),least square moving smooth(LSMS),for60Co γ-rays

Fig.2.(Color online)Energy spectra obtained with(a)the first derivative method,(b)the second derivative and(c)the extremum methods.
A.Acquirement and evaluation of impulse amplitude
The energy spectrum obtained is relatively rough.In order to obtain the typical parameters and reduce the influence of statistical error on computation of the parameters,wavelet smoothing is performed on the spectrum[14,15].The spectraobtainedwiththefirst derivative,thesecondderivativeand the extremum methods are shown in Fig.2.
The spectrum obtained by the first derivative method (Fig.2(a))not only is smooth,but also has prominent peaks. The spectrum obtained by the second derivative method (Fig.2(b))is distorted on the Compton plateau region and on the peak position.The spectrum obtained by the extremum method(Fig.2(c))is similar to Fig.2(a),but the peak value is cut down.The parameters calculated with the three methods are listed in Table 1.
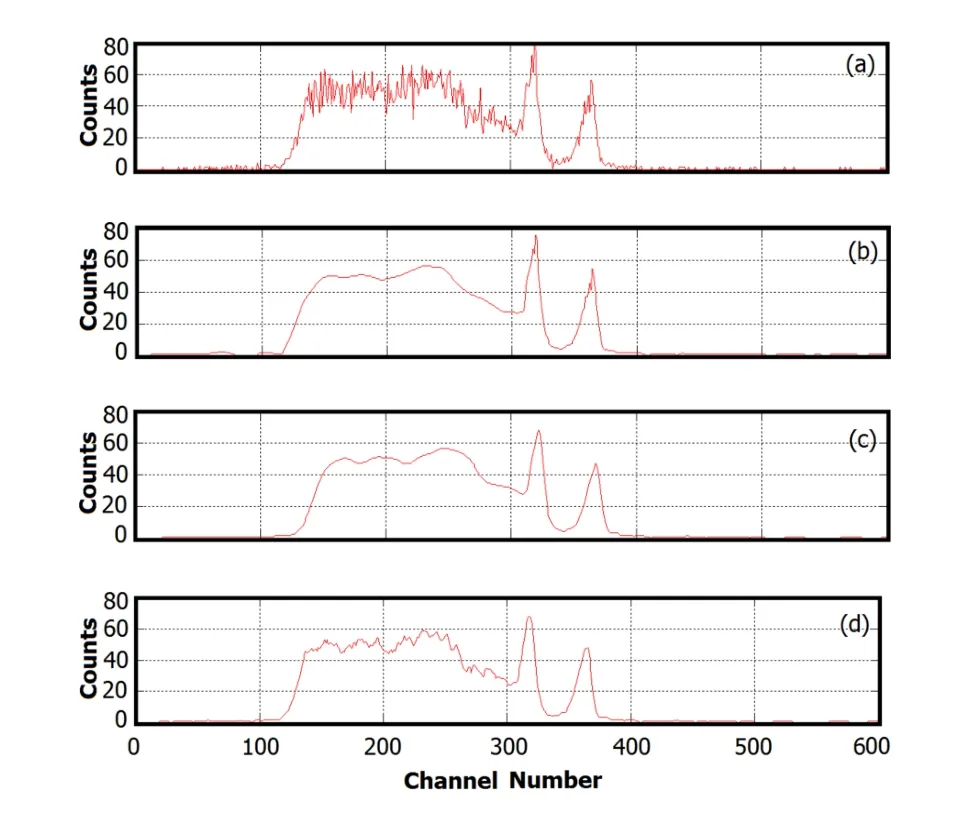
Fig.3.(Color online)Original energy spectrum(a),and energy spectra smoothed with(b)the wavelet,(c)the filter and(d)the least square methods.
From Table 1,the spectrum obtained by the first derivative method is the best of all methods,with the best energy resolution,the highest peak height,the maximal peak-to-Compton ratio and the maximal peak area.
B.Smoothness and evaluation of energy spectrum
The energy spectrum smoothed with the three methods and the unprocessed spectra are shown in Fig.3.
The spectrum smoothed by the wavelet method(Fig.3(b)) not only is smooth,but also keeps the feature of the original spectrum without peak position shift.The spectrum processed by the filter method(Fig.3(c))is smooth,with shifted peak position,though.The smoothed spectrum with the least squaremethod(Fig.3(c))isnotgoodenoughbecauseofsome glitch impulses.The parameters of the smoothed spectrum are listed in Table 2.
From Table 2,statistical fluctuation of the spectrum cannot be removed,or original shape of the spectrum is not kept, using the least square smooth method,due to limitation of the base vector of the discrete Fourier transform.The integration nonlinearity cannot be suppressed effectively by FIR filter,the peak position differs remarkably from the original position.Because of the multi-resolution for the base vector of wavelet transform method,high resolution can be achieved in channel domain and frequency domain,and features of the slow and rapid changes also can be fully extracted,hence an effective method for smoothing γ-ray spectra.
IV.CONCLUSION
In this paper,integration nonlinearity,peak area,peak-to-Compton ratio are set as the standards of evaluating the experimental data on the extraction algorithms for impulse amplitude and the smoothing algorithms for the energy spectrum obtained by CdZnTe digital γ-ray detector system.The results show that using the first derivative method to extract the impulse amplitude and the wavelet transform method to smooth the energy spectrum have obtained the better results taking no account of the computational time.
[1]Ai Y X.Ph.D.Thesis,Tsinghua University,2005.(in Chinese)
[2]Brutscher J and Arlt R.Nucl Instrum Meth A,2001,458:189–195.
[3]Pang J F.Gamma Spectrum Analysis.Xi’an(CHN):Shanxi Science and Technology Press,1990.(in Chinese)
[4]Xu P,Huo Y G,Qiu X L,et al.Nucl Tech,2008,10:791–795. (in Chinese)
[5]Hu G S.Digital Signal Processing.Beijing(CHN):Tsinghua University Press,1997.(in Chinese)
[6]Li Q H.Master Thesis,Xinjiang University,2013.(in Chinese)
[7]Peng Y H.Wavelet Transform and Engineer Application.Beijing(CHN):Science Press,1999.(in Chinese)
[8]Yang Y G,Wang R S,Li Y G,et al.Nucl Tech,2002,4:241–246.(in Chinese)
[9]Phinyomark A,Limsakal C,Phukpattarnont P,et al.Bangkok, Thailand:IEEE,200:21–25.
[10]Yang Y.Sci Tech Eng,2011,10:747–2750.(in Chinese)
[11]Li X L.Evolved Filter Design of Image Denoising[D].Anhui (CHN):University of Science and Technology of China,2009. (in Chinese)
[12]Lu X H and Feng Z Y.Processing of Experiment Data for Nuclear Physics.Beijing(CHN):Atomic Energy Press,1987.(in Chinese)
[13]Xu P,Di Y M,Qiu X L,et al.Nucl Electron Detec Tech,2007,2:234–270.(in Chinese)
[14]Di Y M,Fang G M,Qiu X L,et al.Atom Energ Sci Technol, 2008,4:370–372.(in Chinese)
[15]Huo Y G,Xu P,Zhou C L.Nucl Sci Tech,2009,20:228–230.
10.13538/j.1001-8042/nst.25.050402
(Received March 7,2014;accepted in revised form April 9,2014;published online September 29,2014)
∗Corresponding author,wangsong99123@21cn.com
 Nuclear Science and Techniques2014年5期
- Nuclear Science and Techniques的其它文章
- Dose rate distribution of photoneutrons in an ID beamline of SSRF:simulations and measurements
- Calibration method for electrode gains in an axially symmetric stripline BPM∗
- A study of quasi-absolute method in photon activation analysis∗
- High-resolution boosted reconstruction of γ-ray spectra∗
- A fractionation model based on three lognormal particle size distributions
- Model-predictive control of power supply for particle accelerators∗