橡胶木屑基活性炭—聚氨酯复合材料的制备及其微波吸收性能
2015-01-01 08:20AzizahShaabanSianMengSeImranMohdIbrahimQumrulAhsan
新型炭材料 2015年2期
Azizah Shaaban,Sian-Meng Se,Imran Mohd Ibrahim,Qumrul Ahsan
(1.Department of Engineering Materials,Faculty of Manufacturing Engineering,Universiti Teknikal Malaysia Melaka (UTeM),Hang Tuah Jaya 76100 Durian Tunggal,Melaka,Malaysia;2.Department of Telecommunication,Faculty of Electronics and Computer Engineering,Universiti Teknikal Malaysia Melaka (UTeM),Hang Tuah Jaya 76100 Durian Tunggal,Melaka,Malaysia)
1 Introduction
A wide range of fossil carbonaceous materials such as coal,peat and wood can be used as a carbon precursor for activated carbons.In addition,the agricultural and forestry wastes are inexpensive and renewable additional sources for activated carbons.These waste materials are believed to have little or no economic value,and their disposal often becomes a major issue.In Malaysia alone,several million tons of agricultural wastes are being disposed into landfills annually[1].Thus,the conversion of waste materials into activated carbons would be a value-added process.Also,it can reduce waste disposal burden,and more importantly,provides a potentially inexpensive alternative material to the existing commercial activated carbons[2].
Activated carbons have a high porosity.They are large-surface-area materials with a large adsorption capacity produced by carbonization and activation of carbonaceous materials.They are widely used in filtration and purification applications,as catalyst supports and electrode materials of supercapacitors.Also,they can also be used in gas storage for natural gas vehicles[3].In addition to their large surface area and porosity,the presence of various functional groups allows a broad application of activated carbons such as pesticide adsorption to reduce pollutant and nutrient retention in soil[4].For instance,activated carbons derived from Jacaranda fruits and plum kernels are being used in water treatment[5].Due to a large number of applications,the preparation and characterisation of activated carbons have received a great deal of interests in both scientific and industrial fields.
Generally,two types of activation processes are involved in the production of activated carbons,viz.(i)physical activation and (ii)chemical activation.Physical activation is carried out by a carbonization under an inert atmosphere above 400 ℃followed by an activation with gases such as steam or CO2.Chemical activation mixes uses chemical activating agents such as ZnCl2,H3PO4and alkaline hydroxides such as NaOH and KOH to activate the carboneous materials under an inert atmosphere[3,6].Chemical activation produces activated carbons with higher surface area and a higher yield[7]at a lower temperature than physical activation.Recent research studies showed that the phosphoric acid activation using microwave as a heating method yielded activated carbons with a better quality at a lower temperature than the normal heating method,which results a greatenergy saving[8,9].For a purpose of process optimization,the response surface methodology (RSM)was successfully applied to correlate the factors in the activation process with the microstructures and properties of the activated carbons[10].
In general,ferrite,cobalt-nickel alloy and iron are suitable to enhance magnetic property,while carbon black,graphite,metal flake and activated carbon are used to modulate dielectric properties.These materials help to improve the microwave absorption owing to the contributions from their permeability and permittivity properties[11].These absorbers are usually in the form of pyramidal,honeycomb,walkway,wedge or hybrid shapes[12].However,they are synthetic,heavy,expensive and exhaustible materials.Rubber wood sawdust was chosen as the precursor for activated carbonsbecause of its availability as one of the main plants in Southern East Asia.In Malaysia,the estimated plantation area of rubber trees is 1.82 million hectares,which contributes to approximately 20% of the global plantation.Moreover,rubber wood sawdust has a high carbon and a low ash content[1,12].Furthermore,the activated carbons derived from rubber wood sawdust for microwave absorption has not yet been reported until now.Incorporating the high-surface-area wood-based activate carbon with polyurethane may produce composites with an enhanced dielectric properties for microwave absorption compared to pristine polyurethane.
The current work focuses on the characterization of high-surface-area activated carbon synthesised from rubber wood sawdust through a three stage chemical activation as a microwave absorption material.This paper also addresses the fabrication of a flat-type absorber and the performance measurement of the absorbers such as dielectric constants,return loss and electromagnetic interference shielding efficiency(EMISE)in microwave absorption applications.
2 Materials and methods
2.1 Preparation of activated carbons
The raw material of rubber wood sawdust was collected from a sawmill in Melaka,Malaysia.The sawdust was sieved to remove any lumps,dried at 105 ℃for 24 h and stored in a sealed container.Later,the dried rubber wood sawdust was ground using a lab-scale milling machine and sieved to 20 μm.Next,the C,H,N elements of the dried raw material was analysed by an elemental analyser (Thermo Scientific Flash,EA 1112).The relative percentages of the elements are provided in Table 1.It was found that the carbon content of the raw rubber wood sawdust was 43.27%,which is in good agreement with the results of other researchers[13,14].
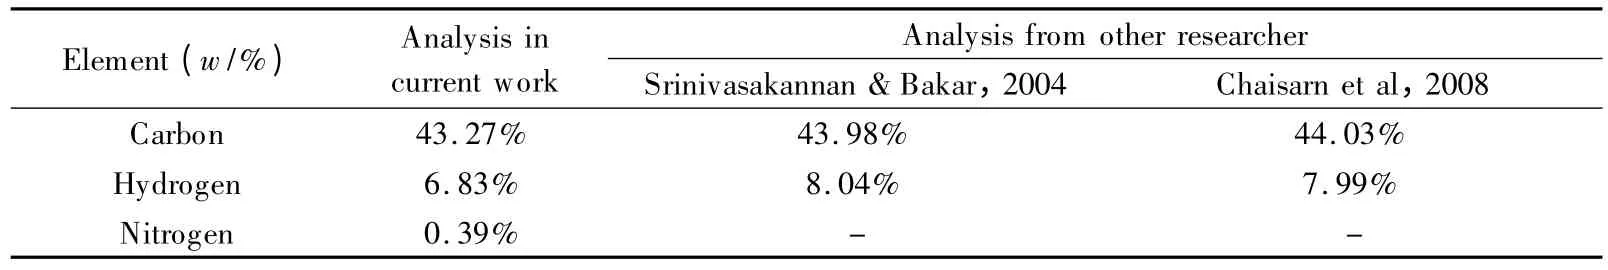
Table 1 Elemental CHN analysis on raw rubber wood sawdust.
The preparation of activated carbon from rubber wood sawdust involved three stages.First,the dried rubber wood sawdust was refluxed with a base solution of 1.0 mol/L NaOH at 100 ℃ for 30 min.Then,the leached rubber wood sawdust was impregnated and activated with ZnCl2at 500 ℃for 60 min with the ZnCl2/wood sawdust mass ratios of 1 ∶1,1.5∶1 and 2 ∶1.).Finally,the activated samples were refluxed with an acid solution of 3 mol/L HCl for 30 min[2],dried at 100 ℃for 24 h and ground to obtain the activated carbons.The simplified process flow is shown in Fig.1,and the samples are grouped and labelled as given in Table 2.
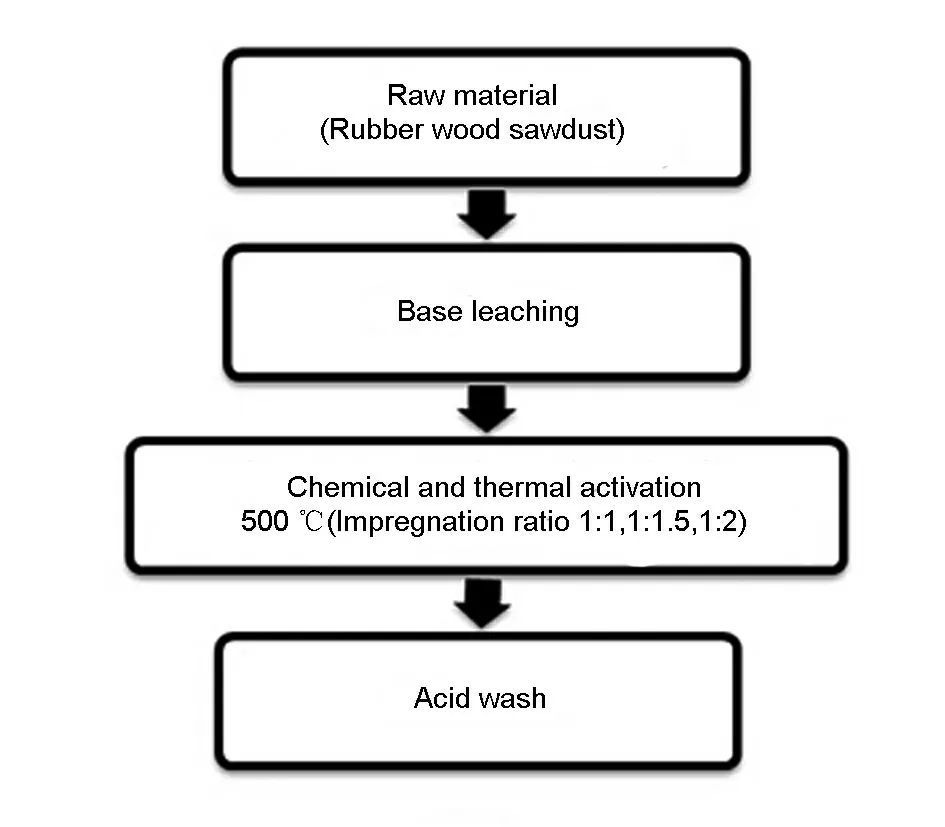
Fig.1 Process flow for activated carbon synthesis.
The particle sizes of the ground activated carbons were analyzed with a Mastersizer Scirocco.
2.2 Characterization of the activated carbons
Prior to the fabrication of a microwave absorber,the derived activated carbons were characterized to select the most suitable sample as a filler of a composite as the microwave absorber.The activated carbon samples were characterized by X-Ray Diffraction(XRD)using Kα as the radiation source with a scanning speed of 2.5°·min-1,nitrogen adsorption with a Micromeritics ASAP 2010 to estimate the Brunauer-Emmett-Teller (BET)surface areas,scanning electron microscopy (SEM-Zeiss Evo 50)at 20 kV with a magnification of 500 for surface morphology observation and elemental analysis.
2.3 Preparation of microwave absorbers
Activated carbon R1.5 was used as a filler in microwave absorbing composite materials,owing to its high BET surface area.Polyurethane (PU)foams incorporated with R1.5 activated carbon at different loading levels (1%,2%,3%,5% and 8%)were prepared by a chemical blowing method using polyol and isocyanates as precursors in disposable plastic containers[15].The dielectric constant was measured using a Dielectric Agilent Network Analyzer Basics(85070)in the frequency range of 1-5 GHz.The measured dielectric constant was used to determine the thickness of the R1.5-filled PU foams using Equation 1 and 2[16].

Table 2 Nomenclature of samples.
At a frequency of 1.8 GHz:

Where λo=the wavelength in free space,C is the light velocity,3 ×108m·s-1,f=the frequency,1.8 ×109Hz

Where λδis the wavelength for a dielectric material and εris the relative dielectric constant of the dielectric material.
For λo=16.66 cm and εr=3.0
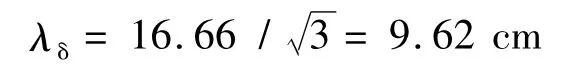
Two samples were produced based on wavelengths of λδ/4 and λδ/2 as tabulated in Table 3 with thicknesses of 2.4 and 4.8 cm,respectively.The overall dimensions of the fabricated flat shape absorbers were 30 cm ×30 cm in length (L)and width (W)with the desired thickness as shown in Fig.2.

Table 3 Thicknesses of the fabricated microwave absorbers.
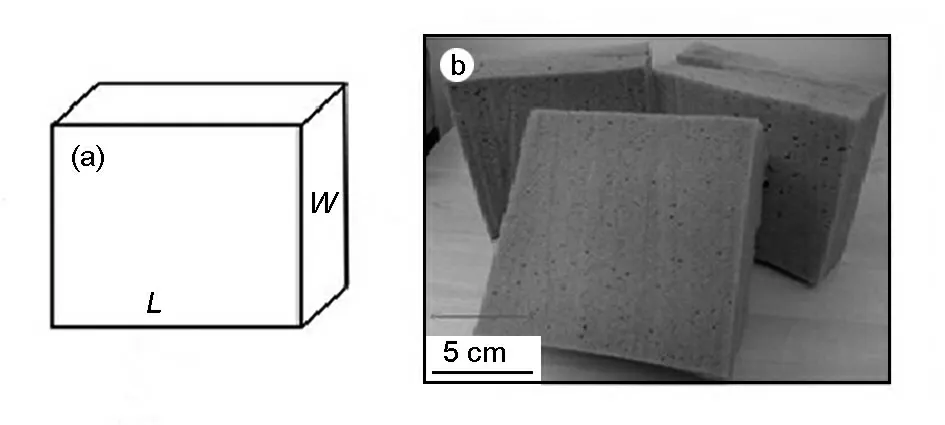
Fig.2 (a)Dimensions of absorber and(b)fabricated microwave absorber.
2.4 Measurement of return loss
Fig.3 shows the experimental set up for the measurement of return loss with the IEEE method.The measurement was carried out using an Agilent antenna and hone that were connected to an Agilent Vector Network Analyzer.The test was carried out at the microwave frequency range of 1 to 3 GHz.The distance between the hone antenna and the test specimens were set to 1 m with a 45° angle.A pure zinc plate was used to obtain a 100% reflection and the tests were carried out by attaching 2.4 cm or 4.8 cm thick absorber on the zinc surface with a zero air gap(Fig.3).The return loss was calculated based on the difference between the two recorded reflected spectra for zinc and the absorber displayed in the network analyser.
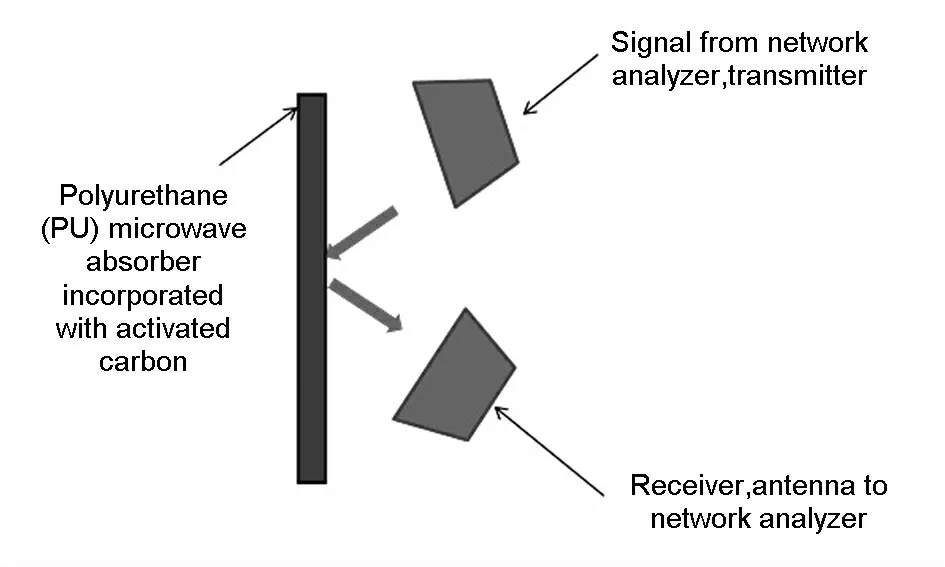
Fig.3 Experimental set-up for return loss measurements.
2.5 Measurement of electromagnetic interference shielding efficiency (EMISE)
EMISE was measured using a vector network analyser set over a frequency range of 1-2.5 GHz.The value is expressed in dB,which was calculated from the ratio of the incident to the transmitted power of an electromagnetic wave in Equation 3:

Where Pi(or Ei)and Pt(or Et)are the incident power (or incident electric field)and the transmitted power (or transmitted electric field),respectively[17].
3 Results and discussion
3.1 Phase analysis by XRD
Fig.4 shows the XRD patterns of a commercial activated carbon and samples with activated at different ZnCl2/wood saw dust ratios.The carbon peaks were detected at 2θ angles of 25-26° and 45°.Similar patterns were reported by Liou et al[6],in which two broad peaks at 2θ of 25-26° and 45° due to the turbostratic structure in disordered carbon.The higher is the impregnation ratio,the narrower are the peaks,indicating a relatively larger crystalline structure at a higher impregnation ratio.
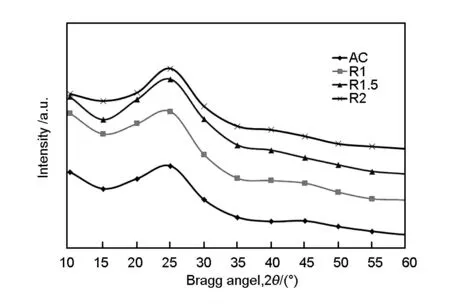
Fig.4 X-ray diffractographs of all activated carbon samples.
3.2 BET surface area analysis
Table 4 lists the particle size for all samples.It was found that,the percentage of particles less than 120 μm is 90.75% for the sample R1.5 and those for the samples R1 and R2 are 69.50% and 85.74%,respectively.Usually,a small particle size is associated with a high BET surface area.This observation is supported by the BET surface areas of all samples shown in Fig.5 and Table 5.The activated carbon R1.5 demonstrated the highest surface area of 1 301 m2/g while the R1 and R2 displayed surface areas of 920 m2/g and 606 m2/g,respectively.

Table 4 Percentage of rubber wood sawdust activated carbon with particle size less than 120 μm.
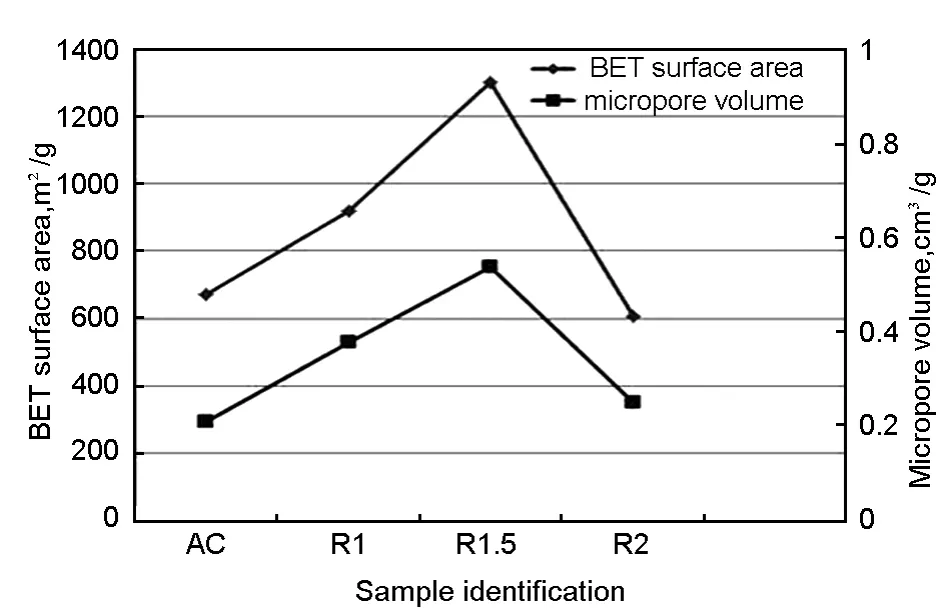
Fig.5 BET surface area and micropore volume of all samples.
The surface area of AC was 672 m2/g,which is lower than that of the samples R1 and R1.5.A large surface area of an activated carbon provides a high absorption capacity and an improved dielectric property[19].The BET surface area of R1 was lower than that of R1.5,which may be ascribed to a partial acti vation occurring only at the exterior of rubber wood sawdust.As a result,the pores were not fully developed due to an insufficient ZnCl2usage.An increase in the amount of activating agent promotes the contact area between the rubber wood sawdust and the activating agent and,therefore,increases the surface area of the resulting activated carbon.When the impregnation ratio exceeded 1.5,the surface area of the activated carbon decreased,which may be caused by blocking of the surface of the developed micropores by ZnCl2that may not be completely removed by the washing[6].Therefore,R1 and R2 showed lower surface areas than R1.5.Similarly,the micropore volume for the sample R1.5 showed the highest value of 0.54 cm3/g.Hence,R1.5 was selected as the filler for microwave absorber owing to its highest surface area,highest micropore volume and the smallest pore diameter.Similar trends have also been reported by other researchers for agro-based products[3].
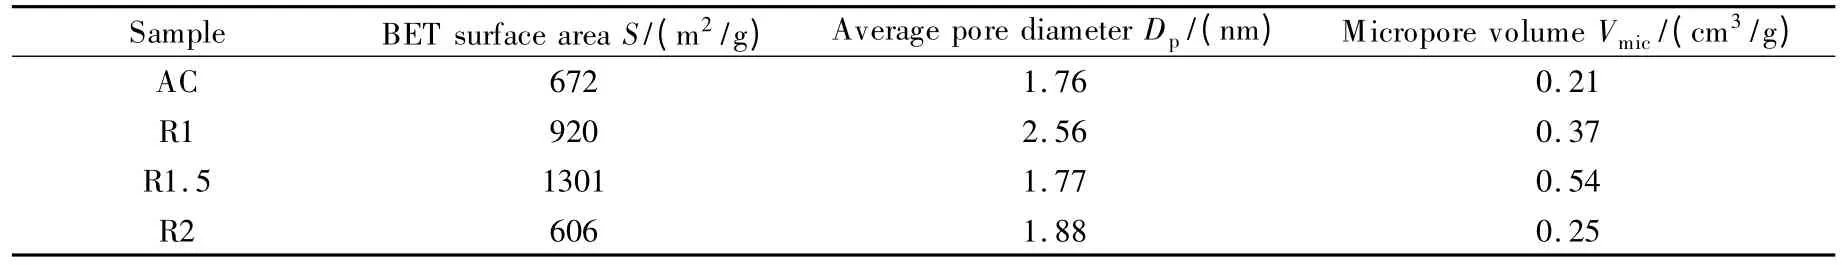
Table 5 BET surface area and micropore volume analysis of all activated carbon samples.
3.3 Surface morphology and SEM-EDX analysis
Fig.6 reveals that the black spots on the polyurethane (PU)wall of open-celled network structure of a composite containing 8% activated carbon are particles of activated carbon.
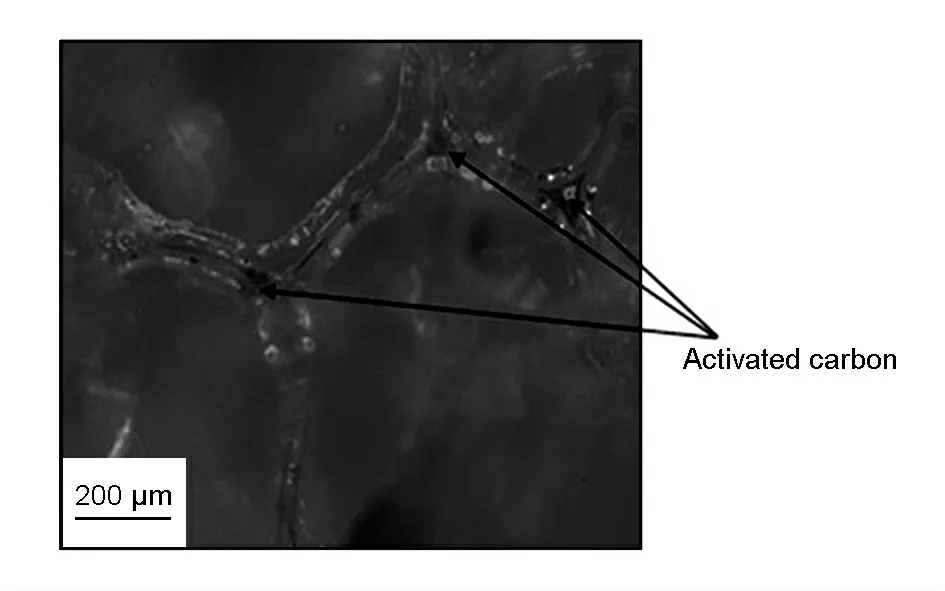
Fig.6 Impregnation of activated carbon in polyurathane network for sample containing 8% activated carbon.
Surface morphologies of all activated carbon samples were analyzed with SEM and are shown in Figs.7a-d.Fig.7a shows the micrograph for raw rubber wood sawdust,while Fig.7b-d show the micrographs of the samples R1,R1.5 and R2.It was observed that the surface of the sample R2 has ridges,resembling a series of parallel lines as compared to the samples R1 and R1.5.Activated carbons have tiny pores on their surface,and these pores are important for absorbing microwave energy.Based on the outward appearances,it is concluded that the pores are not interconnected.Table 6 denotes the percentage of carbon content in all samples examined by EDX.It was found that the sample R1 has the lowest percentage of carbon content.
3.4 Measurement of dielectric constant
The synthesized activated carbons were incorporated in the PU foam with various percentages (0-8%).The dielectric constant,ε’and dielectric loss ε”,of polyurethane-activated carbon composites of different activated carbon contents were obtained at a frequency range of 1-5 GHz at room temperature.As seen from Fig 8a the values of dielectric constant,ε’increase with the increasing content of activated carbon,indicating a strong dependence on activated carbon but the values of dielectric constant change very little regardless of a frequency increase for any weight percentage of active carbon.

Fig.7 SEM micrographs of samples:(a)raw rubber wood sawdust,(b)R1,(c)R1.5 and (d)R2.

Table 6 Percentage of localised carbon content by SEM-EDX analysis.
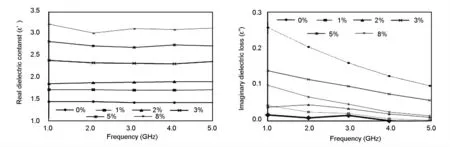
Fig.8 (a)Material dielectric constant and (b)imaginary dielectric loss (ε”)of several percentages (0-8%)of activated carbon content in PU foam at a frequency range of 1-5 GHz.
The dielectric constant is directly proportional to the activated carbon content in the composite as shown in Fig.9.These results indicate that increasing activated carbon content is an efficient way to increase energy storage.The storage capability of electrical energy is the highest for the composite containing 8%activated carbon (Fig.8a).It was also found in the present study that a further increase of carbon content beyond 8% led to a poor bonding between activated carbon and polyurethane resin,causing a rupture of PU foam.The composite containing 8% activated carbon has the highest dielectric constant (ε’)value of 3.0 at 1.8 GHz.The values of ε’for the composites containing less than up 3% activated carbon remain almost same with the content of activated carbon in the frequency range of 1-5 GHz.For the composite with 5% activated carbon,the decrease in the dielectric constant is relatively small at a high frequency side within 1-5 GHz .At the low frequency range,ε’declines from 3.2 to 3.0 with an increasing frequency from 1 to 2 GHz for the sample containing 8% activated carbon however,it remains the same in the high frequency region (2-5 GHz).This phenomenon is a result of the increase in the polarity of the electrical dipoles in the composite polymer,which contributes to the absorption of microwave energy[20].Moreover,with increasing frequency,the polarization of the dielectric dipoles has the the same phase as the oscillation of the electric field vector[21].The tendencies of the changes in dielectric loss with frequency and filler are almost analogous to those observed in the case of dielectric constant.Fig.8a indicates the real and the Fig.8b shows the imaginary dielectric constants of all samples in the frequency range of 1-5 GHz.The spectra for the imaginary part,ε”(Fig.8b)is always lower than that of the real part of the dielectric constant,ε’(Fig.8a).Fig.8b indicates that the dielectric loss,ε”has the similar trend with ε’,where the sample with 8% activated carbon has the highest value of ε”.The same pattern of spectra was reported by other researchers[22],which should be caused by the fact that the maximum dielectric loss occurs when the filler content exceeds the percolation threshold.
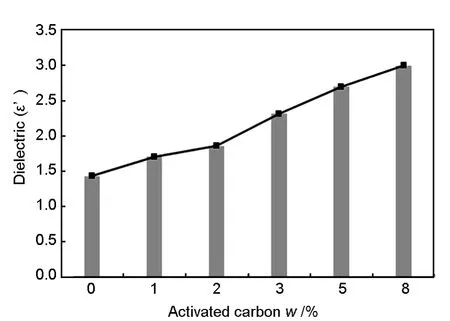
Fig.9 Material dielectric constant (ε’)of PU foam at several percentages (0-8%)of activated carbon at a frequency of 1.8 GHz.
3.5 Microwave absorption properties
The microwave absorbers fabricated with 8% activated carbon (R1.5)of two different thicknesses were tested for measuring the return loss of the microwave.These samples were chosen as they have high dielectric constant,which contributes to the permittivity of the microwave absorber.In addition,the pristine polyurethane sample without the addition of activated carbon was tested to observe the minimum return loss.The effect of thickness on the microwave absorption properties is shown in Fig.10 and the absorption loss values are given in Table 7.Fig.10 shows that the absorption coefficient increases with the thickness of the sample.The microwave absorption properties are improved with the addition of 8%activated carbon,and it is worth noting that the absorption bandwidths (RL better than -10 dB)are enhanced and the peak reflection loss is higher than the pristine sample.It is also found that the attenuation peaks shift to a lower frequency and the peak reflections are enhanced with the increasing sample thickness.As shown in Fig.10,in the 1.8-1.9 GHz frequency range,the return loss is -8.8 and-10.4 dB for the 2.4 cm and 4.8 cm thick samples,respectively.In addition,the maximum return loss peaks for the 4.8 cm thick sample below -10 dB shift to higher frequency ranges (1.36-1.54 and 1.70 -1.95 dB)than that for the 2.4 cm thick sample.These results suggest that at a sample thickness above λ/2,microwave absorbing materials have low reflectivities over a wide range of frequencies[23]and also indicate that the fabricated microwave absorber is one of the candidate materials for the applications in a Global System for a mobile frequency of 1.8 GHz,which can decrease the strengths of the electromagnetic energy transmitted from the telecommunication towers.In comparison with the previous work carried out by Normikman et al.,where a composite consisting of 90% rice husk and 10% urea formaldehyde resin is used,the average return loss in a pyramidal shape is approximately -16 dB in a frequency range of 1-2 GHz[22].
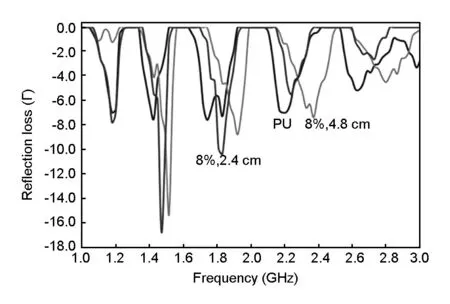
Fig.10 Return loss spectra of different thicknesses of 8% R1.5 loaded PU foam at the frequency range of 1 to 3 GHz.
3.6 Electromagnetic interference shielding efficiency (EMISE)
Fig.11 shows the variation of EMISE under microwave for the 2.4 and 4.8 cm thick polyurethaneactivated carbon composites with frequency from 1 to 2.5 GHz.The higher the EMISE value in decibels,the greater is the energy absorbed by the sample.It is also evident from Fig.11 that the maximum EMISE occurs at 1.2 GHz for the frequency range (1-2.5 GHz)tested.The shielding efficiency increases with the thickness of the samples with the EMISE of 1.2 and 3 dB for the thickness of 2.4 and 4.8,respectively.With a thick sample,the energy passing through the absorber is low,thus indicating that more energy is absorbed by the thick sample.The energy absorption in terms of EMISE is also above 2 dB at 1.6-1.8 GHz and 2.0-2.1 GHz ranges for the 4.8 cm thick sample.It can thus be inferred that the thick sample is an ideal material for electromagnetic interference shielding at a frequency range of 1-2.5 GHz.This trend has also been confirmed by other researchers using the polyurethane-polyaniline composites as the microwave absorbing material[24].
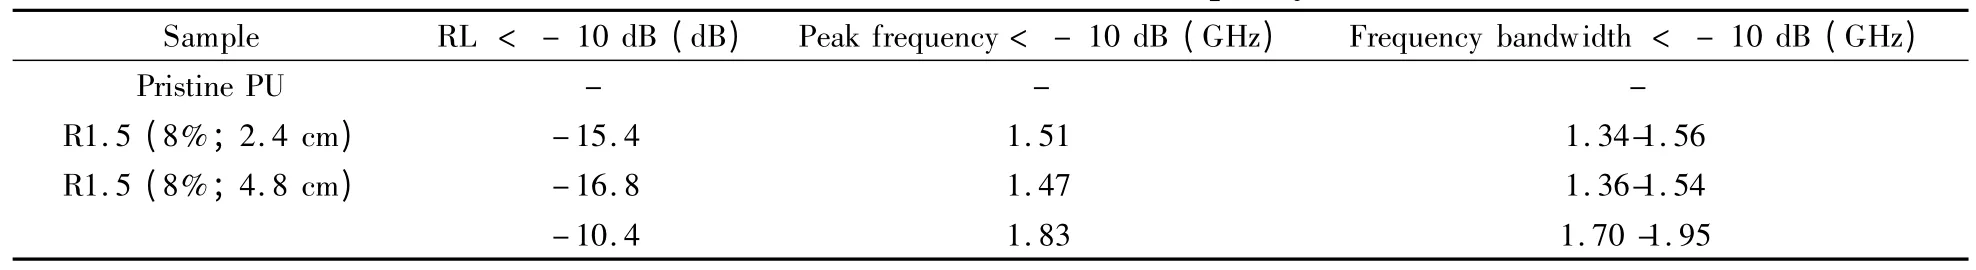
Table 7 Detailed data of return loss for a frequency of 1.8 GHz.
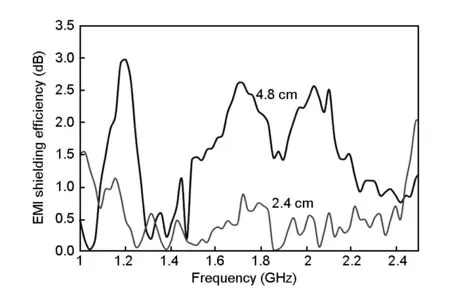
Fig.11 EMI shielding efficiency spectra of different thicknesses of 8% R1.5-loaded PU foam at the frequency range of 1 to 2.5 GHz.
4 Conclusions
Locally available rubber wood sawdust was used as a low-cost alternative precursor for chemically activated carbons with ZnCl2as an activating agent.The activated carbon obtaine at a ZnCl2/wood sawdust mass ratios of 1.5 has a BET surface area of 1 301 m2/g and is used as filler of the polyurethane matrix composites that serve as an alternative for existing synthetic microwave absorbing materials.Compared to other composite material using agricultural waste as raw additive,activated carbon has improved the dielectric properties of the composite materials and activated carbons loaded in the polyurethane is rather low[22].The reflection loss of the activated carbon filled polyurethane composite absorber is -10.0 dB at 1.8 GHz,and its EMI shielding efficiency is above 2 dB in a frequency range of 1-2.5 GHz for the sample with a thickness of 4.8 cm.These results indicate that the high specific surface area activated carbon derived from rubber wood sawdust has great potential to serve as filler of dielectric and microwave absorbing materials.
Acknowledgements
The authors are very thankful to the Faculty of Manufacturing,Electronics and Computer and Mechanical Engineering,UniversitiTeknikal Malaysia Melaka (UTeM)for providing the facilities and constant encouragement.The authors would also like to acknowledge funding from a short-term grant under PJP/2010/FKP(2A)S660 and PJP/2010/FKEKK(18A)S718.
[1]Hameed B H,Ahmad A L,Latiff K N A.Adsorption of basic dye (methyl blue)onto activated carbon prepared form rattan sawdust[J].Dye Pigment,2007,75:143-149.
[2]Tsai W T,Lee M K,Chang Y M.Fast pyrolysis of rice husk:Product yields and compositions[J].Bioresour Technol,2007,98 (1):22-28.
[3]Liou T H.Development of mesoporous structure and high adsorption capacity of biomass-based activated carbon by phosphoric acid and zinc chloride activation[J].Chem Eng,2009,158:129-142.
[4]Rajkovich S,Ender A,Hanley K,et al.Corn growth and nitrogen nutrition after additions of biochars with vary properties to a temperate soil[J].Biol Fertil Soils,2012,48:271-284.
[5]Treviño-Cordero H,Juárez-Aguilar L G,Mendoza-Castillo D I,et al.Synthesis and adsorption properties of activated carbons from biomass of prunes domestic and jacaranda mimosifolia for the removal of heavy metals and dyes from water[J].Ind Crops Prod,2013,42:315-323.
[6]Liou T H,Wu S J.Characteristics of microporous/mesoporous carbons prepared from rice husk under base and acid treated conditions[J].Hazard Mater,2009,171:693-703.
[7]Demirbas A.Agricultural based activated carbon for the removal of dyes from aqueous solutions:A review[J].Hazard Mater,2009,167:1-9.
[8]Zhong Z Y,Yang Q,Li X M,et al.Preparation of peanut hullbased activated carbon by microwave-induced phosphoric acid activation and its application in remazol brilliant blue R adsorption[J].Ind Crops Prod,2012,37:178-185.
[9]Liu Q S,Zheng T,Wang P,et al.Preparation and characterization of activated carbon from bamboo by microwave-induced phosphoric acid activation[J].Ind Crops Prod,2010,31:233-238.
[10]Cesar N D,Jose R R M.Production of activated carbon from organic by-products from the alcoholic beverage industry:Surface area and hardness optimization by using the response surface methodology[J].Ind Crops Prod,2011,34:1528-1537.
[11]Andrew S.Microwave Absorber:Reducing cavity resonant compliance engineering[M].2010.
[12]Ibrahim I M,Yaakob N M,Husian M N,et al.The effects of carbon to the S11 measurement on the pyramidal microwave absorber[R].Wirel Technol Appl IEEE Smyp,2011,141-145.
[13]Srinisvasakanan C,Bakar M Z A.Production of activated carbon from rubber wood sawdust[J].Biomass Bioenerg,2004,27:89-96.
[14]Chaisarn P,Satapanajaru T,Mahujchariyawong J.Adsorption of VOCs by activated charcoal produced from saw dust in pararubber wood furniture manufacturing[J].Thammasat Int J Sci Technol,2008,13:8-17.
[15]Lee S T,Ramesh N S.Polymeric foam:mechanisms and materials.Polymeric foams:Mechanisms and materials thermoplastic foam processing:Principles and applications[R].CRC Press,New York,2004.
[16]Nornikman H,Malek F,Soh P J,et al.Effect on source signal condition for pyramidal microwave absorber performance[R].Int Conf Comput Commun Eng,Kuala Lumpur,11-13 May 2010,Malaysia.
[17]Arindam D,Harun T H,Manish K T,et al.Super hydropho-bic and conductive carbon nanofiber/PTFE composite coatings for EMI shielding[J].Colloid Interface Sci,2011,353:311-315.
[18]Pecharsky V K,Zavalij P Y.Fundamental of powder diffraction and structural characterization of materials[M].Springer,USA,2009.
[19]Kalderis D,Bethanis S,Paraskeva P,et al.Production of activated carbon from bagasse and rice husk by a single-stage chemical activation method at low retention times[J].Bioresour Technol,2008,99(15):6809-6816.
[20]Trejo G,Network Analyzer Basics[M].Agil Technol California,2006.
[21]Ahmad AY,Ali W K W,Rahman T A,et al.Microwave and reflection properties of palm shell carbon-polyester conductive composite absorber[J].Technol,2005,42(A):59-74.
[22]Nornikman H,Malek F.Parametric studies of the pyramidal microwave absorber using rice husk[J].Prog Electromagn Res,PIER,2010,104:145-166.
[23]Liu Y,Zhang Z,Xiao S,et al.Preparation and properties of cobalt oxides coated carbon fibres as microwave-absorbing materials[J].Appl Surf Sci,2011,257:7678-7683.
[24]Lakshmi K,John H,Mathew K T,et al.Microwave absorption,reflection and EMI shielding of PU-PANI composite[J].Acta Mater,2008,57:371-375.
猜你喜欢
化学工业与工程(2022年1期)2022-03-29
童话世界(2020年32期)2020-12-25
耕作与栽培(2020年3期)2020-09-18
飞天(2020年4期)2020-04-17
皮革制作与环保科技(2020年13期)2020-03-17
四川冶金(2019年5期)2019-12-23
中国食用菌(2019年6期)2019-07-04
上海建材(2019年4期)2019-05-21
中学生数理化·八年级物理人教版(2019年3期)2019-04-25
中国塑料(2015年8期)2015-10-14