橄榄渣基活性炭活化工艺的优化
2016-11-22 07:41NourAbdelGhaniGhadirElChaghabyMohamedElGammalElShaimaaRawash
新型炭材料 2016年5期
Nour T. Abdel-Ghani, Ghadir A. El-Chaghaby, Mohamed H. ElGammal, El-Shaimaa A. Rawash
(1. Chemistry Department, Faculty of Science, Cairo University, Egypt;2. RCFF, Agriculture Research Center, Giza, Egypt)
橄榄渣基活性炭活化工艺的优化
Nour T. Abdel-Ghani1, Ghadir A. El-Chaghaby2, Mohamed H. ElGammal2, El-Shaimaa A. Rawash2
(1.ChemistryDepartment,FacultyofScience,CairoUniversity,Egypt;2.RCFF,AgricultureResearchCenter,Giza,Egypt)
采用KOH对橄榄渣进行活化得到活性炭。设计23正交试验来优化制备工艺条件,水平和因子包括活化温度(600, 900 ℃)、活化时间(1, 3 h)和浸渍比(1∶2, 1∶4)。活性炭的比表面积作为优化的评价指标。通过氮吸附仪、红外光谱仪和扫描电镜等手段对活性炭的表面化学和孔结构进行表征。结果表明,所有因子及其交互水平都非常显著(p<0.05)。活性炭的比表面积和制备条件的相关系数为99.2%。在最条件下制备的活性炭,比表面积为672 m2/g、平均孔径为2.05 nm,微孔和介孔率分别为81.36%和 18.37%。
橄榄渣; 活性炭; KOH; 渴望函数; 孔隙率
1 Introduction
For a long time, activated carbons (ACs) have been widely used as an effective and less expensive adsorbent for the removal of different pollutants from contaminated water. Although, several techniques are applied to water decontamination, the adsorption using ACs is preferred for its simplicity in application, efficiency and relatively cost effectiveness. AC is an amorphous form of carbon that is specially treated to produce a highly developed internal pore structure and a large surface area, thereby, producing reasonably cheap and excellent adsorbent[1]. Usually, the materials used for the preparation of ACs are fossil fuel generated hydrocarbons and lignocelluloses from biomass, wood or some agricultural wastes[1].Two methods have been used for preparation of ACs. They are physical activation and chemical activation methods[2]. In chemical activation method, the precursors used for AC preparation are impregnated with a chemical activation agent such as ZnCl2, H3PO4, KOH, H2SO4and NaOH, followed by carbonization[1]. Among the chemical activation agents, KOH is usually preferred as it is more eco-friendly than other activators. Another advantage of using KOH is that K2CO3formed after the interaction between KOH and char can prevent excessive sample burn-off, resulting in a high yield and well developed internal porosity[3].
Different agricultural wastes have been proposed as precursors for the preparation of ACs. In the present work, an attempt is made to produce ACs from olive cake generated as a waste from olive oil factories. Olive trees are widely planted in the Mediterranean region. The average world production of olive oil is 2.5×10⁶ton, most of which comes from the Mediterranean countries[4]. According to El-Hamouz et al[5], olive waste-based ACs have special features, which makes it desirable to develop ACs from olive wastes.
The preparation of a high quality AC is influenced by many factors. The most influential factors based on previously reported studies were found to be impregnation ratio (IR), activation temperature and activation time[4]. The use of an adequate experimental design is particularly important to optimize the preparation conditions. The factorial experimental design, which involves changing all the variables from one experiment to another, has been found to be a useful tool to study the effect of variables as well as the interactions of two or more variables with a reduced number of experiments. The full factorial design consists of a 2k experiment (k factors, each experiment at two levels), which is very useful for either preliminary studies or in initial optimization steps, while factorial designs are almost mandatory when the problem involves a large number of factors[6].
The aim of the present work is to optimize the production of a high surface area and porous AC from olive cake waste using a full factorial experiment design. The AC produced under the optimum conditions was characterized for its main porous properties.
2 Experimental
2.1 Materials
The olive-waste cake used as a precursor for the preparation of AC was obtained from olive oil processing factory in the Agricultural Research Center, Egypt. All Chemicals and reagents used in the study were of analytical grade supplied from Sigma Co.
2.2 Preparation of AC
The olive cake was washed by double deionized water with shaking at 200 r/min in a water bath at 50 ℃ to remove any adherent dirt and dried in an oven at 60 ℃ until constant weight. Carbonization was carried out in an oven at 400 ℃ for 1 h[7]. The char produced was then soaked in KOH solutions with different KOH/char ratios. The mixture was then dehydrated in an oven overnight at 100 ℃ to remove moisture[8]. The activation was carried out in a muffle furnace at different conditions indicated in the factorial experiment design. After activation, the AC samples were washed sequentially with 0.05 M HCl, hot water and cold deionized water until the pH value of the effluent reached 7, filtered and finally dried at 105 ℃.
2.3 Optimization of AC preparation
In order to optimize the preparation conditions of the olive cake-based ACs, a full factorial 23factorial design with three operational parameters each in two levels was employed. The three studied parameters chosen in this study are the KOH/ char mass ratio, the activation temperature and the activation time. The high and low levels defined for the 23factorial design are listed in Table 1. The low and high levels for the factors were selected according to some preliminary experiments. The factorial design matrix and the surface area of ACs measured in each factorial experiment are given in Table 2.
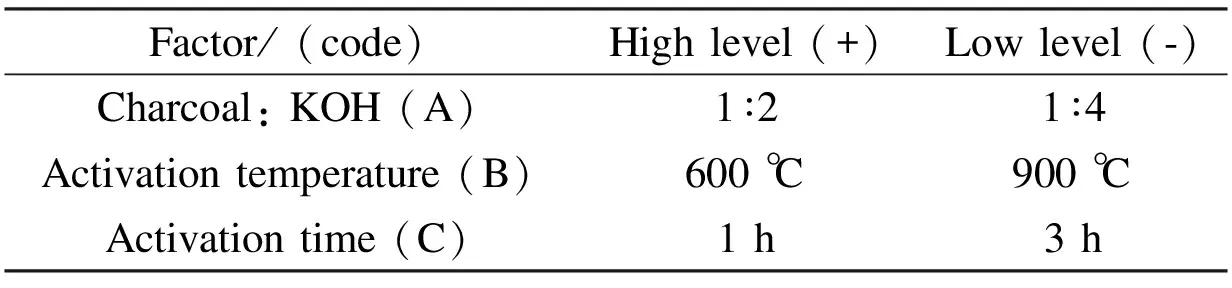
Table 1 High and low levels of the factorial 23 experimental design.
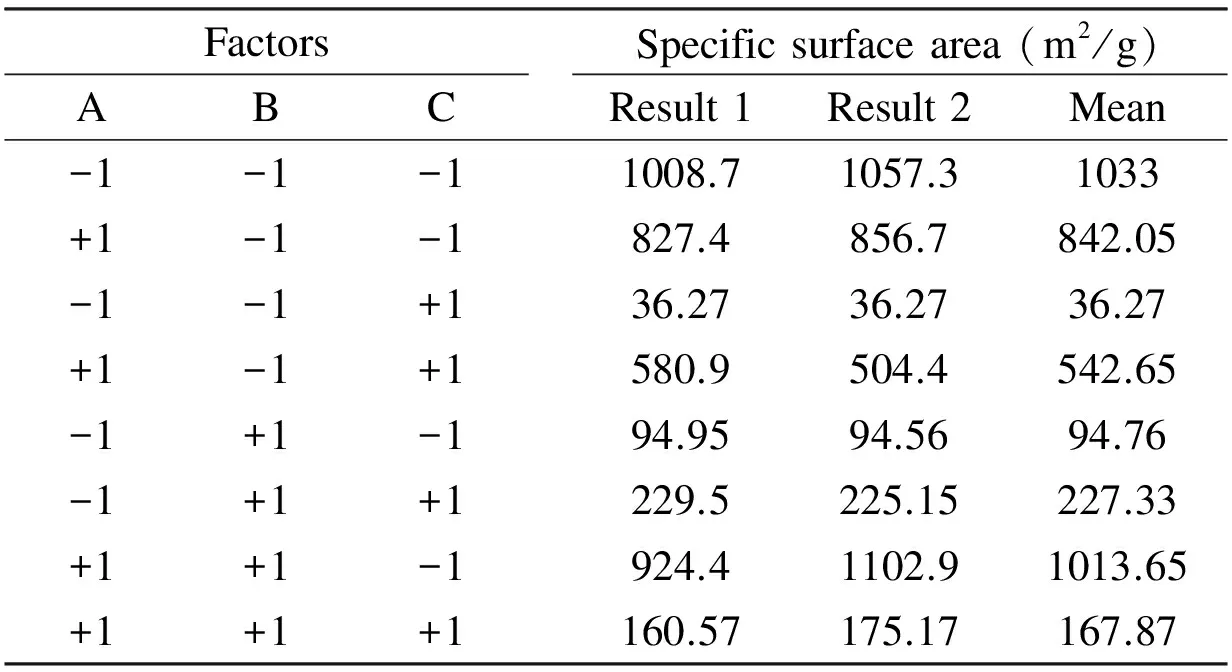
Table 2 Surface area of the prepared AC with the 23 experimental design.
The order by which the experiments were carried out was randomized to avoid systematic errors. The surface area taken as response in these experiments was measured as described by Igbokwe[9]. The results were analyzed with the Minitab 15 software, and the main effects and interactions between factors were determined.
2.4 Characterization of ACs
The morphology of the olive cake and the AC prepared at the optimum conditions was identified by scanning electron microscopy (SEM) using a JSM-6390LV (JEOL Ltd, Japan) with a 3 kV accelerating voltage. The samples were dried overnight at approximately 105 ℃ under vacuum before SEM analysis.
The surface functional groups of the olive cake and ACs were studied using an FT-IR (AVATAR 370 Csl, Thermo Nicolet Co., USA) at a resolution 4 cm-1over the range of 500- 4 000 cm-1. The samples were introduced as KBr pellets.
The surface area and the porosity of the AC at the optimized conditions were characterized by N2adsorption using a Quantachrom NOVA Automated Gas sorption system version 1.12.
3 Results and discussion
The results of the main factors’ effect, factors’ interaction effect, coefficients of the model, standard deviation of each coefficient and the probability as well as t test values for each effect for the full 23factorial designs are displayed in Table 3.
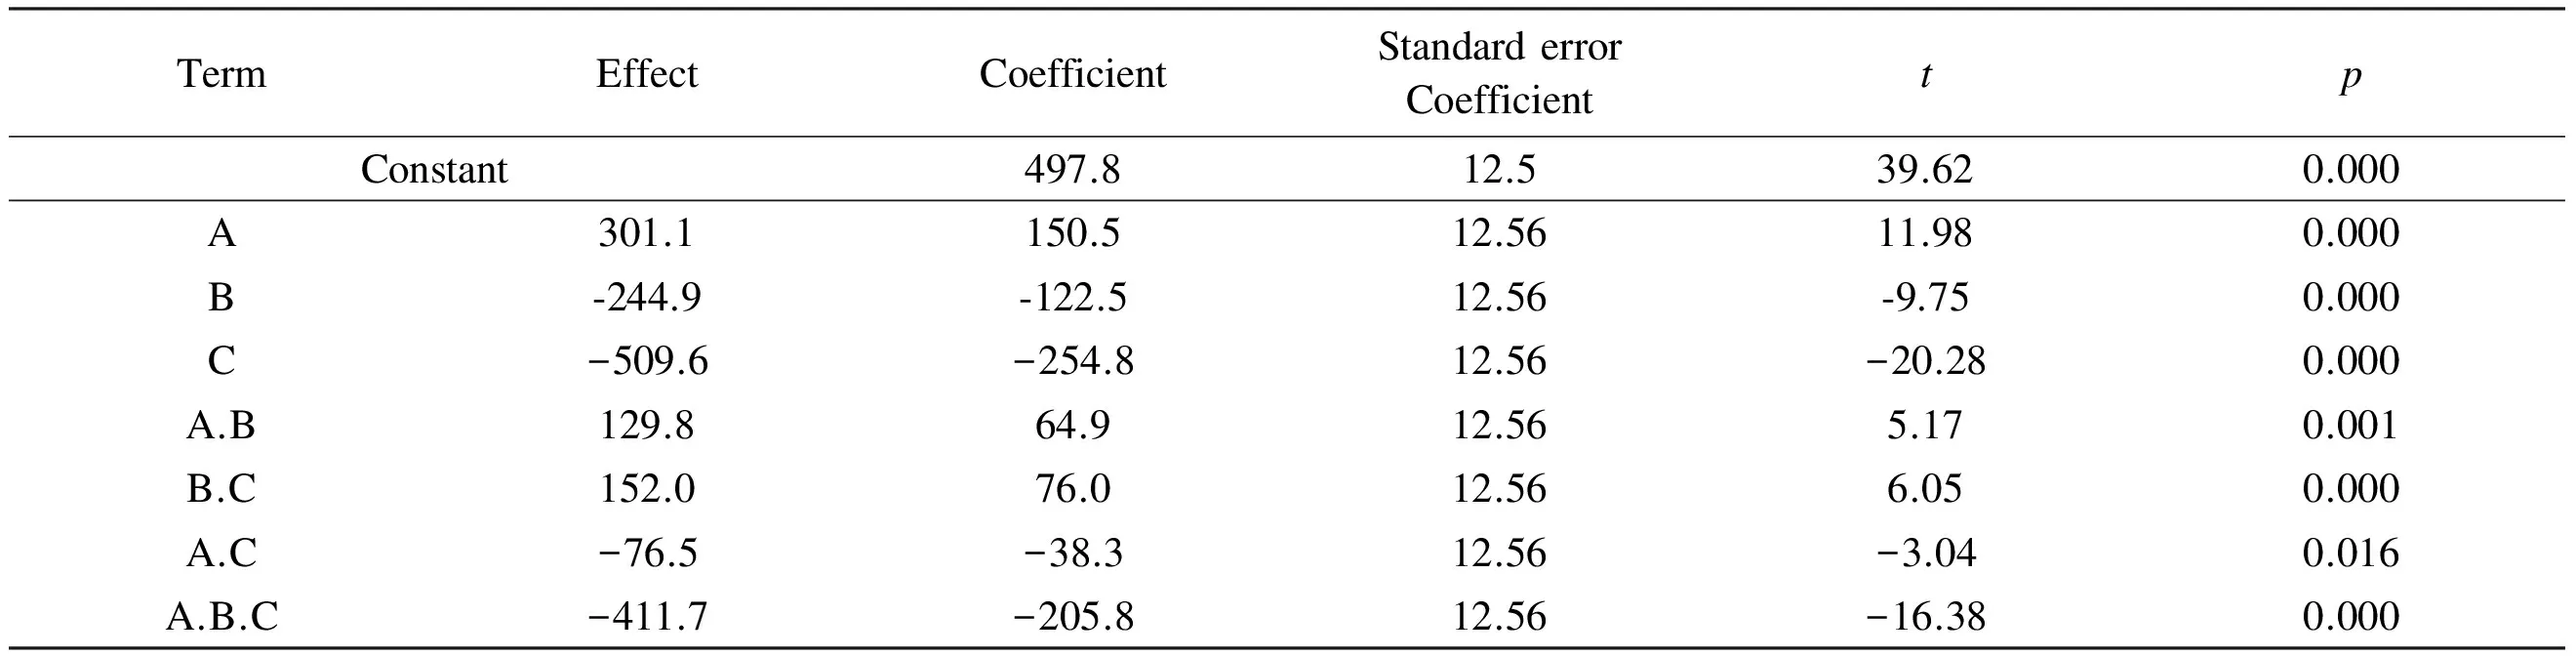
Table 3 Estimated effects and coefficients for surface area (coded units).
Note:R-Sq = 99.20%;R-Sq (predicted) = 96.80%;R-Sq(adjusted) = 98.50%.
The codified mathematical model employed for the 23factorial design as reported by several authors[6,10,11]is given by the Eq. (1):
R2=a0+a1A +a2B +a3C + …
(1)
wherea0represents the global mean andaithe other regression coefficients.
Substituting the coefficientsaiin Eq. (1) by their corresponding values from Table 3, the surface areas of ACs (Y) in terms of coded factors after the non- significant terms were excluded could be represented by the Eq. (2):
Y= 497.8 +150.5A -122.5.9B-254.8C+
64.9A.B +76B.C-38.8A.C -205.8A.B.C
(2)
This equation describes how the experimental variables and their interactions influence the surface area of the prepared ACs. The main advantage of the 2kfactorial design compared with the traditional approaches lies in its ability to model not only the effects of each factor, but also their interactions. The suitability and quality of the model developed were evaluated using the correlation coefficientR2which was found to be 99.2% as given in Table 3. The high values ofR2indicate a good agreement between experimental data and the model predicted ones.
3.1 Effects of the main factors
The main effect plot of the studied factors based on the surface area results is shown in Fig. 1. The plot represents the deviations of the average between the high and low level for each factor. When the effect of a factor is positive, the response (Y) increases as the factor changes from its low to its high levels, and vice versus.[6].
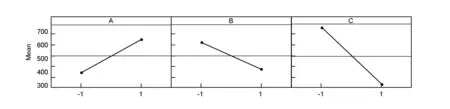
Fig. 1 Main effects plot for surface area.
Also from Fig.1, it can be inferred that the larger the vertical line, the larger the change in the response (surface area of activated carbon) when the factors were changed from level -1 to level +1. It should be pointed out that the statistical significance of a factor is directly related to the length of the vertical line[6].
By analyzing the results given in Table 3 and the main effect plot (Fig.1), it can be concluded that the KOH/char mass ratio has a significant effect (p=0) on the surface area of the ACs. Also the ratio is shown to have a positive coefficient, indicating that the surface area of the ACs increases with the ratio. This finding is in agreement with the work of Tan et al.[12]who found that during the impregnation of olive precursor with KOH, the KOH/char ratio played a crucial role in formation of pores. This phenomenon is ascribed to the fact that char reacts with KOH, forming K2CO3with simultaneous evolution of CO2and CO and so pore formation, leading to an increase of surface area[12]. Also it was found that KOH could accelerate the activation reaction rates and increase quantity of pores during the preparation of ACs. Also Patil et al found that the KOH/char ratio has a significant effect on surface area[13]when they studied the preparation of high surface area ACs from cassava peel by chemical activation. However El-Hendawy[14]has observed that a high KOH/char ratio might lead to formation of K2CO3and metallic potassium that were left in carbon and can’t be easily leached off even after repeated washing, which may lead to blocking of some pores and a drastic decrease in surface area.
From Table 3 and Fig.1, the effect of activation temperature (B) is significant with a negative coefficient, indicating that the surface area decreases with the activation temperature. According to Alsalibi et al.[1], an increase of temperature does not always lead to surface area development, and in most cases a decline in surface area is observed at high temperatures especially in the case of chemical activation, where a decline in surface area at high temperatures in range of 450-800 ℃ is often observed[1].
Regarding the effect of activation time, it can be noticed from Table 3 and Fig.1 that the activation time is the most significant factor (p=0) affecting the surface area of the prepared ACs with the highest coefficient value as seen from Table 3. In line with our results , Abechi et al.[3]found that the activation time affects the surface area of the prepared ACs. They have reported that activation time for carbonization affects the overall texture, quality and quantity of the carbonized product, which affects on the ash, moisture and possibly metal contents. Physical characteristics of precursors determine the period required for a full carbonization.
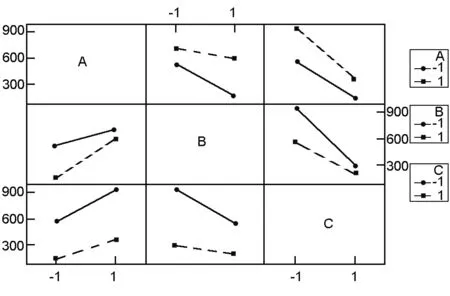
Fig. 2 Interaction plots.
3.2 The interaction effects
An interaction between two factors is in effect when the change in the surface area from the low to high levels of a factor is dependent on the level of a second factor, i.e. when the lines do not run parallel[6]. Fig. 2 shows the plots of interactions between the studied factors (AB, AC, and BC). These plots clearly indicate that the interaction between activation temperature and activation time (BC) is the strongest among them (AB, BC and AC) t as the (BC) and (AB) interactions have less parallel lines. From the data in Table.3 it is also clear that all interactions of factors are significant (p<0.05). The data also show that the interactions (AB) and (BC) have positive coefficients, indicating synergistic effects between each pair of these factors. The interaction (AC) has a negative coefficient signifying an antagonistic effect between the ratio and activation time[15].
The synergistic effect between activation temperature and activation time was earlier explained by Tan et al.[12]who stated that the progressive temperature rise and prolonged activation time would increase the C-KOH and C-CO2reaction rates, resulting in an increasing of devolatilization, which further developed the basic pore structure in the char and also enhanced the existing pores and created new porosities. Similarly, the synergistic effect between the activation temperature and the ratio is mainly because the increase in both parameters enhances the existing pores, leading to an increased surface area and absorption rates. This observation could probably be due to the drastic expansion of the carbon structure, leading to the increase of surface area[16].
The interaction between the three studied factors (A.B.C) was found to be significant (p<0.05) and with a high negative coefficient, implying that combining the three studied factors at their low level was more effective for the production of high surface area ACs.
3.3 Analysis of variance ANOVA
After the estimation of the effects of main factors and their interactions, ANOVA analysis of the data was performed and the results are depicted in Table 4 and it is shown that the sum of squares used to estimate the factors’ effect and theF-ratios are defined as the ratio of the respective mean-square-effect to the mean-square-error. It’s a measure of variation in the data about the mean. The ANOVA of the regression of the model demonstrates that the model is highly significant as evident from the calculatedF-value and the very lowp-value, which defined as the lowest level of significance leading to the rejection of the null hypothesis[6], as the higher the magnitude ofF-value and the smaller thep-value, the higher significance of the coefficient. So it can be concluded that the main factors, the two-way interactions and the three-way interaction are all significant at 5% of probability level (p<0.05). Obviously the three-way interaction is the most effective in the model as all effects have the samep-value but the three-way interaction has the largestF-value.
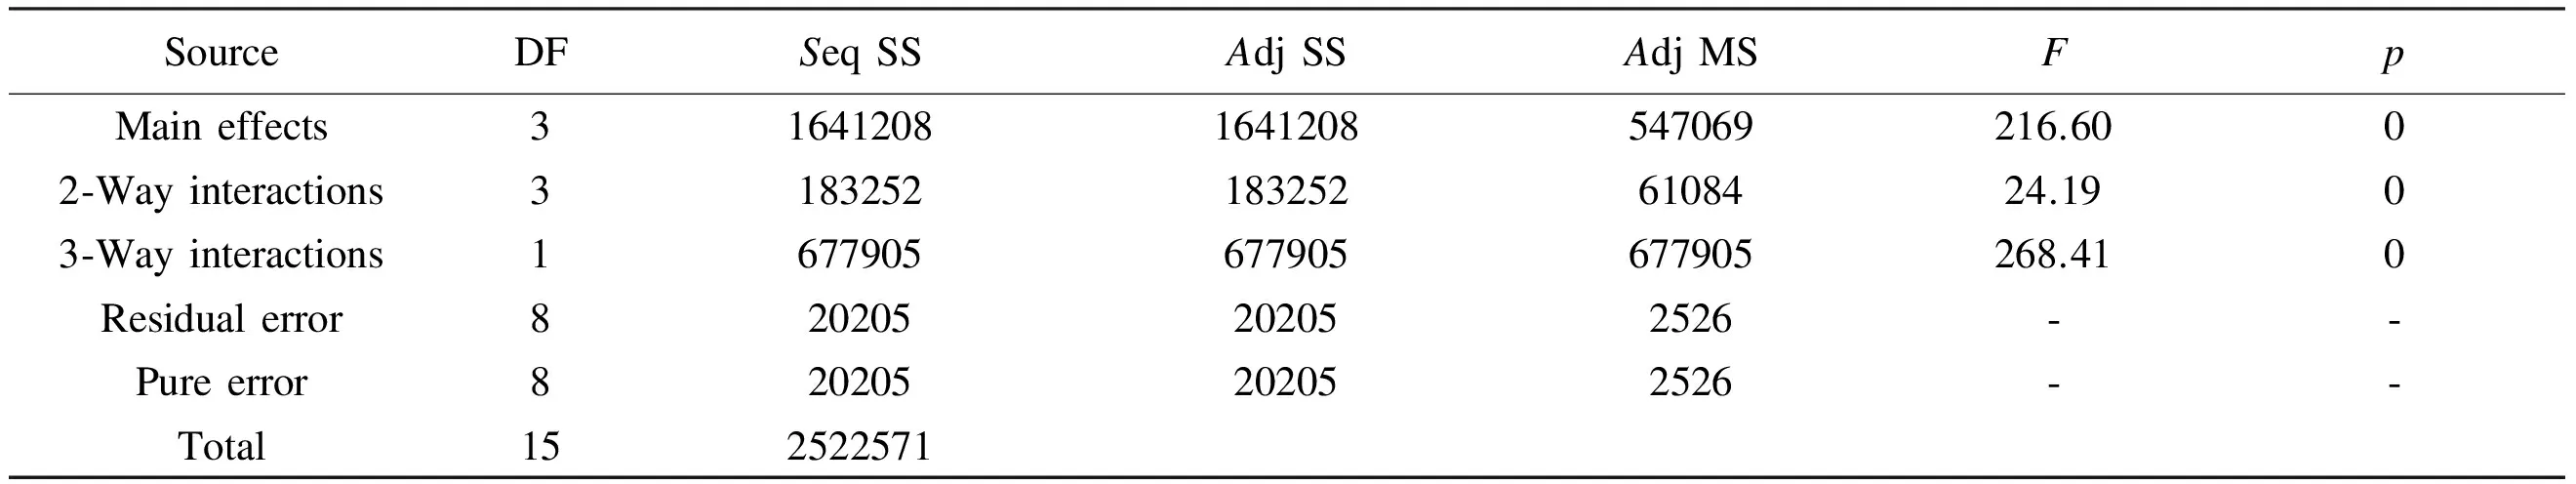
Table 4 Analysis of variances for surface area (coded units).
Note: DF: degree of freedom,Seq SS: sequential sum of squares,Adj SS: adjusted sum of squares,Adj MS: adjusted mean sum of squares,F: fischers variance ratio (factorF) andp: probability.
3.4 The pareto chart
The relative importance of the main effects and their interactions is illustrated in the pareto chart (Fig. 3). Thettest was employed to determine whether the calculated effects were significantly different from zero. It was observed that for a 95% confidence level and eight degrees of freedom, thet-value was equal to 2.31. The vertical line in the pareto chart indicates a minimum statistically significant effect magnitude for a 95% confidence level. Values shown in horizontal columns are the t test values for each effect[10,11,17], they all present an absolute value higher than 2.31, which are located right of the vertical line and significant. Thus, according to Fig. 3, the main factors (A, B and C) and their interactions (AB, AC, BC and ABC) were found to extend beyond the reference line, indicating that they are all significant.
The figure also indicated that the activation time is the most significant effect on the surface area of the AC, then three way interactions (ABC), followed by the ratio, then the activation temperature. The (AC) interaction contributed the least to the development of high surface area AC as it is very close to the reference line in the Pareto chart.
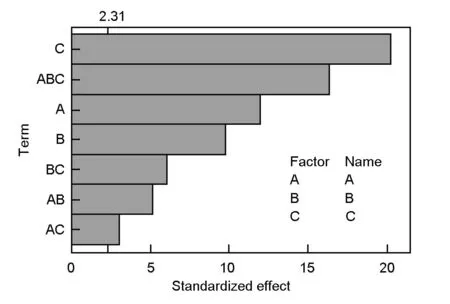
Fig. 3 Pareto chart for surface area.
3.5 Normal probability plots
In order to check if experimental data are normally distributed or not, the normal probability plot of standardized effects was obtained as given in Fig. 4. In this plot, the statistically significant effects are characterized by square signs, which are situated away from the center line whereas the insignificant effects are given by the circle signs which tend to follow a normal distribution[10]. Also, according to Bingol et al.[6], the points far away from the line likely represent the “real” factor effects. From Fig. 4, it can be concluded that the three studied factors (A, B and C) and their interactions (AB, AC, BC and ABC) are considered to be “real” as they are far away from the straight line. The main factors and their interactions (B, C, AC and ABC) which lie on the right of the line all have a positive effect on the response. On the other hand those factors and interactions that are situated to the left of the line (A, AB and BC) have a negative effect on the response. It is also clear from Fig.4 that the activation time (C) has the largest effect because its point lies farthest from the line. The effects of the main factors and their interactions were also found to decrease in the following order: C>ABC>A>B>BC>AB>AC. It is clear that these results confirm the previous Pareto chart analysis and the data of Table 3.
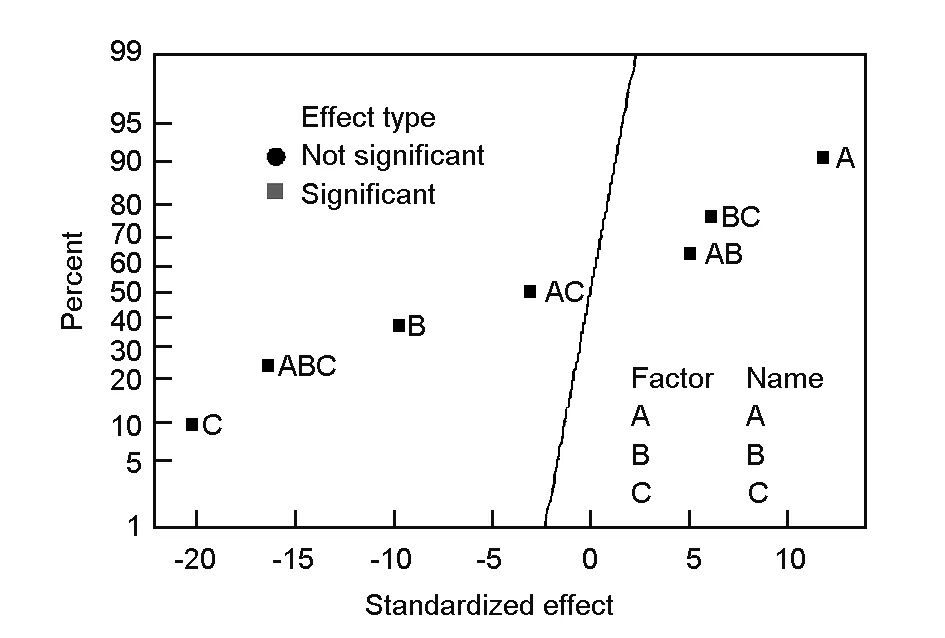
Fig. 4 Normal probability plot of standardized effects.
Another important factor to be considered in the statistical analysis of data is that the data come from a normal distribution. The normality of the data can be checked by plotting a normal probability plot of the residuals. If the points on the plot fall fairly close to a straight line, then the data are normally distributed[18]. The normal probability plot of residuals for the surface area (Fig. 5) shows that the experimental points are reasonably aligned, suggesting a normal distribution. Thus the selected model effectively shows how closely the set of observed values follow the theoretical distribution.
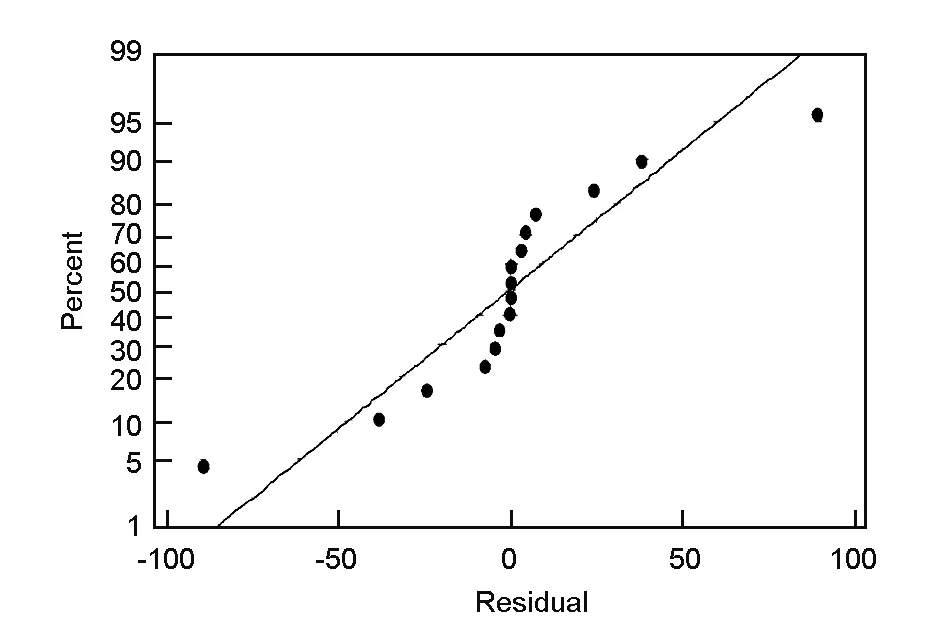
Fig. 5 Normal probability plot of residuals.
3.6 Surface and contour plots
The surface plots of the response functions are useful in understanding both the main and interaction effects of the factors[6]. Fig.6 illustrates the response surface contour plots when one parameter for each graph is at a hold value. This figure also shows the estimatedYparameter as a function of the normalized independent variables, the height of the surface represents the value ofY. After a screening of factors using a full 23factorial design, the surface and contour plots of the response (Y) indicated the same results as observed in the interaction plot (Fig. 4). The contour plots are curved lines because the model contains the interactions of the factors (AB, AC, and BC). Fig.6 reveals that the effect of A was more significant with a low level of B and C, and the effect of B was more important with a low level of C. From the three contour plots, maximum values ofYrequired a low level of the activation temperature and activation time, and a high level of the ratio in agreement with the interaction graphs.
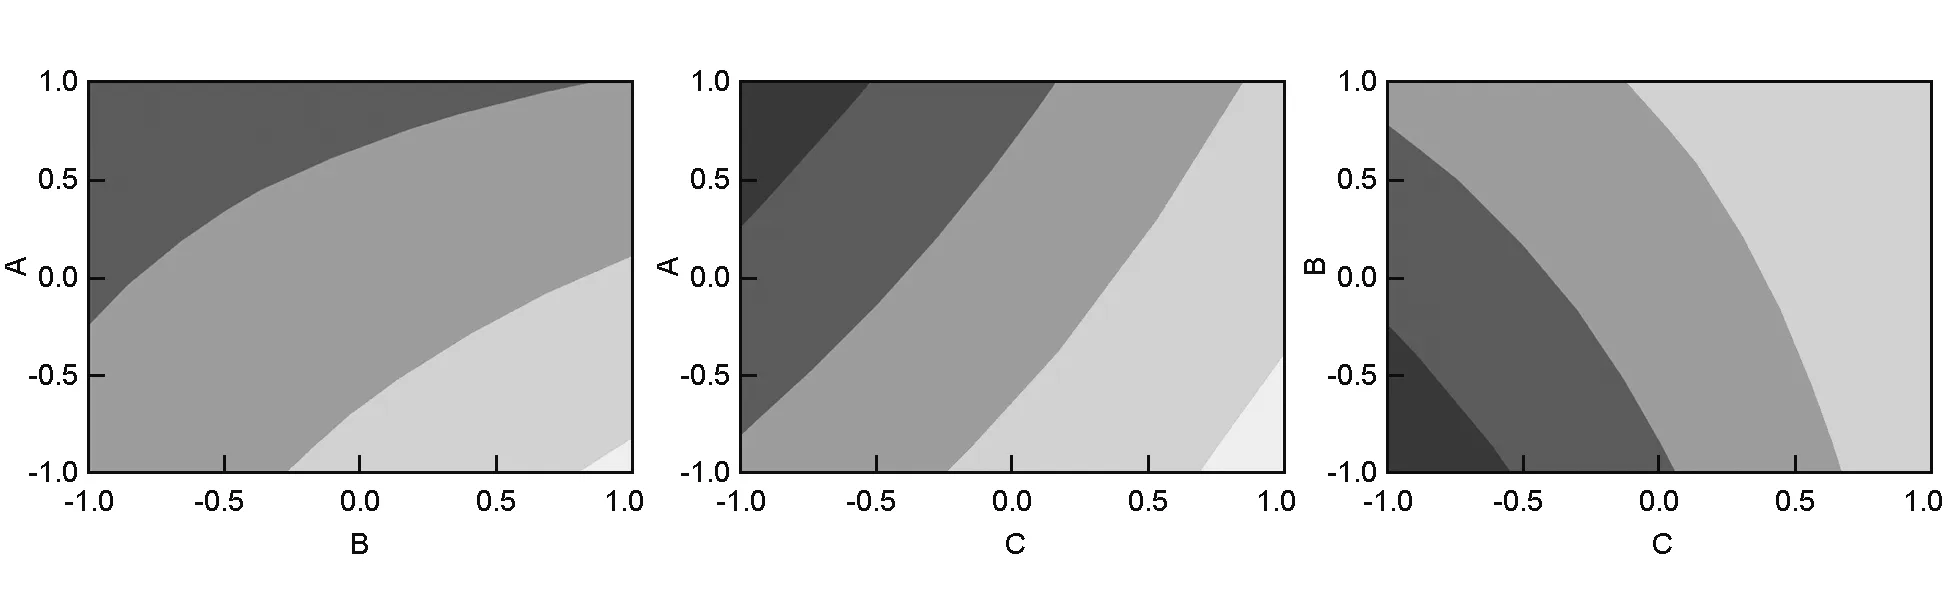
Fig. 6 Contour plots of surface area(A, B; A, C; B, C).
3.7 Desirability function
Finally, in order to get the optimum preparation conditions for olive waste-based AC, a desirability function was applied to the data. The desirability (D) function is used to optimize the process parameters such as the impregnation ration, activation temperature and activation time. The goal of optimization was to improve the surface area of the prepared AC by adjusting the process parameters to a desired level set. The results showed that a desirability of 0.939 is obtained by keeping the three studied factors at their low levels. Thus the AC was optimally prepared at an KOH/char ratio of 2∶1, activation time of 1hour and activation temperature at 600 ℃.
3.8 Characterization of AC
In the present work, information about the chemical structure of olive cake, and the surface chemistry of AC were characterized by FT-IR spectroscopy. The FT-IR spectra of the olive cake and its KOH-activated carbon are shown in Fig. 7.

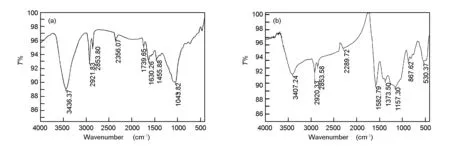
Fig. 7 FT-IR spectra of (a) olive cake precursor and (b) olive cake-based activated carbon.
3.9 SEM analysis
SEM analysis was carried out on the olive cake and its activated carbon prepared under the optimum conditions, to study its surface texture and pore development. Fig. 8a shows the SEM micrographs of the olive cake, it can be noticed that the surface texture of the precursor didn’t contain any pores, implying that it would have small surface area. On the other hand, Fig. 8b shows the SEM micrographs of the AC prepared under the optimum conditions (activation temperature at 600 ℃ for 1 h with a KOH: char ratio of 2∶1).
As can be noticed, Fig.8b shows large and well-developed pores on the surface of the AC. This might be due to the activation, which involved chemical activating by KOH. Pore development in the char during carbonization was also important as this would enhance the surface area and pore volume of the AC by promoting the diffusion of KOH molecules into the pores and thereby enhancing the KOH-carbon reactions, which would create more pores in the AC[22].
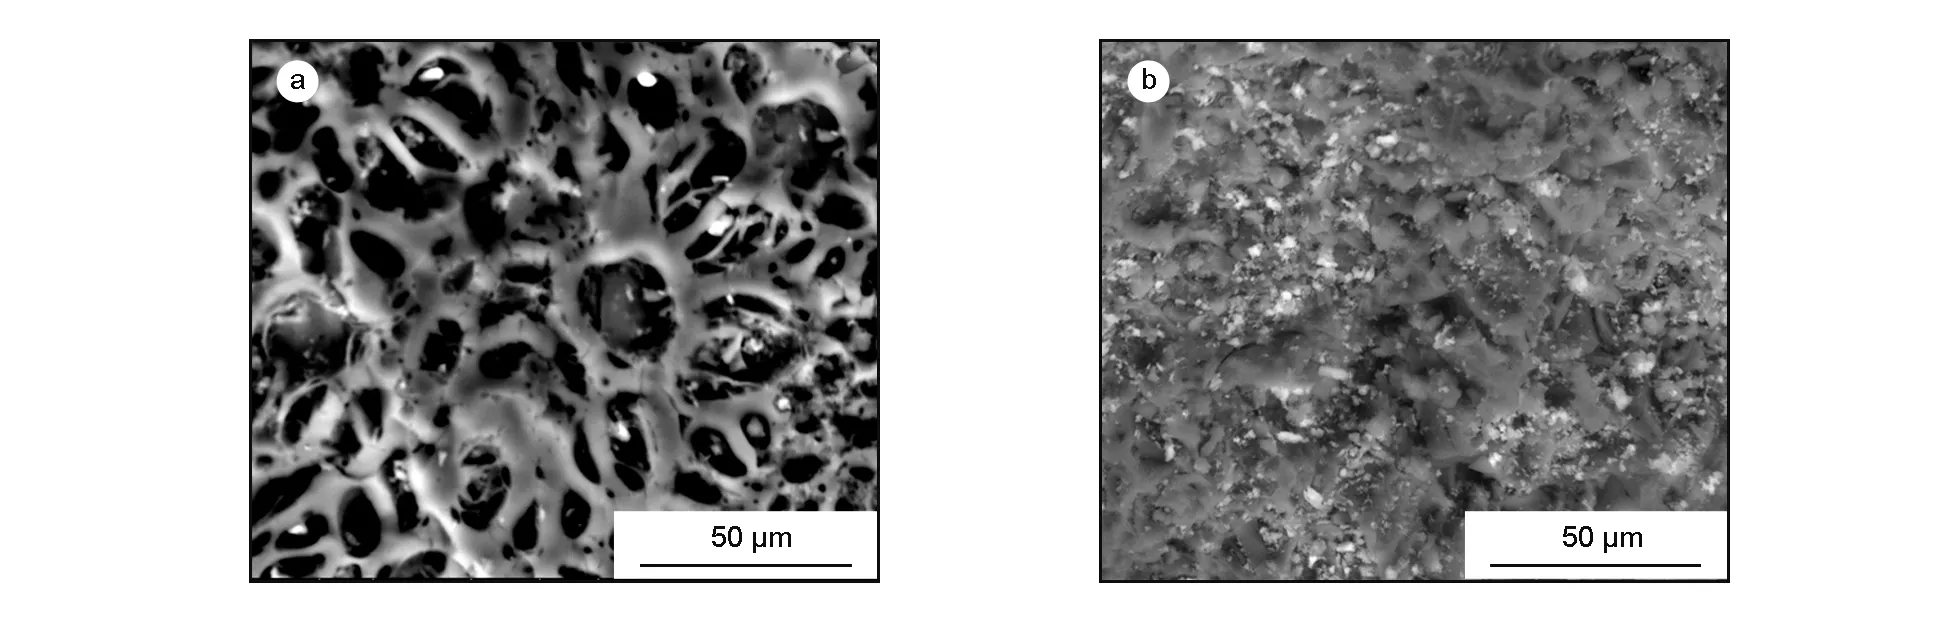
Fig. 8 SEM images of (a) olive cake precursor and (b) olive cake-based activated carbon.
3.10 Nitrogen adsorption
The Nitrogen adsorption isotherm of olive cake-based AC is shown in Fig.9. This adsorption isotherm gives information about the porous structure of the adsorbent. As can be seen, the figure illustrates adsorption isotherm of a type IV according to the IUPAC classification. The type IV isotherm is characteristic properties of solids having both micro and mesopores[23].
The textural characteristics and surface area of the olive cake-based AC are summarized in Table 5. The BET surface area of olive cake-based AC was 672 m2/g, with micropore surface area of 539 m2/g. The total pore volume of the AC was 0.345 cm3/g, with an average pore diameter of 2.0nm. This narrow pore size distribution indicates the suitability of the AC prepared in this work for separation purpose[22]. Similar textural characteristics were previously reported in literature[21,24]where a large number of micropores were developed upon the production of ACs.
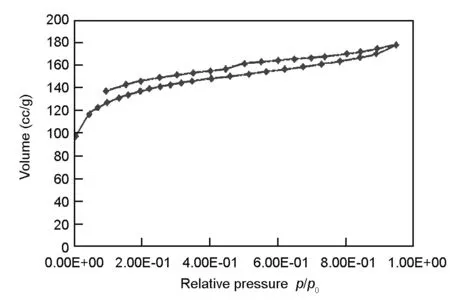
Fig. 9 Nitrogen adsorption isotherms of olive cake-based activated carbon prepared under the optimized conditions
Table 5 Physical properties of olive cake-based AC prepared under the optimized conditions.
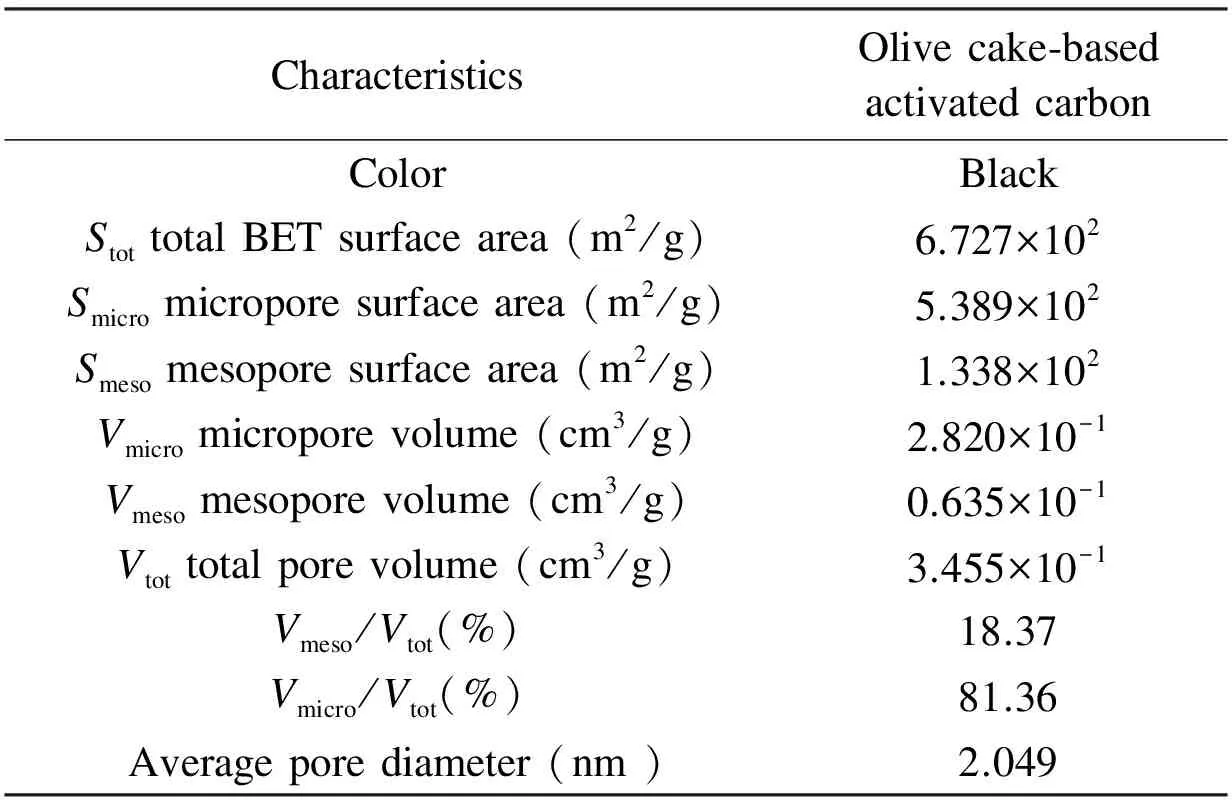
CharacteristicsOlivecake⁃basedactivatedcarbonColorBlackStottotalBETsurfacearea(m2/g)6.727×102Smicromicroporesurfacearea(m2/g)5.389×102Smesomesoporesurfacearea(m2/g)1.338×102Vmicromicroporevolume(cm3/g)2.820×10-1Vmesomesoporevolume(cm3/g)0.635×10-1Vtottotalporevolume(cm3/g)3.455×10-1Vmeso/Vtot(%)18.37Vmicro/Vtot(%)81.36Averageporediameter(nm)2.049
4 Conclusions
The present study revealed that olive cake generated as a waste from olive factories is an attractive precursor for preparation of a high porous AC by KOH activation. The activation conditions for The AC from olive cake was optimally prepared with a char/KOH mass ratio of 1∶2 at 600 ℃ for 1 h using KOH activation. The surface area of the AC was 672 m2/g with predominant micropores and a low fraction of mesopores. The study highlights the preparation of a high quality AC, which can be used as a low cost adsorbent for wastewater treatment purpose.
[1] T Alslaibi, I Abustan, M Azmeir, et al. Comparison of agricultural by-products activated carbon production methods using surface area response Activation processes[C]. Awam International Conference on Civil Engineering (AICCE’12), 2012: 528-538.
[2] M Olivares-Marín, C Fernández-González, A Macías-García, et al. Preparation of activated carbon from cherry stones by physical activation in air. Influence of the chemical carbonisation with H2SO4[J]. J Anal Appl Pyrolysis, 2012, 94: 131-137.
[3] S E Abechi, C E Gimba, A Uzairu, et al. Preparation and characterization of activated carbon from palm kernel shell by chemical activation[J]. Res J Chem Sci, 2013, 3: 54-61.
[4] A El-Hamouz, H S Hilal, N Nassar, et al. Solid olive waste in environmental cleanup: Oil recovery and carbon production for water purification[J]. J Environ Manage, 2007, 84: 83-92.
[6] D Bingol, N Tekin, M Alkan. Brilliant yellow dye adsorption onto sepiolite using a full factorial design[J]. Appl Clay Sci, 2010, 50: 315-321.
[7] A Baçaouia, A Yaacoubia, A Dahbia, et al. Optimization of conditions for the preparation of activated carbons from olive-waste cakes[J]. Carbon, 2001, 39: 425-432.
[8] J M Salman. Optimization of preparation conditions for activated carbon from palm oil fronds using response surface methodology on removal of pesticides from aqueous solution[J]. Arab J Chem, 2014, 7: 101-108.
[9] J T Nwabanne, P K Gbokwe. Preparation of activated carbon from nipa palm nut: Influence of preparation conditions[J]. Res J Chem Sci, 2011,1: 53-58.
[10] S Saadat, A Karimi-Jashni. Optimization of Pb(II) adsorption onto modified walnut shells using factorial design and simplex methodologies[J]. Chem Eng J, 2011, 173: 743-749.
[11] A Rathinam, J R Rao, B U Nair. Adsorption of phenol onto activated carbon from seaweed: Determination of the optimal experimental parameters using factorial design[J]. J Taiwan Inst Chem Eng, 2011, 42: 952-956.
[12] I A W Tan, A L Ahmad, B H Hameed. Preparation of activated carbon from coconut husk: Optimization study on removal of 2,4,6-trichlorophenol using response surface methodology[J]. J Hazard Mater, 2008, 153: 709-717.
[13] B S Patil, K S Kulkarni. Development of high surface area activated carbon from waste material[J]. Int J Adv Eng Res Stud, 2012, I: 2249-8974.
[14] Abdel-Nasser A, El-Hendawy. An insight into the KOH activation mechanism through the production of microporous activated carbon for the removal of Pb2+cations[J]. Appl Surf Sci, 2009, 255: 3723-3730.
[15] S Brainerd, D C Montgomery. Design and Analysis of Experiments [M]. 5th Edition, John Wiley and Sons, New York, USA, 2001.
[16] A Kwaghger, J Ibrahim. Optimization of conditions for the preparation of activated carbon from mango nuts using HCl[J]. Am J Eng Res, 2013, 2: 74-85.
[17] M E R Carmona, M A P da Silva, S G Ferreira Leite. Biosorption of chromium using factorial experimental design[J]. Process Biochem, 2005, 40: 779-788.
[18] A Srinivasan, T Viraraghavan. Oil removal from water by fungal biomass: A factorial design analysis[J]. J Hazard Mater, 2010, 175: 695-702.
[19] R Baccar, J Bouzid, M Feki, et al. Preparation of activated carbon from Tunisian olive-waste cakes and its application for adsorption of heavy metal ions[J]. J Hazard Mater, 2009, 162: 1522-1529.
[20] A C Lua, T Yang. Effect of activation temperature on the textural and chemical properties of potassium hydroxide activated carbon prepared from pistachio-nut shell[J]. J Colloid Interface Sci, 2004, 274: 594-601.
[21] Abdel-Nasser A, El-Hendawy. An insight into the KOH activation mechanism through the production of microporous activated carbon for the removal of Pb2+cations[J]. Appl Surf Sci, 2009, 255: 3723-3730.
[22] B H Hameed, I A W Tan, A L Ahmad. Preparation of oil palm empty fruit bunch-based activated carbon for removal of 2,4,6-trichlorophenol: optimization using response surface methodology[J]. J Hazard Mater, 2009, 164: 1316-1324.
[23] C Saka. Journal of analytical and applied pyrolysis BET , TG - DTG , FT-IR , SEM , iodine number analysis and preparation of activated carbon from acorn shell by chemical activation with ZnCl2[J]. J Anal Appl Pyrolysis, 2012, 95: 21-24.
[24] H Deng, G Zhang, X Xu, et al. Optimization of preparation of activated carbon from cotton stalk by microwave assisted phosphoric acid-chemical activation[J]. J Hazard Mater, 2010, 182: 217-224.
Optimizing the preparation conditions of activated carbons from olive cake using KOH activation
Nour T. Abdel-Ghani1, Ghadir A. El-Chaghaby2, Mohamed H. ElGammal2, El-Shaimaa A. Rawash2
(1.ChemistryDepartment,FacultyofScience,CairoUniversity,Egypt;2.RCFF,AgricultureResearchCenter,Giza,Egypt)
Activated carbons were prepared from olive cake waste by KOH activation. A full factorial 23experimental design was used to optimize their preparation conditions. The factors and levels included are activation temperature (600 and 900 ℃), activation time (1 and 3 h) and impregnation ratio (1∶2 and 1∶4). The surface area of the activated carbons was chosen as a measure of the optimization. The surface and pore properties of the activated carbon obtained at the optimum conditions were characterized by nitrogen adsorption, infrared spectroscopy and scanning electron microscopy. Results indicated that all factors and their interactions are significant (p<0.05). A function was used to correlate the surface area of the activated carbons to their preparation conditions with a correlation coefficient of 99.2%. The activated carbon prepared at the optimum conditions has a BET surface area of 672 m2/g and an average pore size of 2.05 nm with micro and mesopore volumes of 81.36 and 18.37%, respectively.
Olive cake; Activated carbon; Potassium hydroxide impregnation; Desirability function; Porosity
Ghadir A. El-Chaghaby. E-mail: ghadiraly@yahoo.com
Ghadir A. El-Chaghaby. E-mail: ghadiraly@yahoo.com
Nour T. Abdel-Ghani. E-mail: noureta2002@yahoo.com
1007-8827(2016)05-0492-09
TQ127.1+1
A
Authorintroduction: Nour T. Abdel-Ghani. E-mail: noureta2002@yahoo.com
10.1016/S1872-5805(16)60027-6
Receiveddate: 2016-08-01;Reviseddate: 2016-10-06
English edition available online ScienceDirect ( http:www.sciencedirect.comsciencejournal18725805 ).
猜你喜欢
现代装饰(2021年2期)2021-07-21
童话世界(2020年32期)2020-12-25
四川冶金(2019年5期)2019-12-23
中学生数理化·八年级物理人教版(2019年3期)2019-04-25
智富时代(2018年7期)2018-09-03
智富时代(2018年7期)2018-09-03
基层中医药(2018年1期)2018-03-01
学生天地(2017年19期)2017-11-06
岩矿测试(2015年3期)2015-12-21
岩矿测试(2015年3期)2015-12-21