
Experimental tomographic methods for analysing flow dynamics of gas-oilwater flows in horizontal pipeline*
2016-12-26 06:51QiangWANGJiriPOLANSKYBishalKARKIMiWANGKentWEIChanghuaQIUAsaadKENBARDavidMILLINGTON
水动力学研究与进展 B辑 2016年6期
Qiang WANG, Jiri POLANSKY, Bishal KARKI, Mi WANG, Kent WEI, Changhua QIU, Asaad KENBAR, David MILLINGTON
1. University of Leeds, Leeds LS2 9JT, UK, E-mail: pmqw@leeds.ac.uk
2. Industrial Tomography System plc, Manchester M3 3JZ, UK
3. NEL, Glasgow, G75 0QF, UK
Experimental tomographic methods for analysing flow dynamics of gas-oilwater flows in horizontal pipeline*
Qiang WANG1, Jiri POLANSKY1, Bishal KARKI1, Mi WANG1, Kent WEI2, Changhua QIU2, Asaad KENBAR3, David MILLINGTON3
1. University of Leeds, Leeds LS2 9JT, UK, E-mail: pmqw@leeds.ac.uk
2. Industrial Tomography System plc, Manchester M3 3JZ, UK
3. NEL, Glasgow, G75 0QF, UK
Gas-oil-water three phase flow is of practical significance in oil and gas industries. An insight into the dynamics of such multiphase flows is significantly valuable to obtain optimal design parameters and operational conditions. Since flow patterns are sensitive to pipe geometry, flow conditions and thermophysical properties of fluid, it is extremely challenging to provide a universal solution for visualisation of three phase horizontal flows. This study deals with a fully developed, turbulent three phase flow and presents the outcomes of electrical tomographic imaging techniques to visualise gas-oil-water flows in a horizontal pipeline.
multiphase flow regimes, electrical tomography, bubbly flow mapping, Boolean logic recognition, proper orthogonal decomposition method
1. The study
This paper explores a newly developed tomographic method for analysing flow dynamics of gas-oilwater horizontal flows. This includes: the three phase flow visualisation technique with a bubble mapping capability, the online flow regime recognition methods based on the Boolean logic method and the proper orthogonal decomposition (POD) method based on the singular value decomposition (SVD) of measurement matrices.
Experiments were conducted in a 50 m long test section consisting of 4 inch nominal diameter piping within the industrial-scale three phase flow facility at NEL, UK. The local pressure and temperature at the test section were maintained constant at 106Pa and 20oC. Refined oil (HT9) of 830 kg/m3density and 16.18 cP viscosity was used alongside Magnesium Sulfate saltwater substitute (MgS04) of 1 049.1 kg/m3density and 1.35 cP viscosity. Nitrogen gas was supplied externally from a storage tank with density of 12 kg/m3and absolute viscosity of 0.0174 cP. The tested flow conditions included water-cuts from 0% to 100% combined with gas volume fractions (GVF) from 0% to 100%. The total liquid flowrates were varied between 0 and 140 m3/h and the gas flowrates were varied between 0 and 530 m3/h. The flow conditions were carefully obtained using the reference metering and flow monitoring instrumentation featured on the NEL flow facility. A total of 270 measurements were conducted, which produced a variety of flow regimes in the horizontal pipeline, including stratified flow, slug flow, plug flow, bubble flow, and annular flow. Corresponding flow regimes were visualised and determined using the newly developed visualisation methods.
Colour mapping is the most widely utilised technique for visualising gas-liquid flow using electrical tomography systems[1,2]. A well-known limitation of these systems is the relatively low spatial resolution that is unable to identify individual small bubbles within the flow, due to the ill-conditioned problems and limited number of measurements derived from an inverse
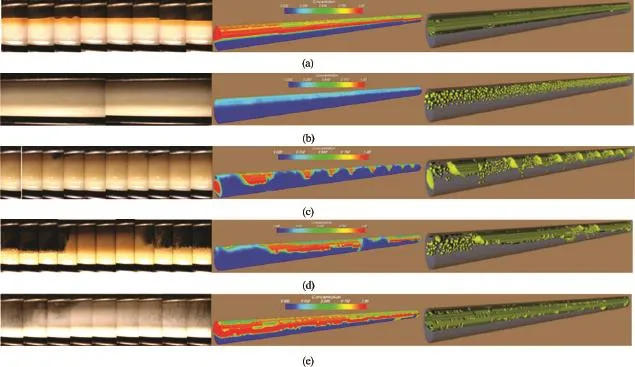
Fig.1 Flow regimes for gas-oil-water flow in horizontal pipeline and flow is from right to left (the left part is taken by photo, the middle one is by conventional colour mapping, and the right one is by newly developed bubbly flow mapping)
solution. As a result, visualisation using tomography conveys limited information regarding multiphase flow dynamics, e.g. bubble size and distribution.
A novel approach, namely bubble mapping, has been proposed to overcome this problem. A new lookup table is built up by means of transferring mean concentration of an interrogation cell into a bubble located randomly inside the cell. Further, an enhanced iso-surface algorithm is applied to isolate large bubbles based on the merging of neighbouring bubbles which mean concentration is beyond certain threshold. Figure 1 demonstrates the results of the approach applied to gas-liquid horizontal flow, with the flow regimes of stratified flow (Fig.1(a)), bubbly flow (Fig.1(b)), plug flow (Fig.1(c)), slug flow (Fig.1(d)), and annular flow (Fig.1(e))[3]. Compared to its counterpart by conventional colour mapping, the new approach is able to reveal extra information. For example, due to the gravitational force, the bubbles in horizontal pipe tend to accumulate at the top of the pipe, and the closer the bubbles are to the top, the more likely they are to coalesce and become larger, which is not fully captured by the conventional method.
A method based on Boolean logic and frequency analysis was used for flow regime online recognition[4]. Flow regimes are usually determined by using subjective methods such as general observation and high speed photography[5]. An objective towards resolving flow regimes was developed by applying Boolean logic analysis to the conductivity data measured by ERT[6]. The relative conductivity signal obtained from the tomograms was converted to binary form in order to perform a Boolean logical operation for typical flow regimes. The overall conductivity of the tomogram was used to extract frequency information of the flow. Each prevailing flow regime was identified through statistical analysis of the combination of this information. Figure 2 depicts the result of the flow regime recognition method for a typical horizontal slug flow where the prevalence of the flow regimes is expressed as percentage.

Fig.2 An example of flow regime recognition of horizontal gasliquid slug flow

Fig.3 Distributions of liquid phase mixture (red), gas phase (blue) and disperse phase (black) concentrations, from different horizontal flow conditions
The POD method was also utilised to identify and analyse typical flow regimes in the horizontal pipeline (Fig.3). The intention of the method for recognition of flow regimes[7]using mathematical decomposition techniques comes from the fact that each regime is characterised by typical dynamic behaviour. To recognise the multiphase flow dynamic structures[8], means indeed the recognition of the prevalent regime to indicate the actual flow conditions of the measurement domain. The direct approach of POD is used to identify a typical multiphase flow instability[9]. Mathematical methods, such as Wavelet Transformation and Kalman Filtering was used as a complementary techniques for detection of multiphase fluid motion and flow structures[10].
In addition, transitions between common flow regimes were also captured and studied. Corresponding concentration profiles were generated using dual-modality electrical impedance and capacitance tomographic (EIT and ECT) systems.
Acknowledgement
This work is part of the European Metrology Research Programme (EMRP) project “Multiphase flow metrology in the Oil and Gas production” which is jointly funded by the European Commission and participating countries within Euramet and the European Union.
2. Conclusion
This abstract reports experimental tomographic methods for analysing flow dynamics of gas-oil-water flows in a horizontal pipeline, including (1) the bubble mapping method and methods of flow regime recognition with (2) Boolean logic method and (3) the POD method. These methods have been used to analyse experiments conducted in a 50 m long test section consisting of 0.1016 m nominal diameter piping within the industrial-scale three phase flow facility at NEL, UK. Results demonstrate that the quality of flow dynamic information obtained from electrical tomography has been significantly enhanced with these methods. It is expected that electrical tomography with these experimental methods can help establish a new infrastructure whereby industrial multiphase flows can be reliably visualised for further analysis, evaluation and verification.
[1] Wang M., Jia J., Faraj Y. et al. A new visualisation and measurement technology for water continuous multiphase flows [J]. Flow Measurement and Instrumentation, 2015, 46: 204-212.
[2] Wang M. Industrial tomography systems and applications [M]. 1st Edition, Sawston, UK: Woodhead Publishing, 2015.
[3] Wang Q., Polansky J., Wang M. et al. Experimental evaluation of dual-modality ECT-ERT systems on gas-oilwater 3-phase flow in horizontal pipeline [C]. 8th World Congress on Industrial Process Tomography. Iguassu Falls, Brazil, 2016.
[4] Karki B., Faraj Y., Wang M. Electrical conductivity based flow regime recognition of two-phase flows in horizontal pipeline [C]. 8th World Congress on Industrial Process Tomography. Iguassu Falls, Brazil, 2016.
[5] Lowe D. C., Rezkallah K. S. Flow regime identification in microgravity two-phase flows using void fraction signals [J]. International Journal of Multiphase Flow, 1999, 25(3): 433-457.
[6] Ramskill N. P., Wang M. Boolean logic analysis for flow regime recognition of gas-liquid horizontal flow [J]. Measurement Science and Technology, 2011, 22(10): 104016-104026.
[7] Polansky J., Wang M. Proper orthogonal decomposition as a technique for identifying two-phase flow pattern basedon electrical impedance tomography [J]. Journal of Flow Measurement and Instrumentation, http://dx.doi.org/10.1016/j.flowmeasinst.2016.10.004.
[8] Polansky J., Wang M., Faraj Y. Numerical modelling of gas-liquid flow phenomena in horizontal pipelines [C]. 12th International Symposium on Experimental Computational Aerothermodynamics of Internal Flows. Genova, Italy, 2015.
[9] Polansky J., Wang M., Faraj Y. et al. Proper orthogonal decomposition as a technique for identifying multiphase flow dynamics structure [C]. International Flow Measurement Conference 2015: Advances and Developments in Industrial Flow Measurement. Coventry, UK, 2015.
[10] Polansky J., Wang M. Multiphase flow pattern recognition in horizontal pipeline using statistical data analyses of electrical impedance tomography [C]. 8th World Congress on Industrial Process Tomography. Iguassu Falls, Brazil, 2016.
(Received June 16, 2016, Revised August 25, 2016)
* Biography:Qiang WANG (1979-), Male, Ph. D. Candidate
Mi WANG,
E-mail: m.wang@leeds.ac.uk

- 水动力学研究与进展 B辑的其它文章
- Development of an adaptive Kalman filter-based storm tide forecasting model*
- Development of Cartesian grid method for simulation of violent ship-wave interactions*
- Numerical study on the effects of progressive gravity waves on turbulence*
- Energy saving by using asymmetric aftbodies for merchant ships-design methodology, numerical simulation and validation*
- Coupling of the flow field and the purification efficiency in root system region of ecological floating bed under different hydrodynamic conditions*
- Modelling hydrodynamic processes in tidal stream energy extraction*