
Fuzzy image restoration using modulation transfer function①
2016-12-29 05:34YuanYuanYiYaohuaLiuJuhua
High Technology Letters 2016年4期
Yuan Yuan (袁 媛), Yi Yaohua, Liu Juhua
(School of Printing and Packaging, Wuhan University, Wuhan 430079, P.R.China)
Fuzzy image restoration using modulation transfer function①
Yuan Yuan (袁 媛), Yi Yaohua②, Liu Juhua
(School of Printing and Packaging, Wuhan University, Wuhan 430079, P.R.China)
The key difficulty of restoring a fuzzy image is to estimate its point spread function (PSF). In the paper, PSF is modelled based on modulation transfer function (MTF). The first step is calculating the image MTF. In the traditional slanted-edge method, a sub-block is always manually extracted from original image and its MTF will be viewed as the result of the whole image. However, handcraft extraction is inefficient and will lead to inaccurate results. Given this, an automatic MTF computation algorithm is proposed, which extracts and screens out all the effective sub-blocks and calculates their average MTF as the final result. Then, a two-dimensional MTF restoration model is constructed by multiplying the horizontal and vertical MTF, and it is combined with conventional image restoration methods to restore fuzzy image. Experimental results indicate the proposed method implementes a fast and accurate MTF computation and the MTF model improves the performance of conventional restoration methods significantly.
fuzzy image, modulation transfer function (MTF), slanted-edge method, automatic computation, MTF restoration model
0 Introduction
Fuzzy images are very common in the digital image processing field and their restoration is of great significance because blurriness in the image not only influences understanding or interpretation for human observers, but also subsequent numerous applications. The essence of restoring fuzzy images is to figure out point spread function (PSF) of the images, which is also the key difficulty to be solved in traditional fuzzy image restoration algorithms. However, PSF is difficult to be estimated in spatial domain since the fuzzy images always suffer from different and complex processing and handling. In the theory of image restoration, PSF and MTF are the expressions of the same physical quantity in spatial and frequency domains respectively, which can be converted to each other by two-dimensional Fourier transform and inverse Fourier transform. Therefore, it is a solution for estimating the restoration model for fuzzy images based on MTF. Then the model can be applied to traditional image restoration algorithms and the fuzzy images can be restored.
The MTF-based fuzzy image restoration algorithms are widely studied in remote sensing images[1-4]. However, researchers mainly focus on the applications and adjustments of MTF to improve the effects of image restoration, while pay little concern about the calculation of MTF values. In Refs[5-7], MTF was combined with conventional restoration algorithms to increase the sharpness of original images. Exponential methods were put forward to stretch MTF curve of images to increase the contrast and clarity[8]. Ref.[9] raised the ability of noise resisting of MTF extraction via enhancing the local image by homomorphic filter algorithm. To further optimize the quality of restored images, MTF was integrated with other algorithms (such as super resolution) to deal with image deburring, and results showed that the estimated precision of PSF was greatly improved[10]. At present, the computation algorithms of image MTF are mainly divided into three categories according to different shape features of the sub-blocks extracted from the image: pinhole image algorithm, slit-image algorithm and slanted-edge algorithm[11-14]. Compared with the other two algorithms, the slanted-edge algorithm is most widely used in practical applications for the following reasons: 1) slanted edges are very common in digital images, leading to a great possibility to obtain slanted-edge sub-blocks for MTF computation; 2) the energy of a slanted edge is larger than that of a pin-hole or a slit, making the MTF results more accurate and robust. However, the existing slanted-edge algorithm has two disadvantages. Firstly, the slanted-edge sub-blocks are usually extracted from images by manual handling and operations, which is inefficient and time-consuming. Secondly, in conventional slanted-edge method, only one sub-block is manually extracted and its MTF is regarded as the result of whole image. Such handcraft extraction is inefficient and will lead to inaccurate results.
In this work, the above two problems are solved by proposing an automatic MTF computation algorithm with the following procedures:
(1) Extracting sub-blocks from original image automatically;
(2) Adopting and improving the traditional slanted-image method for MTF computation for each sub-block;
(3) Averaging the MTF values of all the sub-blocks as the final MTF result of the fuzzy image.
Then, a two-dimensional MTF restoration model will be constructed and combined with the traditional image restoration algorithms to recovery the fuzzy image.
The rest of this paper is organized as follows. In Section 1 an improved automatic MTF computation algorithm is proposed. Then the MTF-based restoration model is constructed and integrated into the conventional fuzzy image restoration methods in Section 2. Section 3 presents two kinds of comparison experiments on MTF computation and fuzzy image restoration. Final remarks are contained in Section 4.
1 Automatic MTF computation
The complete process of fuzzy image restoration using MTF is shown in Fig.1.
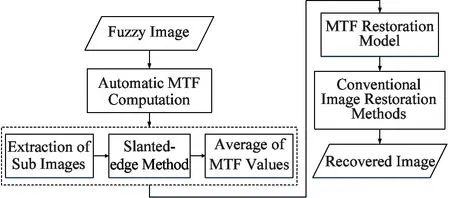
Fig.1 Flowchart of the process of fuzzy image restoration using MTF
1.1 Restricted conditions of sub-blocks
Successful MTF computation for slanted-edge methods requires that selected sub-blocks with edges are limited by some specific conditions. Fig.2 shows the acceptable sub-blocks with slanted edges, which include both vertical edges and horizontal edges.

Fig.2 Acceptable sub-blocks with slanted edges
(1) Contrast
If the slanted-edge sub-block is of low contrast, it means that the differences across edge are small, it will always give rise to unreliable MTF results. Therefore, the contrast of sub-block should be limited. According to experimental results[15], the threshold of image contrast is 0.2.
(2) Edge angle
Edge angle is defined as the angle between the edge and the positive horizontal axis across the lower end of the edge. If the edge angle is too few or too large, there will be few lines across edges, leading to errors in constructing resampled points for the edge. Experiments are put forward to figure out the appropriate edge angles. Since (0, 90] and [90, 180) are symmetrically distributed, different edge angles in (0, 90] are tested and then the corresponding angles in [90, 180) can be obtained.
Three MTF-based metrics, namely feature frequency (f_fre), feature MTF (f_MTF) and MTF Area (MTFA), are adopted to evaluate the MTF computation results of sub-blocks with different edge angles, all of which follow the same law that the larger they are, the better the image quality is. Fig.3 shows the computation results of three metrics of different sub-blocks. Observed from the distributions of three curves, it can be deduced that the optimal edge angle range is (0 30] and [60, 90).
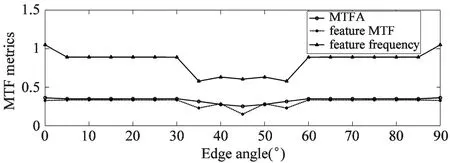
Fig.3 Distributions of three MTF-based metrics of sub-blocks with various edge angles
(3) Edge size
Different edge sizes have little influence on the computation accuracy of MTF. However, when the edge size increases, the sub-block becomes larger as well, which will increase computational capacity. Furthermore, if the edge is too long, it might not be able to extract suitable regions as sub-blocks from fuzzy images with various image sizes. According to previous studies[15], the appropriate edge size is about 128 pixels, with the corresponding sub-block size of 80×100.
1.2 Automatic extraction of sub-blocks
(1) Edge detection. The premise of sub-block extraction is to find out straight lines in the image. Hough transform is an efficient method for line detection since it is of high speed and precision, and easy to implement. The detected line segments are the potential edges of sub-blocks.
(2) Edge screening. According to the three limited conditions of sub-blocks discussed in Section 1.1, the line segments can be screened out.
(3) Extraction of sub-blocks. A sub-block is a rectangle with slanted edges in it. With proper edges obtained, the region of sub-blocks can be extracted by obeying one basic rule: the short sides of the rectangle should both intersect the edges. To simplify the extraction of the rectangle, two ends of the edge are taken as the center point of the short sides. Then both vertical sub-blocks and horizontal sub-blocks can be extracted.
1.3 MTF computation for each sub-block
The slanted-edge algorithm is employed to calculate MTF for each sub-block. The detailed steps are described as follows.
(1) Denoising preprocessing. When restoring the image in frequency domain, noises (high-frequency signals) will be amplified. Hence, self-adapting median filtering is conducted to reduce the noises in the fuzzy image.
(2) Sub pixel location and edge fitting. For each line across the edge, the location of pixel is found which has the biggest gray scale change and get the positions of its neighboring three pixels. Then, a cubic polynomial model can be established (in Eq.1) and the location of sub pixel can be determined since the second derivative of sub pixel equals 0 (in Eqs(2) and (3)). Then the sub pixel line can be fitted with a polynomial curve fitting method.
f(x)=a(1)x3+a(2)x2+a(3)x+a(4)
(1)
f″(x)=6a(1)x3+2a(2)
(2)
x=-a(2)/(3×a(1))
(3)
where x refers to the locations of four pixels (columns for vertical edges and lines for horizontal edges) and f(x) is the gray scale. a(1), a(2), a(3) and a(4) are the coefficients to be solved with known x and f(x).
(3) Pixel resampling and edge spread function (ESF) fitting. According to the fitted sub pixel line, all pixels in fuzzy image are projected and resampled to obtain more points for accurate MTF computation, so it is with their corresponding gray scales. Then the Fermi function (in Eq.(4)) is used to fit the ESF curve because of its superior fitting effect and strong ability to suppress noises.
f(x)=a/(1+e)
(4)
where x is the locations of resampled points and f(x) is their corresponding gray scales, a expresses the amplitude, c reflects the steepness of the ESF curve, and b is the horizontal axis of the symmetric center of the curve. They can be figured out with known x andf(x).
(4) Line spread function (LSF) computation. LSF is the first order difference of ESF (in Eq.(5)). However, experimental results shows that the number of effective MTF values is not enough and might lead to errors. To increase the number of MTF values, the zero padding method is adopted to the both ends of the LSF curve, as is shown in Fig.4.
LSF(n)=ESF(n)-ESF(n-1)
(5)
where n is the number of resampling points.
(5) MTF computation. Perform Fourier transform to LSF curve and normalize all the results by the largest magnitude of the first point.
MTF(n)=|DFT(LSF(n))|
(6)
norm_MTF(n)=MTF(n)/MTF(1)
(7)
where norm_MTF(n) means the normalized MTF values.

Fig.4 contrast of MTF before and after zero padding to LSF curves
1.4 Computation of MTF for overall image
Since the extracted sub-blocks consist of vertical and horizontal edges, the final MTF result is made up of two components: vertical MTF vector and horizontal MTF vector. They are calculated by firstly performing the slanted-edge method on all the sub-blocks of two directions and then averaging the whole MTF values to get the final MTF result.
2 MTF-based fuzzy image restoration
The construction of restoration model is the main problem to be solved in conventional image restoration methods. In this paper, a two-dimensional restoration model based on MTF values is established by multiplying the vertical MTF vector and the horizontal MTF vector of the fuzzy image (in Eq.8).
MTF(u,v)=MTFu×MTFv
(8)
where u and v refer to vertical and horizontal directions, MTFuand MTFvare vertical and horizontal MTF vectors.
When constructing a two-dimensional MTF model, the symmetrical mapping method is adopted, namely, MTF values in the MTF model are the same in the range of equal-length radius with the model center as the center of a circle. The MTF values of frequencies in [0.5, 1] are close to 0 and thereby have little impact on constructing the MTF model used to describe the point spread in fuzzy images. As a result, only the MTF values in [0, 0.5] are employed.
The size of MTFu,v, which is determined by the sizes of vertical and horizontal MTF vectors, is much smaller than that of the fuzzy image to be restored. Therefore, MTFu,vis interpolated with the bicubic interpolation algorithm so that it can be applied to traditional image restoration algorithms. In this paper, three image restoration methods are adopted to recover the fuzzy image: Wiener filtering (referred to as ‘WN’) algorithm, constrained least square (referred to as ‘CLS’) filtering and regularized Lucy-Richardson (referred to as ‘RLR’) algorithm.
3 Experiments
3.1 Evaluation metrics
Objective evaluation metrics are adopted to measure the performance of image restoration methods. Three types of metrics, which contain seven indicators, are employed in the paper.
(1) MTF based metrics
The f_fre, f_MTF and MTFA are used to evaluate the clarity for restored images. Larger indicators suggest a better image quality.
(2) Gray scale metrics
① Signal noise ratio (SNR). It measures the amounts of noises in the images[16]. Larger SNR indicates fewer noises the image has.
(9)

② Gray mean grads (GMG). It describes the definition of image and sensitively reflects the contrast in details and texture properties[16]. Larger GMG means higher image clarity.
GMG=
(10)
③ Contrast. It has the same effect as the definition with respect to image quality. The larger the contrast is, the deeper the textures are, and the clearer the visual effects are[16].
(11)

(3) HVS metric
Just noticeable difference quality loss (JNDQL) describes the degeneration degrees of image quality perceived by human visual systems. The smaller it is, the better the image quality is. The implementation process is as follows:
First, calculating the perceptual acutance of the image using contrast sensitivity function (CSF):
(12)

(13)
where v refers to the spatial frequency, a=75, b=0.2, c=0.8 and K=34.05[17].
Second, researches indicate there exists an objective metric (OM)[17]which has a certain relation with perceptual acutance. When acutance is less than 0.8851, the smaller OM is, the clearer the image will be. While it is greater than 0.8851, the perceptual image will be very approximate to pristine image, and the visual quality is no longer linear to acutance.

(14)
Third, calculating the JNDQL based on OM:
(15)
3.2 MTF computation experiment
To verify the effectiveness and accuracy of the proposed automatic MTF computation method, a publicly available computation software, which is sfrmat[18], is adopted to conduct the contrast experiment. Sfrmat software is a Matlab tool that analyzes the spatial frequency response (SFR) from an image which contains a slanted edge. It is developed to measure the resolution for electronic cameras according to standard ISO 12233.
In this experiment, both the proposed method and sfrmat are used to calculate the MTF values of the 515×600 pixel standard test image for resolution measurements. Both methods are performed with Matlab R2014a on computers with Intel Core i7-4770 3.4GHz and 8GB RAM.
As is shown in Fig.5, the proposed method automatically extracts 14 sub-blocks from the standard test image, including five vertical and nine horizontal sub-blocks. In Fig.6(a) and (b), the MTF calculation results of all the sub-blocks in two directions are displayed and the two black curves in bold are their averages. From the distributions of MTF values, it is obvious to find that there exist some abnormal values and the computation errors caused by them can be minimized by calculating the averages of all the MTF values. With respect to sfrmat, only two sub-blocks, one vertical and one horizontal sub-block, are manually extracted and used to calculate the SFR values with sfrmat software.

Fig.5 Standard test image for resolution measurements and extracted sub-blocks by proposed method
Fig.6(c) shows distributions of SFR results by sfrmat and the average MTF results by the proposed method. The differences between them are minor. Besides, feature MTF and feature frequency of the two curves are very close. The main causes for the small difference are the different number of resample points and different fitting functions adopted in the two algorithms.

(a) Vertical MTF values

(b) Horizontal MTF values

(c) Comparison between sfrmat and the proposed method
Table 1 shows the average MTF computation time of one sub-block by sfrmat and the proposed method. The time of sfrmat is figured out by calculating the statistical average of 20 tests. The proposed automatic MTF computation method costs much less time than sfrmat. This is because the proposed method is fully automatic computation while sfrmat requires that we manually select appropriate sub-blocks.
As is shown in this comparison experiment, despite the minor calculation differences, the calculation accuracy of the proposed automatic MTF computation method is comparable to sfrmat. In addition, the proposed method has the advantages of fast and automatic MTF computation, demonstrating its effectiveness and reliability in practice.
Table 1 Time consumed by calculating the MTF values of a sub-block in the standard test image using two methods

MethodsAveragetimepersub⁃block(s)Sfrmat15.84ProposedautomaticMTFcomputationmethod4.21
3.3 Fuzzy image restoration experiment
To evaluate the performance of the two-dimensional MTF restoration model in image restoration algorithms, three groups of comparison experiments are carried out on three fuzzy images, including a natural scene (NS) image (in Fig.7(a)) from LIVE database[19], a remote sensing (RS) image (in Fig.8(a)) and an image made by adding Gaussian noises to the RS image (GNRS) (in Fig.9(a)). They are restored by the following restoration methods, the conventional image restoration methods (‘WN’, ‘CLS’, ‘RLR’), their corresponding MTF-based methods (referred to as ‘M-WN’, ‘M-CLS’ and ‘M-RLR’), and a blind deconvolution (referred to as ‘BD’) algorithm[20-22].

Fig.7 Restoration results of the NS image
The NS and RS images are tested to validate effectiveness of MTF model to conventional restoration methods. The GNRS image is used to test the anti-noise ability of the restoration methods. For clear observations on image details, the same local regions of GNRS image and its restored images are shown in Fig.9(b)~(i). Besides, the evaluation results are listed in Table 2, Table 3 and Table 4, respectively. The best three values of each indicator are shown in bold.

Fig.8 Restoration results of the RS image

Fig.9 Restoration results of local regions of the GNRS image
Fig.7 and Fig.8 indicate that, from the perspective of human visual perception, the restoration effects of algorithms using MTF models are superior to the conventional ones. Take Fig.7 for example, the edges of the texts on the plane in Fig.7(f), (g) and (h) become very sharp and the details of grasses on the ground are clearly represented after restoration with MTF-based methods. However, the results of the other conventional algorithms show small improvements in visual effects. The textures in Fig.7(b), (c), (d) and (e) are relatively unclear and their contrast seems insufficient. The subjective judgment can be confirmed by the quantitative image quality evaluation metrics in Table 2 and Table 3. All the metrics of M-WN and M-CLS achieved the best three values, which demonstrates significant effectiveness of MTF models in promoting the quality of fuzzy images for WN and CLS. However, it has little influence on RLR algorithm.
Fig.9 shows the restoration results of local regions of GNRS image. For the NS image and RS image which have no noises, the restoration results of M-WN and M-CLS are very close from both subjective and objective evaluations. But, for the GNRS image, it seems that CLS and M-CLS achieved better performance than M-WN according to the evaluation indicators in Table 4. However, as shown in Fig.9, it is not consistent with the subjective observations that M-WN is superior to both CLS and M-CLS. The reason for this phenomenon is that, compared to M-WN algorithm, the Gaussian noises in the GNRS image are greatly increased in the recovering process of CLS and M-CLS. As a consequence, M-WN has a stronger anti-noise performance than CLS and M-CLS. Besides, RLR shows a good ability of restraining noise reflected by higher SNR values as well.
All in all, the MTF restoration model greatly improves the restoration performance by conventional restoration methods. Among them, the MTF-based wiener filtering algorithm has the best performance in both restoration effects and noise suppression.

Table 2 Quality evaluation results of the natural scene image
*Best three values of each indicators are shown in bold.

Table 3 Quality evaluation results of the RS image
*Best three values of each indicators are shown in bold.

Table 4 Quality evaluation results of the GNRS image
*Best three values of each indicators are shown in bold.
4 Conclusions
This study presents an improved fuzzy image restoration approach based on the image MTF. This approach firstly improves the conventional slanted-edge method by automatically extracting multiple sub-blocks from original image and calculating the average MTF values to reduce the abnormal errors, and secondly recoveries the fuzzy image by establishing the two-dimensional MTF restoration model and combining it with the conventional image restoration algorithms. According to the comparison experimental results of MTF computation and fuzzy image restoration, the improved automatic slanted-edge algorithm achieves a rapid and accurate MTF calculation for fuzzy images, and the MTF model improves the performance of conventional restoration algorithms significantly. Since not all the digital images are equipped with slanted edges, researching on sub-blocks with other shape features can provide more solutions for automatic MTF computation in the future work.
[ 1] Wang H N, Zhong W, W Jing, et al. Research of measurement for digital image definition. Journal of Image and Graphics, 2004, 9(7): 828-831 (In Chinese)
[ 2] Mu X. Remote Sensing Image Restoration Based On Spatial Optics Remote Sensor MTF Compensation: [Ph.D dissertation]. Changchun: Changchun Institute of Optics, Fine Mechanics and Physics, Chinese Academy of Sciences, 2012. 16 (In Chinese)
[ 3] Li T C. Research On Modulation Transfer Function Calculation and Remote Sensing Image Restoration Based On Slanted-edge Method: [Ph.D dissertation]. Hangzhou: College of Optical Science and Engineering, Zhejiang University, 2011. 20-21 (In Chinese)
[ 4] Zeng Y, Chen S P, Yu J. Modulation transfer function compensation technology of optical remote sensing imaging system. Chinese Space Science and Technology, 2010, 30(4): 38-43 (In Chinese)
[ 5] Gu X F, Li X Y, Min X J, et al. CBERS-02 satellite CCD camera MTF on-orbit measurement and MTF compensation. Science in China (Series E: Technological Sciences), 2005, 35: 26-40 (In Chinese)
[ 6] Reimann D A, Jacobs A, Holly A. Use of wiener filtering in the measurement of the two-dimensional modulation transfer function. In: Proceedings of SPEI 3977: Physics of Medical Imaging, San Diego, USA, 2000. 670-680
[ 7] Wang C, Gu X F, Yu T, et al. On-orbit MTF measurement and image restoration for ZY-3 satellite. Computer Engineering, 2014, 40(4): 237-241 (In Chinese)
[ 8] Wang X H, Qiao Y L, Hong J. A technique of RS image restoration and in-flight measurement of remote sensor MTF. Remote Sensing Technology and Application, 2006, 21(5): 440 (In Chinese)
[ 9] Meng W, Jin L X, Li G N, et al. Application of MTF in remote sensing image restoration. Infrared and Laser Engineering, 2014, 43(5): 1690-1696 (In Chinese)
[10] Liu Y Y, Jin W Q, Su B H. Identification of blurred system based on super-resolution reconstructing image schemes. Journal of Optoelectronics Laser, 2005, 16(2): 213-215 (In Chinese)
[11] McGillem C D, Anuta P E, Malaret E, et al. Estimation of a remote sensing system point spread function from measured imagery. In: Proceedings of the Machine Processing of Remotely Sensed Data, West Lafayette, USA, 1983. 81
[12] Dominique L, Joel D, Francoise R. MTF measurement using spotlight. In: Proceedings of the International Geoscience and Remote Sensing Symposium (IGARSS), Pasadena, USA, 1994. 2010-2012
[13] Cao X H, Huang H K, Linaglou S. A novel algorithm for measuring the MTF of a digital radiographic system with a CCD array detector. International Society for Optics and Pho-tonics, 2000, 3922: 580-589
[14] Dennis D L, Helder T, Choi. IKONOS Satellite in Orbit Modulation Transfer Function (MTF) Measurement Using Edge and Pulse Method: [Ph.D dissertation]. Brookings: Electrical Engineering Department, South Dakota State University, 2002. 45
[15] Yuan Y, Yi Y H, Miao M J. An automatic calculation method of MTF and the application in blurred images restoration. Applied Mechanics and Materials, 2015, 731: 141-146
[16] Jia Y H. In: Digital Image Processing. Wuhan: Wuhan University Press, 2006. 182-184
[17] International Imaging Industry Association. P1858 Standard for Camera Phone Image Quality. New York, USA: IEEE Standards Association, 2012
[18] Estribeau M, Magnan P. Fast MTF measurement of CMOS imagers using ISO 12233 slanted-edge methodology. In: Proceedings of SPIE - The International Society for Optical Engineering, Saint-Etienne, France, 2003. 243-252
[19] Sheikh H R, Sabir M F, Bovik A C. A statistical evaluation of recent full reference image quality assessment algorithms. IEEE Transactions on Image Processing, 2006, 15: 3440-3451
[20] Gonzalez R C. Digital Image Processing Using MATLAB. Beijing: Publishing House of Electronics Industry, 2005.126-133
[21] Yan H, Yan W J, Li W W. Image restoration based on Lucy-Richardson algorithm. Computer Engineering, 2010, 36(15): 204-205 (In Chinese)
[22] Jia H P. Blind deconvolution algorithm in application of image restoration. Information Technology, 2011, 5: 38-39 (In Chinese)
Yuan Yuan, born in 1989. She has been working toward her Ph.D degree with Professor Yi Yaohua at the School of Printing and Packaging of Wuhan University. She received her M.S. degree in computer science and technology from Wuhan University, Wuhan, Hubei province, China, in 2011. Her current research interests include image quality assessment and image processing.
10.3772/j.issn.1006-6748.2016.04.016
① Supported by the National High Technology Research and Development Programme of China (No. 2012AA12A305), the National Key Technology R&D Program of the Ministry of Science and Technology (No. 2013BAH03B01), Fundamental Research Funds for the Central Universities of China (No. 2042015kf0059) and China Postdoctoral Science Foundation (No. 2015M582277).
② To whom correspondence should be addressed. E-mail: yyh@whu.edu.cn Received on Nov. 10, 2015,
 High Technology Letters2016年4期
- High Technology Letters的其它文章
- Clustering approach based on hierarchical expansion for community detection of scientific collaboration network①
- Integration of naval distributed tactical training simulation system based on advanced message queuing protocol①
- A visual awareness pathway in cognitive model ABGP①
- Measurements and analysis at 400MHz and 2600MHz in corridor radio channel①
- A buffering method for quadruped robots based on active impedance control①
- Fluid simulation of internal leakage for continuous rotary electro-hydraulic servo motor①