
The Region of Interest in Boundary Calibration for Palatal Rugae Image of Forensic Identification
2020-12-06 11:16ZHANGXiongLIBingSHANGGUANHongLUOQiang
法医学杂志 2020年5期
ZHANG Xiong,LI Bing,SHANGGUAN Hong,LUO Qiang
(1.School of Electronic Information Engineering,Taiyuan University of Science and Technology,Taiyuan 030024,China;2.Stomatology Hospital,Shanxi Medical University,Taiyuan 030001,China)
Abstract:Objective To examine the method of least-square fitting for calibrating the palatal rugae boundary.Methods According to the distribution of the teeth,the feature points were selected;when they were fit,the boundary of the palatal rugae area was created,thereby constructing a mask.The mask was used to remove the part located outside the boundary and filter out the interference.Three samples were utilized for the experiments and analyses to come.Results To evaluate the quantitative results of the fitting curves,the correlation coefficients(r)of the samples and the relationship between the actual mean value and ideal mean value was obtained through six fitting processes.The differences between the actual mean and ideal mean were found to be significantly small(from 0.285 7 to 2.500 0)in the six fitting processes,with the range of r close to 1(from 0.989 6 to 0.999 5).Conclusion The effect of the cubic polynomial fitting method adopted in this study was stable.The proposed boundary calibration method can effectively locate the palatal rugae boundary and remove the interference area,further promoting the practice of forensic identification.
Keywords:forensic anthropology;forensic dentistry;palatal rugae;individual identification;boundary calibration;least square fitting;region of interest
Introduction
With the rapid development of modern forensic science and artificial intelligence technology,there is an urgent need for a fast and effective method of biometric identification[1-2].In addition to fingerprints,iris,face,palmprints,and DNA,palatal rugae is a particular biological feature for forensic identification.Palatal rugae has the nature of universality,stability,and uniqueness,which meets the requirements of biometric identification[3].Recently,most of the studies focus on the description of palatal rugae and the coding of palatal fringes[4-7].Since 2014,our research group has committed to the construction of palatal rugae digital recognition system in forensic identification based on the analysis of physiological and statistical characteristics of palatal rugae[8-10].This increases the complexity and difficulty of the recognition that the acquired palatal rugae images contain much interference information involving the teeth and lips.Therefore,it is necessary that the boundary of the region of interest in palatal rugae image be located to filter out the interference information.In one traditional method palatal rugae data are obtained from a plaster model,by describing the palatal rugae morphology map on the model using a 2B graphite pencil,and combining the shape,number,position,distribution and other characteristics of the palatal rugae[8].In another the edge detection algorithm is used to extract the edges of the palatal rugae image[10].At present,there is no effective algorithm to locate the region of interest in a palatal rugae image.In our study,we utilized the least square fitting method to calibrate the edge of the region of interest in the palatal rugae image,the key parts of which covered the selection of feature points,boundary fitting and mask filtering.
Materials and methods
Materials and instruments
In this study were involved such experimental materials as 1) CPU:Intel®CoreTMi5,3.3 GHz;2) Graphics card:Nvidia GeForce GTX 960(4 GB);3)Memory:8 GB;4)Operating system:Windows 7 64 bit SP1;and 5)Matlab 2018a.
The instruments referred to Canon EOS 300D(Canon Inc.),Dental Orthodontic Special Reflector(Sowdane Inc.),Adobe Photoshop CS6(Adobe Inc.),and Matlab 2018a(MathWorks Inc.).
Research participants
A total of 100 patients,50 males and 50 females,were randomly selected from May 2018 to October 2018 in the Stomatology Hospital of Shanxi Medical University,for each of whom were collected 6 palatal rugae images.The inclusion criteria were as follows:1)> age of 18,2)no history of skull and jaw trauma,and 3)no history of orthodontics.The exclusion criteria were:1)palatal rugae with deformities,scars,and trauma;2) prior to orthognathic surgery;3) undergoing orthodontic treatment;4)history of wearing jaw dentures;and 5)a habit of smoking.In the process of the data collection,we strictly followed the relevant regulations and conducted the research according to the predetermined plan.This study was approved by the Medical Ethics Committee of Shanxi Medical University(No.2018LL155).
Image processing
The overall flow chart was developed for the region of interest in the boundary calibration for palatal rugae image(Fig.1).
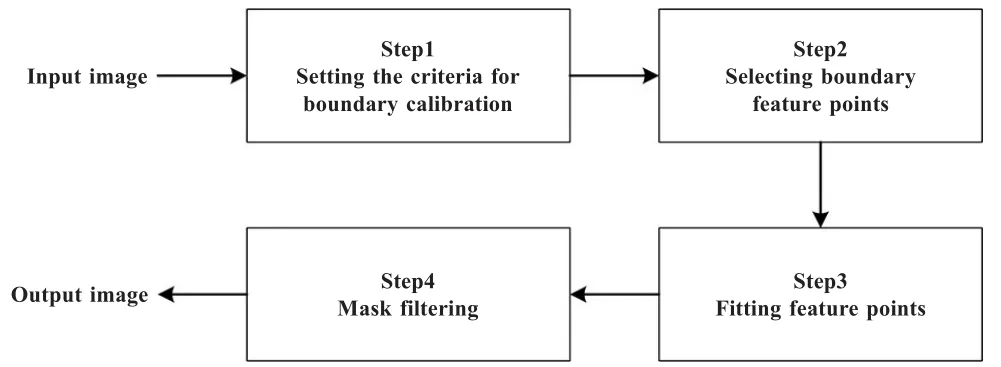
Fig.1 The overall flow chart
Step 1:Image acquisition
The criteria for boundary calibration were set to determine the selection principle of feature points,and to define the evaluation criteria for the best fitting curve.
To obtain the high resolution and valuable intraoral palatal rugae images,Canon EOS 300D was placed in a fixed position with the same camera parameters and fixed focal length.The camera was equipped with specially customized equipment to unify image standards.Preliminary image cropping was performed using Adobe Photoshop CS6,the images in JPEG format transferred to a computer where a palatal rugae image database was created.
Step 2:Feature points selection
In order to better fit the boundary of the palatal rugae region,the geometric center point of the edge of each tooth or the tip point of the tooth root was selected as the boundary feature points for fitting in this work.The number of the feature points,denoted byn,was set according to the number of the teeth appearing in a palatal rugae image,and the location of the feature points was determined by the geometric center of the tooth edge.
Step 3:Feature points fitting
According to the geometric characteristics of the boundary of the palatal rugae region,the selected feature points were fitted into a parabolic curve using the least-square fitting method[11].When the coordinates of the selected points were assumed to be(xi,yi)(i=0,1,2,…,l),the total number of the samples wasl+1,and the value oflwas determined by the number of the teeth in a specific image.The curve fitting was performed as indicated by the following procedure.
A:A scatter plot was drawn by utilizing the coordinates of the feature points determined in the previous step.When the biggest index of the fitting polynomial was supposed to bem,the fitting polynomial was expressed as follows:

In the formula,xrepresents the input variable of the polynomial;a0,a1,…,amstand formcoefficients that need to be determined;kdenotes the power ofx.
B:According to least squares fitting theory,the cost function of the fitting polynomial was described as follows:

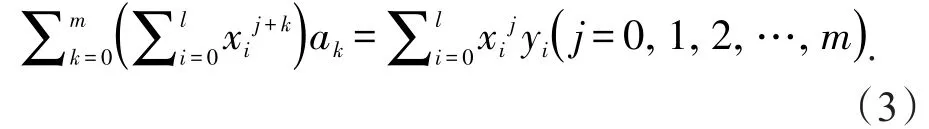
The derivations ofa0,a1,…,amcalculated from the above formula separately,and set to zero,the equation that the coefficientsa0,a1,…,amshould satisfy was obtained:
C:A calculation was made of∑xiand∑xiyi.
D:The subsequent results were substituted into the equation in Step 2,and the coefficientsa0,a1,…,amof the polynomial were solved.
E:The fitting polynomial was acquired,as shown in Formula(1).
After that,least square fitting method was applied to fitting the curve of the selected feature points.
Step 4:Mask filtering
A mask was constructed by following the position relationship between the coordinate of the fitted boundary and that of the image.With the mask,the interference information was filtered out.Specifically,the method was to traverse all the pixels in the image,process the palatal rugae image with the demarcated boundary by pixel assignment,and set to 0 the gray value of the coordinate points(i.e.the pixels on the upper side of the curve)located outside the fitting curve.
Traditional approaches
A traditional approach was to acquire the palatal rugae ROI[8],obtaining palatal rugae data from a plaster model by describing the palatal rugae morphology map on the model using a 2B graphite pencile,and combining the shape,number,position,distribution and other characteristics of the palatal rugae.The palatal rugae morphology map coding was analyzed comprehensively and systematically,before ultimately used in forensic identification.
Another traditional approach was to obtain the palatal rugae ROI[10]using an edge detection algorithm to extract the edges of a palatal rugae image.
Simulation experiment and analysis
The experimental parameters were as follows:To verify the applicability of the proposed method,three typical samples were selected from the palatal rugae data sets,which were denoted as Sample 1,2,and 3,respectively.To minimize the interference,the assign-ment constantvof pixels outside the boundary was set to 0.
The three samples were fitted by three types of polynomials so as to find the polynomial that would achieve an ideal fitting effect of the palatal rugae image,with the highest number of termsmof the fitting polynomials set to be 2,3 and 4 in turn.By comparing the fitting results,the general polynomial with the best fitting results was thus determined.
Statistical analysis
To analyze the fitting effect of the proposed method,three selected samples were fitted by six times of trinomial fitting.The manually selected boundary points were taken as the standard points.The goal of the fitting curve was to connect each standard point as accurately as possible,rbeing a multivariate regression coefficient with a range of 0 to 1.The greater therwas,the better the correlation.The formula for calculatingrwas as follows:
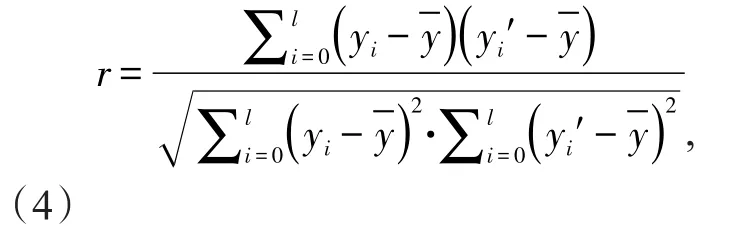
Where,rrepresents the correlation coefficient betweenyi;yi′is used to evaluate the fitting effect;yiis the real ordinate value of the standard point denoted by the ideal value;yi′is the measured ordinate value of the fitting curve at the same horizontal position denoted by actual values;represents the mean value ofyi.
Results
As indicated by the red dots in Fig.2,the boundary feature points were manually selected,the number of which denoted bynwas the same as the number of the teeth in the image.As shown in Fig.3,the fitting results were obtained;in Fig.4,the filtering effect;and in Fig.5-7,Sample 1,2 and 3 were specially selected to present inverted U,inverted V,and inclined patterns,respectively.These patterns were typical of palatal fold regions in the palatal rugae images.
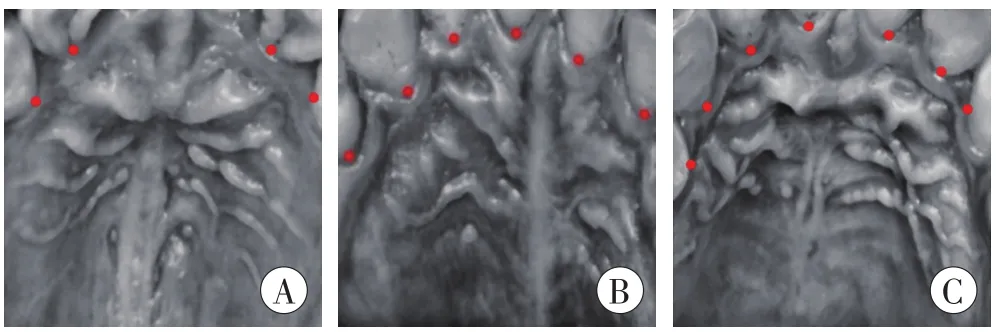
Fig.2 The feature points selected
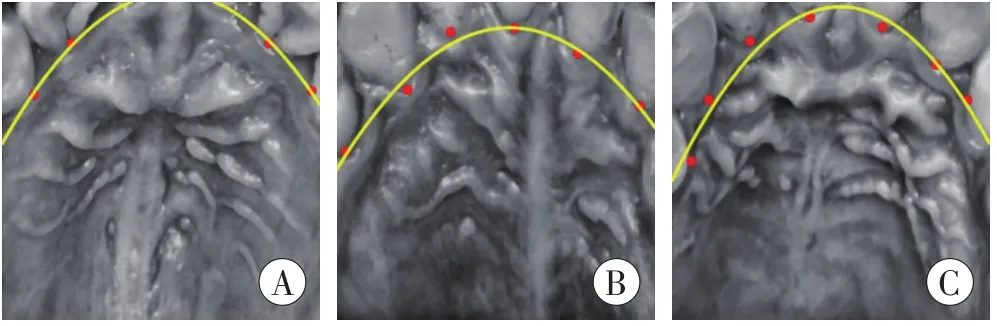
Fig.3 The feature points fitting curve
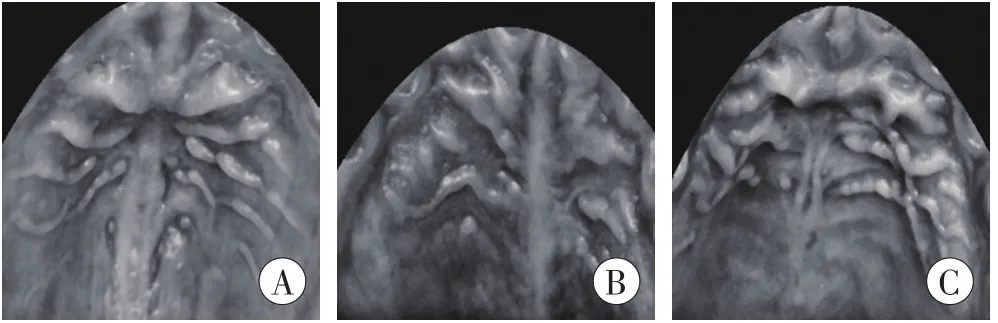
Fig.4 The mask filtering
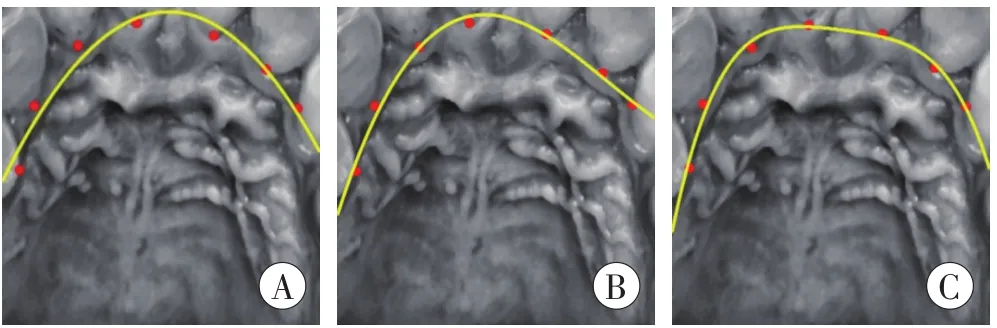
Fig.5 Three fitting effects of Sample 1
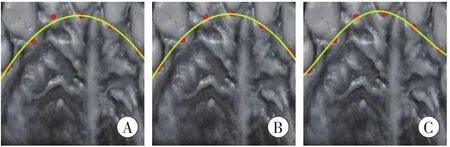
Fig.6 Three fitting effects of Sample 2
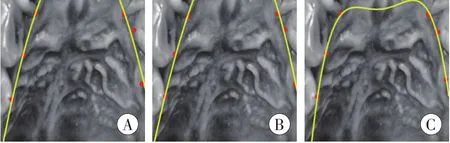
Fig.7 Three fitting effects of Sample 3
(1)The fitting results were obtained when the number of feature pointsnwas different.
(2)The fitting results were obtained when the parametermwas different.
An analysis was made of the quantitative results of the fitting curves in the six palatal rugae images of three samples.As shown in Tab.1,the correlation coefficientsrof three samples and the relationship between the actual mean values(yi′)and the ideal mean values(yi)in the six fitting processes were obtained.For each sample,the difference of correlation coefficientrin the six fitting procedures was significantly small;the range of correlation coefficientrof three samples was between 0.989 6 and 0.999 5,which showed that adopting the cubic polynomial fitting scheme in this study was more reasonable,as indicated by its stable performance.Furthermore,the difference between the actual mean value and the ideal mean value was significantly small in the six-fitting procedure.
As indicated in Fig.8,the schematic diagram of the palatal rugae ROI was obtained in different ways using the red circles to mark the palatal rugae ROIs obtained differently:The palatal rugae morphology map was obtained by the first traditional method[8](Fig.8A);the palatal rugae region of interest(ROI)wasextracted by the second traditional method[10](Fig.8B);and the palatal rugae ROI was extracted using the proposed least squares fitting method(Fig.8C).

Tab.1 Six fitting statistics of three samples
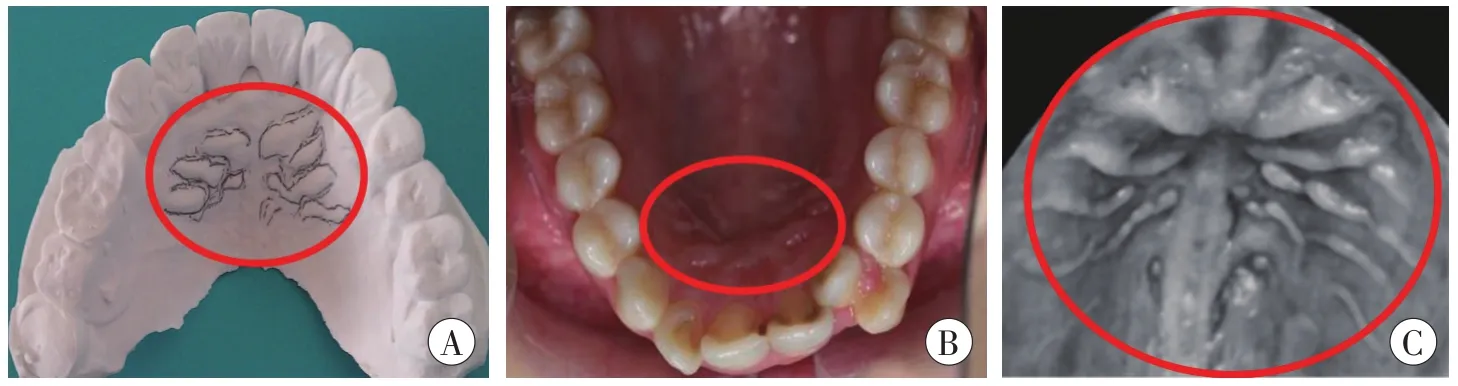
Fig.8 The schematic diagram of the palatal rugae ROIs obtained by three different methods
Discussion
Palatal rugae,also known as plicae palatine transverse,are located at the posterior part of the incisive papilla in the maxillary and the anterior part of the palatal mucosa,consisting of 3-7 irregular,radial,and strip-shaped soft tissue protrusions on both sides of the median palatine suture.Palatal rugae,formed by genetic control of DNA,have two characteristics,individual specificity and stability[12-14].During human development,palatal rugae only change in length and width,and their shape,arrangement and position remain unchanged.Palatal rugae are wrapped by cheeks,lips,tongues,and teeth in the oral cavity.The special structure makes palatal wrinkles highly resistant to fire and strong impact,and even trauma,disease or chemical corrosion should not change their shape and location.Previous studies have shown that palatal rugae can maintain their own characteristics for seven days or longer after the loss of vital signs,which creates a favorable condition for the realization of forensic identification[15-16].
Digital image processing is a technology that converts image signal into digital signal and processes image by computer,such as image denoising,image coding,image enhancement,image restoration and feature extraction.It calculates the representative values of the image through a series of computer algorithms and obtains the desired results.In the process of image acquisition of palatal rugae,it is inevitable to collect the redundant parts of the human lips,teeth,and hard palate together with palatal rugae into the same image.Such a process would introduce a lot of interference to the recognition effect of palatal rugae.Therefore,it is necessary that the ROI of palatal rugae be extracted from the collected image before palatal rugae recognition.In this study,on the basis of the self-developed digital forensic identification system of palatal rugae,the boundary of region of interest in palatal rugae image was located so that the interference was filter out,significantly improving the accuracy of palatal rugae image recognition.
The current approach was made up of three key technologies:feature point selection,boundary fitting and mask filtering.Firstly,according to the dental regions displayed in the palatal rugae images,the geometric center of each tooth edge and the tooth cusp were selected as the boundary feature points for fitting.Next,according to the geometric features of the palatal rugae boundary,the coordinates of artificially selected feature points were automatically read,which were fitted into a parabolic curve using least square method.Finally,the interference information such as teeth was removed by assigning 0 pixels to the outside of the fitting curve of palatal rugae image which was demarcated.As indicated in Fig.5-7,the shape of the fitted curve was developed when different orders of polynomials were used so that that the cubic polynomial produced better fitting effect in terms of the factors of fitting error,computational complexity and generality.Consequently,the existing palatal rugae images were fitted,without the occurrence of error calibration caused by over-fitting.Therefore,the current approach can make it more reasonable to use cubic polynomial curve fitting in the design of palatal rugae pretreatment system.
To illustrate the superiority,the labeling results of palatal rugae ROI were compared between the two traditional approaches and current proposed one,which indicated that the palatal rugae morphology map was too manual and poorly presented in the first traditional method[8](Fig.8A);that the palatal rugae region of interest(ROI) was extracted by in second traditional method[10],with various noises,imaging errors,and human body movements in the process of image acquisition of palatal rugae,and with unclear edges of the acquired oral image,because some effective edges were lost,or the noises were misjudged as edges(Fig.8B);and that the palatal rugae ROI was extracted by the proposed least squares fitting method,with the edges of the palatal rugae ROI effectively calibrated(Fig.8C).
The extraction of the palatal rugae ROI can not only keep the details of the palatal rugae stripes distributed in the human oral cavity as much as possible,but also exclude other interference information effectively.Accurate boundary calibration method can effectively improve the accuracy of palatal rugae image recognition,and further promote the practice of forensic identification.The current proposed approach can better address the issue of palatal rugae boundary calibration,promoting the process of practicing forensic identification.
Acknowledgements
This research was supported by Shanxi Province Science Foundation for Youths(201701D221106),Taiyuan University of Science and Technology Doctoral Promoter (20162044),The International Cooperation Project of Science and Technology Department of Shanxi Province (201803D421),Scientific and Technological Innovation Team of Shanxi Province(201705D131025),Collaborative Innovation Center of Internet+3D Printing in Shanxi Province(201708).
