
Trimethylamine Adsorption Mechanism on Activated Carbon and Removal in Water and Oyster Proteolytic Solution
2021-12-22 11:44CHENDekeWANPengCAIBingnaYEZiqingCHENHuaCHENXinSUNHuiliandPANJianyu
CHEN Deke, WAN Peng, CAI Bingna, YE Ziqing, 5), CHEN Hua, CHEN Xin, SUN Huili, and PAN Jianyu, 2), 3), *
Trimethylamine Adsorption Mechanism on Activated Carbon and Removal in Water and Oyster Proteolytic Solution
CHEN Deke1), WAN Peng1), CAI Bingna1), YE Ziqing1), 5), CHEN Hua1), CHEN Xin4), SUN Huili1), and PAN Jianyu1), 2), 3), *
1) Key Laboratory of Tropical Marine Bio-Resource and Ecology/Guangdong Key Laboratory of Marine Meteria Medica, South China Sea Institute of Oceanology, Chinese Academy of Sciences, Guangzhou 510301, China 2) Southern Marine Science and Engineering Guangdong Laboratory (Guangzhou), Guangzhou 511458, China 3) Innovation Academy of South China Sea Ecology and Environmental Engineering (ISEE), Chinese Academy of Sciences, Guangzhou 510000, China 4) School of Environment and Chemical Engineering, Foshan University, Foshan 528000, China 5) University of Chinese Academy of Sciences, Beijing 100049, China
In this study, seven coal-based activated carbons (ACs) were adopted to remove trimethylamine (TMA) in an aqueous solution as environmentally friendly and harmless adsorbents. The results showed that columnar AC (CAC) had a clear scale and honeycomb structures with few fragments and micropores, contributing to superior TMA removal capacity compared to granular AC (GAC) (71.67% for 6.0mm CAC and 69.92% for 40–60mesh GAC). In addition, the process of adsorption was accompanied by desorption, and the recommended absorbed time was 120–180min. The short time to achieve equilibrium indicated that adsorption was kinetically controlled, and pseudo-second-order kinetics was more appropriate than pseudo-first-order kinetics in explaining the adsorption mechanism in both water and oyster enzymatic hydrolysate. The intraparticle diffusion model presented that the adsorption processes could be divided into three steps for GAC and two steps for CAC. The adsorption processes were consistent with the Freundlich model, indicating the existence of physisorption and chemisorption as multilayer adsorption. The results indicated that AC, especially CAC, has great potential for TMA elimination in aquatic product processing.
trimethylamine; activated carbon; adsorption mechanism; oyster; proteolytic solution
1 Introduction
Trimethylamine (TMA) is a product of decomposition of plants and animals and is freelysoluble both in water and in organic solvents. It is the characteristic volatile off-flavor associated with rotting fish, some infections, and bad breath (Chung and Lee, 2009). For a strong fishy odor and a significantly low-sensory threshold, TMA level has been reported as 2.1×10⁻⁴to 5.8×10⁻⁴ppm (Boraphech and Thiravetyan, 2015a), while a high TMA discharge in the range of 5 to 100ppm has been reported on the industrial scale (Chang., 2004; Fang., 2012). TMA has been extensively discussed as a freshness spoilage index for marine animals (Hebard., 1982; Sotelo and Rehbein, 2000; Zhao., 2000; Ala- salvar., 2005; Olafsdottir., 2005; Dehaut., 2016)and a warning agent for natural gas, cationic starches, and intense sweeteners (Fonger., 2014). The relative concentration of TMA in marine organisms increases continually throughout the storage period (Alasalvar., 2005; Olafsdottir., 2005; Chen., 2016) and enhances the unpleasant smell. Furthermore, the National Institute for Occupational Safety and Health (NIOSH) has declared that TMA is hazardous to humans. Exposure to TMA with a certain concentration, whether in the gaseous or liquid state, can contribute to adverse health effects, such as irritations of the eyes and skin (Boraphech and Thiravetyan, 2015b). Currently, various physical and chemical treatment processes are estimated to minimize TMA, such as adsorption (Hwang., 1994), antioxidation (Chen., 2016), and the use of biomaterials (Ho., 2008; Boraphech and Thiravetyan, 2015a, 2015b) and microorganisms (Chang., 2004), which have been conducted and provide high performance. Among these remediation methods, the adsorption process has been extensively utilized owing to its effectiveness and convenience for subsequent operation (Silva., 2016; Pal., 2017).
AC adsorption was introduced as one of the best available control technologies by the US Environmental Protection Agency (Dabrowski, 2001) because of its excellent adsorption ability (Kobya, 2004; Crini, 2006; Ren., 2013). Studies have revealed that AC can effective- ly reduce TMA content (Ren., 2013; Boraphech and Thiravetyan, 2015a), N-nitrosamine formation potential (FP) (Farre., 2011; Hanigan., 2012), and other malodorous compounds (Oya and Wang, 2002; Iyobe., 2004). Commercially available coal-based AC is characterized by the existence of different sized (micro, meso, and macro) pores and has shown to be a low-cost, accessible and safe sorbent (Venkata., 2002; Lorenc-Grabowska and Gryglewicz, 2007; Yagub., 2014). Unmodified AC, as an inert and harmless sorbent used in the food industry, was chosen for this reason (Hanigan., 2012; Chen., 2016), namely, to lower the risk of introducing the new contaminants or harmful substances.
The adsorption performance and involved mechanisms of AC can be described by thermodynamics, which indicates the adsorption capacity of a sorbent (Wang and Qin, 2005). While kinetics evaluates the basic efficacy of sorbents, the two most common models to predict adsorption kinetics are pseudo-first- and pseudo-second-order models (Nadeem., 2006). Boraphech and Thiravetyan (2015a) reported that TMA adsorbs the monolayer of an adsorbent surface (the Langmuir isotherm), and the kine- ticequation of TMA adsorption follows a pseudo-second-order model. A pseudo-second-order two-step reaction mechanism has also been demonstrated in the process of adsorption (Ho and McKay, 1999).
Most of the researches focus on the adsorption of pollutants in aqueous solution by single shape AC, but did not compare the adsorption capacity and mechanism of different forms of AC under the same conditions. Similarly, the adsorption of trimethylamine by AC in enzymatic hydrolysate of seafood is rare. The objective of this study is to evaluate the capacity of AC as a low-cost adsorbent for TMA removal in water and marine proteolytic solutions. To reveal the sorption process of TMA onto granular and columnar AC (GAC and CAC) under optimum experimental conditions, pseudo-first- and pseudo-second-order and intraparticle diffusion models were proposed. The removal effect of TMA was also verified in an oyster proteolytic solution.
2 Materials and Methods
2.1 Raw Materials
Commercial ACs, including GAC (2–4, 8–12, 20–40 and 40–60mesh) and CAC (1.5, 3.0 and 6.0mm, diameter), were supplied by Shanghai Activated Carbon Co., Ltd., Shanghai, China. The indexes of iodine sorption and pH were in the range of 800–1000mgg−1and 6–8, respectively. Dust was removed by washing with distilled water. The carbon particles were then dried at 105℃ for 24h. All other chemicals were of analytical grade. The surface morphology of the sample was analyzed by scanning electron microscopy (SEM) (S-3400, Hitachi Ltd., Japan).
2.2 Adsorption Kinetics
A stock solution of TMA (1mgmL−1) was prepared using a standard TMA solution. The binding capacity of each AC was determined using a 1±0.02g adsorbent/100 mL solution of TMA in 500mL Erlenmeyer flasks. In an aqueous solution of pH 7 and temperature 40℃, the concentrations of TMA at selected times (0, 10, 20, 40, 80, 120, 180, 240 and 300min) were determined spectrophotometrically(UV-5200 spectrophotometer, Shanghai Metash Instruments Co., Ltd.) at 410nm (Gokoglu., 2009; Chen., 2016).
The adsorption capacity (Boraphech and Thiravetyan, 2015a),Q(mgg−1), was calculated using the following equation:

where0andCare the initial concentration and the concentration at equilibrium (mgL−1), respectively,is the initial and equilibrium volume (L), andis the mass of the adsorbent (g).
2.2.1 Pseudo-first- and pseudo-second-order models
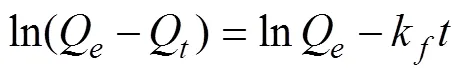
The pseudo-first-order equation can be written as (Boraphech and Thiravetyan, 2015a):
The pseudo-second-order model can be presented in the following form after integrating and applying the boundary conditions,Q= 0 when= 0 andQ=Qat=.

whereQ(mgg−1) is the amount of the adsorbate absorbed at time(min),Q(mgg−1) is the adsorption capacity in equilibrium, andk(min−1) andkare the rate constants for the pseudo-first- and pseudo-second-order models.
2.2.2 Intraparticle diffusion model
TMA is transported from the aqueous phase to the surface of AC and can subsequently diffuse into the interior of particles, and the diffusion is governed by the next equation (Yagub., 2014).

wherekis the intraparticle diffusion rate constant (mgg−1min−0.5),Qis consistent with the above description andis a constant.
2.3 Adsorption Isotherm Models
A standard TMA solution was prepared and suitably diluted to the required initial concentrations (0.2, 0.4, 0.6, 0.8 and 1mgmL−1). The content of TMA and the adsorption capacity of AC were detected in the same way described above.
The equilibrium adsorption of TMA onto various ACs was analyzed using Langmuir and Freundlich isotherms.
The Langmuir adsorption model is the simplest theoretical model for monolayer adsorption onto a surface with a finite number of identical sites (Abdullah., 2009).
The general linearized Langmuir equation is as follows:

The Freundlich expression, applicable to nonideal heterogeneous surface and multilayer sorption, is an empirical equation that can be written in the following form (Yagub., 2014)

whereQ(mgg−1) is the monolayer capacity of the adsorbent,Q(mgg−1) andC(mgL−1) are the TMA concentrations on the adsorbent (mgg−1) and in the solution, respectively, andK(min−1) andKare the Langmuir and Freundlich constants, respectively.
2.4 Statistical Analysis
Results were expressed as mean±standard deviation and analyzed using SPSS 24.0 software (BM Inc., New York, USA). A one-way analysis of variance (ANOVA) was performed and followed by post-hoc least significant difference (LSD) test to estimate statistical differences, which were regarded as significantly if<0.05.
3 Results and Discussion
3.1 SEM of ACs
Fig.1 shows the SEM images of various ACs magnified 1000 times. A scraggy surface with random, varying pore sizes can be observed in 2–4 mesh and 40–60 mesh GAC (Figs.1a and b, respectively). A reticular structure presented in a flank, hilly shape in the internal surface and cracks are demonstrated. These features may slow the rate of absorption and contribute to the physical and mechanical properties of GAC. However, the surface of CAC is smooth with few fragments and micropores (Figs. 1c and d, respectively). In addition, the clear scales and honeycomb structures of the internal pores are shown in a certain order.

Fig.1 SEM images of GAC (a and b) and CAC (c and d) (×1000).
3.2 Kinetics of Adsorption in TMA Aqueous Solutions
3.2.1 The adsorption of TMA on various ACs
The adsorption capacity (Q) in different time was shown in Table 1.It is determined mainly by the pore size and structure of AC (Matsui., 2011), and the result showed that the adsorbing capacity of TMA by GAC and CAC is within 75% to 83%, respectively.
According to Table 1 and Fig.2, the removal of TMA by adsorption on various ACs is rapid at the initial period of contact time (0 to 40min for GAC and 0 to 10min for CAC) and then becomes slow and stagnates with increasing time. In some cases, TMA removal decreases after 120min, which may be due to a desorption process. According to the theory of adsorption (Lazaridis and Asouhidou, 2003), van der Waals forces maintain the first stage of adsorption, and TMA is adsorbed very rapidly; this process is controlled by external mass transfer. Second, TMA diffuses into AC pores by combining van der Waals forces and chemical bond forces. Then, the intraparticle diffusion of TMA into the interior pores of the AC particle is driven by chemical bond forces.

Table 1 The adsorption on various ACs

Fig.2 Time curve for the adsorption of TMA onto various ACs.
3.2.2 Adsorption kinetics
To determine which model could properly describe the sorption kinetics, three kinetic equations are used to evaluate the experimental results.
The plots of ln(Q−Q).(pseudo-first-order) and/Q.(pseudo-second-order) are represented in Fig.3. The estimated model parameters and the related statistical parameters are reported in Table 2.
As implied by Fig.3 and Table 2, the experimental results were performed using a linear regression, and the correlation coefficients for the second-order kinetic model are greater than 0.99 (as evidenced by2), indicating the applicability of this kinetic equation and the second-order nature of the adsorption process of TMA on ACs. Meanwhile, the value ofQcalculated from the Eq. (3) is close to that computed from the Eq. (1) in Table 1. In contrast, the maximum2in the pseudo- first-order model is 0.6606, which indicates a weak correlation. As shown in Table 2, thekvalue increased sequentially from GAC to CAC, which can be attributed to the greater surface area and the availability of more adsorption sites (Geethakarthi and Phanikumar, 2011). Specifically, along with the increase in specificsurfacearea, krose from 0.2411 to 0.5109 for GAC and from 0.7253 to 0.8462 for CAC. It is clear that CAC has a higher reaction rate than GAC, which is understandable from a molecular interaction perspective.

Table 2 Parameters and regression coefficients (R2) of kinetic models

Fig.3 First-order (a) and second-order (b) kinetic plots for the removal of TMA by adsorption on various ACs.
The intraparticle diffusion model (Weber and Morris 1963) was employed to evaluate the diffusion mechanism of TMA onto ACs. This is an empirical model, and the amount of adsorption varies nearly proportionally with0.5rather than with contact time (Yagub., 2014).
It can be inferred from Fig.4 (a) that the regression coefficients (2) are in the range of 0.4–0.7, and the plot for TMA does not cross the coordinate axis, indicating that intraparticle diffusion was not the only rate-controlling step (Acharya., 2009). Fig.4(b) clearly shows that adsorption could be divided into three (GAC) and two (CAC) linear parts, meaning that several steps controlled adsorption. Initially, the boundary layer adsorption in the range of 0–6min0.5and more than 2/3 of the adsorption occurred in this step, with the concentration difference as the main driving force. Then, the second portion describes the gradual adsorption stage, where TMA takes place in the internal pores of the adsorbent and the intraparticle diffusion rate is rate-limiting. Finally, an adsorption equilibrium reveals that the adsorption sites on the GAC surface were occupied and that the TMA concen- tration was lower (Toor and Jin, 2012; Liu., 2018). Compared with that of GAC adsorption, the first step of CAC adsorption was achieved in a shorter time (3min0.5) and almost reached an equilibrium state; in particular, could attributed to the smooth, regular surface and larger mesopores (Lorenc-Grabowska and Gryglewicz, 2007).

Fig.4 (a) and (b) Intraparticle diffusion kinetics for TMA adsorption onto ACs at initial concentrations of 1000μgmL−1.
3.3 Adsorption Isotherms in Aqueous TMA Solutions
3.3.1 The adsorption of TMA on ACs
The effect of the initial concentration of TMA (in terms of percentage adsorption) on various ACs was studied, and the relevant data are given in Table 3.
Although the amount of adsorption on GAC increased with increasing initial concentration in the range of 200 to 600μgmL−1, the percentage of TMA removal was found to decrease gradually. This indicated that the surface lacked the available active sites required for the high initial concentration of TMA. However, the higher the concentration was (ranging from 600 to 1000μgmL−1), the greater the contribution of sorption due to the force of high concentration. The adsorption capacity of CAC increased with increasing concentration, while the adsorption rate, which was at a high level similar to that of GAC, did not change significantly. Thus, among the ACs, CAC is a superior low-cost TMA adsorbent material compared to GAC, in water solution.

Table 3 Effect of initial concentration of TMA on the extent of removal by adsorption on coal-based ACs at 40℃
Notes: % Values given in the parentheses are % adsorption of TMA; the contact time was 300min.
3.3.2 Langmuir and Freundlich isotherms
The Langmuir and Freundlich isotherm plots are shown in Fig.5, and the values of the constants in the models and the correlation coefficients obtained are summarized in Table 4. The equilibrium data sufficiently predicted the adsorption capacity and were well represented by the Freundlich isotherm equation when compared to the Langmuir equation. The graph ofC/QagainstCis a straight line with lower correlation coefficients (0.2811–0.7106) than those of the Freundlich isotherm (0.8785– 0.9967). Furthermore, the value of 1/n, which is the indicator of adsorption intensity, was in the range of 0.9893– 1.2426, revealing the favorable and heterogeneous sorption of TMA onto the ACs (Song., 2017).

Fig.5 Langmuir (a) and Freundlich (b) isotherms of the adsorption of TMA by coal-based ACs.

Table 4 The Langmuir and Freundlich parameters of adsorption isotherms
3.4 Kinetics of Adsorption in Oyster Enzymatic Hydrolysate
Oyster enzymatic hydrolysate was processed using alkaline protease at pH 6.3 and 55℃ for 4h. Then, the hydrolysate solution (100mL per sample, 37.5mgmL−1) was stirred with the ACs in a water bath at 40℃ for 300min. The TMA adsorption efficiency in the original and treated hydrolysates is summarized in Table 5, which shows an increase with a high rate in the first 120min and equilibrium at 180min, leading to a TMA removal rate of approximately 70% using various ACs. However, TMA adsorption was reduced in the subsequent stage (180 to 300min). The TMA amount of original hydrolysate so- lution increases to 56.36±0.15μgmL−1at 120min and keeps constant. This may indicate that the adsorption reducing may attribute to the desorption process and not the TMA amount in solution has exceeded the adsorption capacity of ACs. For the TMA content in hydrolysate solution was much lower than that in adsorption isotherm models experiment (Chapter 2.3, Table 3).

Table 5 TMA adsorption efficiency by coal-based AC in oyster enzymatic hydrolysate
Notes: The initial concentration of TMA was 19.45±0.03μgmL−1. Data are listed as the average ±SD for three replications.*presented<0.05 compared with the control group.

Fig.6 First-order (a) and second-order (b) kinetic plots for the removal of TMA by adsorption on various ACs.
It can be verified from Table 5 that both 6.0mm CAC and 20mesh GAC are effective in removing 71.67% and 71.31% of all the TMA at 180min, which is superior to other materials, respectively. Though AC exhibits superior adsorption capacity in TMA solution, as decrypted in Chapter 3.3.1, AC has a higher affinity toward nonpolar substances than polar substances (Lee., 2010) in the enzymatic hydrolysate, which could influence the adsorption efficiency.
Details of the kinetics models for the oyster enzymatic hydrolysate are given in Table 6 and Figs.6a–b. Based on the higher2values in Table 6, it can be evaluated that the TMA removal behavior obeyed the pseudo-second- order model rather than the pseudo-first-order model, which indicates that chemisorption is the rate-limiting step (Wang and Wang, 2008; Liu., 2018). The kinetic model of TMA removal in oyster enzymatic hydrolysate was consistent with that of TMA removal in water solution, indicating that the enzymatic hydrolysate substrate played a limited role in identifying the TMA adsorption kinetic model.

Table 6 Parameters and regression coefficients (R2) of kinetic models in oyster hydrolysate
4 Conclusions
The TMA adsorption result indicates that CAC was less resistant to adsorption than GAC owing to a smooth and regular surface. For this reason, CAC has better adsorption efficiency than GAC. In addition, the pseudo-second-order model could well describe the kinetic patterns (2>0.99) demonstrates that chemisorption played a vital role in the sorption process. Meanwhile, three controlling steps on GAC and two on CAC were gained in the intraparticle diffusion model. In isotherm tests, the Freundlich isotherm was satisfied for this adsorption system, supporting that TMA adsorption by the ACs was a multilayer coverage on a heterogeneous surface. Although the TMA removal process in the oyster enzymatic hydrolysate was more complicated than that in the water solution, it still followed pseudo-second-order kinetics. Approximately 70% TMA was absorbed by the ACs, and the recommended time for adsorption was 120–180min. It can be seen from the results, various ACs, especially CAC, could be employed as low-cost adsorbents for the removal of pollutants from water and wastewater in general and for the removal of TMA, in particular. Next, we will continue to explore the thermodynamics of adsorption of TMA on ACs in oyster hydrolysate, in order to provide theoretical support for the application of AC in the adsorption of TMA in the hydrolysate of aquatic products.
Acknowledgements
The experimental apparatus was provided by the Equip- ment Public Service Center, South China Sea Institute of Oceanology, Chinese Academy of Sciences.Thanks to Dr. Yongli Gao in the operation of equipment.
This study was supported by grants from the National Key R&D Program of China (No. 2018YFC0311202), the Key-Area Research and Development Program of Guang- dong Province (No. 2020B1111030004), the Science and Technology Program of Guangzhou, China (Nos. 201804010364and 201804010321), the Key Special Project for Introduced Talents Team of Southern Marine Science and Engineering Guangdong Laboratory (Guangzhou) (No. GML2019ZD0406), the National Key R&D Program of China (No.2018YFC0311202), the Natural Science Foun- dation of Guangdong Province, China (Nos. 2018A030313088, 2018A030313626) and the Academician Workstation Foundation for Young Scientists of Chinese Aca- demy of Sciences Guangzhou Branch (No. 20180313).
Abdullah, M. A., Chiang, L., and Nadeem, M., 2009. Compara- tive evaluation of adsorption kinetics and isotherms of a natural product removal by Amberlite polymeric adsorbents., 146(3): 370-376.
Acharya, J., Sahu, J., Mohanty, C., and Meikap, B., 2009. Removal of lead (II) from wastewater by activated carbon developed from Tamarind wood by zinc chloride activation., 149(1-3): 249-262.
Alasalvar, C., Taylor, K. D., and Shahidi, F., 2005. Comparison of volatiles of cultured and wild sea bream () during storage in ice by dynamic headspace analysis/gas chromatography-mass spectrometry., 53(7): 2616-2622.
Boraphech, P., and Thiravetyan, P., 2015a. Trimethylamine (fishy odor) adsorption by biomaterials: Effect of fatty acids, alkanes, and aromatic compounds in waxes., 284: 269-277.
Boraphech, P., and Thiravetyan, P., 2015b. Removal of trime- thylamine (fishy odor) by C3 and CAM plants., 22(15): 11543-11557.
Chang, C. T., Chen, B. Y., Shiu, I. S., and Jeng, F. T., 2004. Biofiltration of trimethylamine-containing waste gas by entra- pped mixed microbial cells., 55(5): 751-756.
Chen, D., Chen, X., Chen, H., Cai, B., Wan, P., Zhu, X.,., 2016. Identification of odor volatile compounds and deodori- zation of Paphia undulata enzymatic hydrolysate., 15(6): 1101-1110.
Chung, K. H., and Lee, K. Y., 2009. Removal of trimethylamine by adsorption over zeolite catalysts and deodorization of fish oil., 172(2-3): 922-927.
Crini, G., 2006. Non-conventional low-cost adsorbents for dye removal: A review., 97(9): 1061-1085.
Dabrowski, A., 2001. Adsorption–From theory to practice., 93(1-3): 135-224.
Dehaut, A., Duthen, S., Grard, T., Krzewinski, F., N’Guessan, A., Brisabois, A.,., 2016. Development of an SPME-GC-MS method for the specific quantification of dimethylamine and trimethylamine: Use of a new ratio for the freshness moni- toring of cod fillets., 96(11): 378-3794.
Fang, J. J., Yang, N., Cen, D. Y., Shao, L. M., and He, P. J., 2012. Odor compounds from different sources of landfill: Charac- terization and source identification., 32(7): 1401-1410.
Farre, M. J., Reungoat, J., Argaud, F. X., Rattier, M., Keller, J., and Gernjak, W., 2011. Fate of N-nitrosodimethylamine, tri- halomethane and haloacetic acid precursors in tertiary treat- ment including biofiltration., 45(17): 5695-5704.
Fonger, G. C., Hakkinen, P., Jordan, S., and Publicker, S., 2014. The national library of medicine’s (NLM) hazardous subs- tances data bank (HSDB): Background, recent enhance- ments and future plans., 325: 209-216.
Geethakarthi, A., and Phanikumar, B. R., 2011. Adsorption of reactive dyes from aqueous solutions by tannery sludge developed activated carbon: Kinetic and equilibrium studies., 8(3): 561-570.
Gokoglu, N., Topuz, O. K., and Yerlikaya, P., 2009. Effects of pomegranate sauce on quality of marinated anchovy during refrigerated storage.–, 42(1): 113-118.
Hanigan, D., Zhang, J., Herckes, P., Krasner, S. W., Chen, C., and Westerhoff, P., 2012. Adsorption of N-Nitrosodimethyla- mine precursors by powdered and granular activated carbon., 46(22): 12630-12639.
Hebard, C. E., Flick, G. J., and Martin, R. E., 1982. Occurrence and significance of trimethylamine oxide and its derivatives in fish and shellfish. In:. Martin, R. E.,., eds., AVI, Westport, 149- 304.
Ho, K. L., Chung, Y. C., Lin, Y. H., and Tseng, C. P., 2008. Biofiltration of trimethylamine, dimethylamine, and methyla- mine by immobilizedsp. CP2 andsp. CP1., 72(2): 250-256.
Ho, Y. S., and McKay, G., 1999. The sorption of lead(II) ions on peat., 33(2): 578-584.
Hwang, Y., Matsuo, T., Hanaki, K., and Suzuki, N., 1994. Re- moval of odorous compounds in wastewater by using acti- vated carbon, ozonation and aerated biofilter., 28(11): 2309-2319.
Iyobe, T., Asada, T., Kawata, K., and Oikawa, K., 2004. Compa- rison of removal efficiencies for ammonia and amine gases between woody charcoal and activated carbon., 50(2): 148-153.
Kobya, M., 2004. Removal of Cr(VI) from aqueous solutions by adsorption onto hazelnut shell activated carbon: Kinetic and equilibrium studies.,91(3): 317-321.
Lazaridis, N. K., and Asouhidou, D. D., 2003. Kinetics of sorptive removal of chromium(VI) from aqueous solutions by calcined Mg-Al-CO3hydrotalcite., 37(12): 2875-2882.
Lee, S. W., Wan, M. A. W. D., and Lee, M. G., 2010. Adsorption characteristics of methyl mercaptan, dimethyl disulfide, and trimethylamine on coconut-based activated carbons modified with acid and base., 16(6): 973-977.
Liu, L., Hu, S., Shen, G., Farooq, U., Zhang, W., Lin, S.,., 2018. Adsorption dynamics and mechanism of aqueous sul- fachloro-pyridazine and analogues using the root powder of recyclable long-root Eichhornia crassipes., 196: 409-417.
Lorenc-Grabowska, E., and Gryglewicz, G., 2007. Adsorption characteristics of Congo Red on coal-based mesoporous acti- vated carbon., 74(1): 34-40.
Matsui, Y., Ando, N., Yoshida, T., Kurotobi, R., Matsushita, T., and Ohno, K., 2011. Modeling high adsorption capacity and kinetics of organic macromolecules on super-powdered acti- vated carbon., 45(4): 1720-1728.
Nadeem, M., Mahmood, A., Shahid, S. A., Shah, S. S., Khalid, A. M., and Mckay, G., 2006. Sorption of lead from aqueous solution by chemically modified carbon adsorbents., 138(3): 604-613.
Olafsdottir, G., Jonsdottir, R., Lauzon, H. L., Luten, J., and Kristbergsson, K., 2005. Characterization of volatile com- pounds in chilled cod () fillets by gas chroma- tography and detection of quality indicators by an electronic nose., 53(26): 10140-10147.
Oya, A., and Wang, G. I., 2002. Deodorization performance of charcoal particles loaded with orthophosphoric acid against ammonia and trimethylamine., 40(9): 1391-1399.
Pal, A., Majumder, K., Sengupta, S., Das, T., and Bandyopad- hyay, A., 2017. Adsorption of soluble Pb(II) by a photocross- linked polysaccharide hybrid: A swelling-adsorption correla- tion study., 177: 144-155.
Ren, A., Han, P., Guo, B., Han, J., and Li, B., 2013. The study of hydrogen peroxide modified activated carbon on the adsorp- tion of trimethylamine exhaust., 13: 237-242.
Silva, T. L., Ronix, A., Pezoti, O., Souza, L. S., Leandro, P. K. T., Bedin, K. C.,., 2016. Mesoporous activated carbon from industrial laundry sewage sludge: Adsorption studies of reactive dye Remazol Brilliant Blue R., 303: 467-476.
Song, Q., Fang, Y., Liu, Z., Li, L., Wang, Y., Liang, J.,., 2017. The performance of porous hexagonal BN in high adsorption capacity towards antibiotics pollutants from aque- ous solution., 325: 71-79.
Sotelo, C. G., and Rehbein, H., 2000. TMAO-degrading enzy- mes. In:. Marcel Dekker, New York, 167-190.
Toor, M., and Jin, B., 2012. Adsorption characteristics, isotherm, kinetics, and diffusion of modified natural bentonite for removing diazo dye., 187: 79-88.
Venkata, M. S., Chandrasekhar, R. N., and Karthikeyan, J., 2002. Adsorptive removal of direct azo dye from aqueous phase onto coal based sorbents: A kinetic and mechanistic study., 90(2): 189-204.
Wang, L., and Wang, A., 2008. Adsorption properties of Congo Red from aqueous solution onto surfactant-modified montmo- rillonite., 160(1): 173-180.
Wang, X. S., and Qin, Y., 2005. Equilibrium sorption isotherms for of Cu2+on rice bran., 40(2): 677-680.
Weber, W. J., and Morris, J. C., 1963. Kinetics of adsorption on carbon from solution., 1(2): 1-2.
Yagub, M. T., Sen, T. K., Afroze, S., and Ang, H. M., 2014. Dye and its removal from aqueous solution by adsorption: A re- view., 209(7): 172-184.
Zhao, S., Wei, P., and Chen, S., 2000. Enhancement of trime- thylamine sensitivity of MOCVD-SnO2thin film gas sensor by thorium., 62(2): 117-120.
October 22, 2020;
April 8, 2021;
June 1, 2021
© Ocean University of China, Science Press and Springer-Verlag GmbH Germany 2021
. Tel: 0086-20-89023145
E-mail: jypan@scsio.ac.cn
(Edited by Ji Dechun)
 Journal of Ocean University of China2021年6期
- Journal of Ocean University of China的其它文章
- Meshless Method with Domain Decomposition for Submerged Porous Breakwaters in Waves
- Facial Features of an Air Gun Array Wavelet in the Time-Frequency Domain Based on Marine Vertical Cables
- Magma Evolution Processes in the Southern Okinawa Trough:Insights from Melt Inclusions
- Summery Intra-Tidal Variations of Suspended Sediment Transportation–Topographical Response and Dynamical Mechanism in the Aoshan Bay and Surrounding Area, Shandong Peninsula
- High-Resolution Geochemical Records in the Inner Shelf Mud Wedge of the East China Sea and Their Indication to the Holocene Monsoon Climatic Changes and Events
- Geological Guided Tomography Inversion Based on Fault Constraint and Its Application