
Density fluctuations of two-dimensional active-passive mixtures
2022-08-02 03:01JianZhangTaoHuangGuoqingXuandYongChen
Jian Zhang, Tao Huang, Guoqing Xu and Yong Chen,*
1 Center of Soft Matter Physics and Its Applications, Beihang University, Beijing 100191, China
2 School of Physics, Beihang University, Beijing 100191, China
3 Faculty of Science, Kunming University of Science and Technology, Kunming 650093, China
Abstract Dimension-dependent giant density fluctuations are a typical feature of active matter systems.In this work, we study the density fluctuation in two-dimensional mixtures of active and passive particles by Brownian dynamics simulations.The boundary of motility-induced phase separation is determined by the transition from unimodal to bimodal density distribution.A rapid increase of the fluctuation exponent near the boundary of phase separation in the plane of density and Péclet number was observed.When phase separation occurs, the fluctuation exponent is an approximate constant of0.85.
Keywords: active particle, fluctuation, phase separation
1.Introduction
Active matter has been a trending research field of soft matter in recent years.Active matter refers to a kind of nonequilibrium system that generates motion or deformation through energy input at the microscopic individual level.These active individuals obtain energy from their surrounding environment and transform energy into their directed motion[1].The scale of active matter is very broad.In biological systems, for example, active individuals may be bacteria,cells,fish,birds,sheep,and insects in nature[2–4].The active systems could exhibit swarming, anomalous density fluctuation, nonequilibrium disorder-order transition, special rheological behavior,surprising mechanical properties,etc[5–11].Motivated by these motile living organisms,researchers have developed artificial micro- and nanoswimmer particles that feature similar swimming behaviors based on different mechanisms, including Janus particles, chiral particles, vesicles, granular particles, etc [10, 12–19].
It is well-known that the number fluctuation in an equilibrium system follows the exponentα= 0.5,Δn~〈nα〉,wherenand〈n〉 are the immediate and average number of particles in a region, respectively.Δn2= 〈 (n- 〈n〉)2〉is the variance of fluctuation.For active systems,linear theory givesα= 0.5 + 1 /d(dis the dimensionality)and indicates the socalled giant number fluctuation (GNF).It is conjectured that the scaling exponent of two-dimensional (d= 2) particles is closer to 1 [20–22].This prediction has been studied by experiments and simulations [23–25].Zhang et al noted that the standard deviationΔngrows more rapidly thannand scales as0.75± 0.03 in bacteria experiments [26].It was found that the scaling exponent is 0.8 in the simulations in a model of self-propelled polar rod-shaped particles [27].Render et al provided a kinetic theory for describing the steady state coexistence of dilute and dense phases[28].This leads to large magnitude density fluctuations [21, 29–31].
However, some individuals may temporarily lose energy or become dormant in active systems and probably hinder the motion of other matters.As a result,the collective behavior of the systems has also changed accordingly.This phenomenon is widely present in a variety of organisms.Therefore, more and more attention has been paid to the study of binary mixtures of active and passive particles [31–34].To the best of our knowledge, although researchers have studied various properties of mixtures, such as particle diffusion, cluster motion,phase behavior,and so on,[35–37],studies of density fluctuations are still scarce.
The purpose of this work is to explore the fluctuation properties of two-dimensional binary mixtures of active and passive Brownian particles.The rest of our paper is organized as follows.In the second section, we introduce the particle motion model, molecular dynamics simulation method, and parameter profiles of simulations.In section 3, we illustrate the distributions of local densities and determine the phase separation boundary.By computing the mean square displacement of the particle count, we present the fluctuation exponent in the plane of the Péclet number and the fraction of active particles.Finally,we summarize our main findings and discuss their possible implications for future studies.
2.Model and methods
We study density fluctuations of two-dimensional binary mixtures of active particles and passive particles.These particles interact via a short-ranged purely repulsive interaction,the Weeks–Chandler–Anderson potential [38, 39],
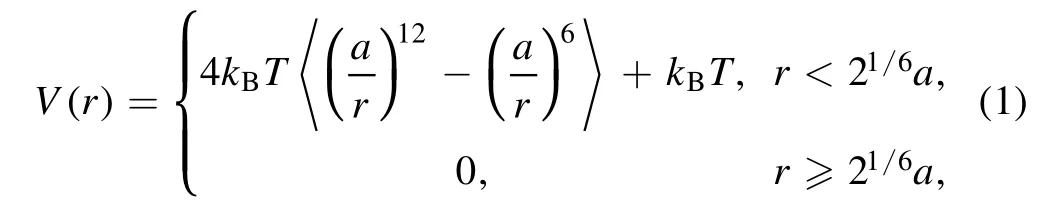
wherer is the distance between two particles,a represents the diameter of particles,kBis the Boltzmann constant, T is the temperature and21/6a is the cutoff distance.We use reduced units in this paper.a =1 is the unit of length,ε = kBT is the unit of temperature,and τ =is the unit of time.We performed molecular dynamics simulations using in house written code and the HOOMD-blue simulation package [40].
The motions of all particles are described by the following overdamped Langevin equations,
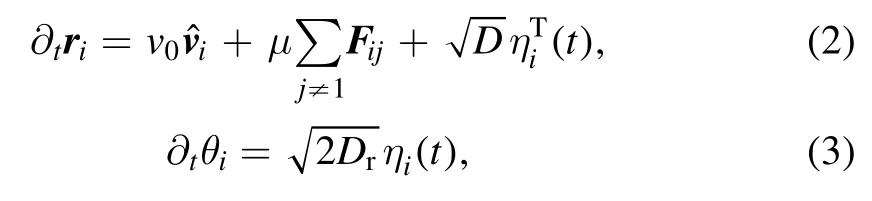
Our systems consist of 250 000 active and passive particles with the same diameter.Previous studies have demonstrated that active Brownian particles (ABPs) induce phase separation[41].The proportion of active particles is a variable in terms of fa= Na/N and ranges from0.2 to 1.Nadenotes the number of active particles and N is the total number of particles in the systems.Clearly, all particles are active when fa=1.The area fractions occupied by all particles are φ = 0.7 and0.8 in our work.We use a nondimensionalized Péclet number Pe = v0a /D to represent the activity of particles.Here,Pe ranges from10 to140.We set D= 1,so Pe is equal to the self-propelled velocity.In our simulations, we regulate the Péclet number, the area fraction of particles, and the fraction of active particle numbers to study the density fluctuations of systems.All simulations are performed in a square box with periodic boundary conditions and executed with a time step of10-τ5.
3.Results
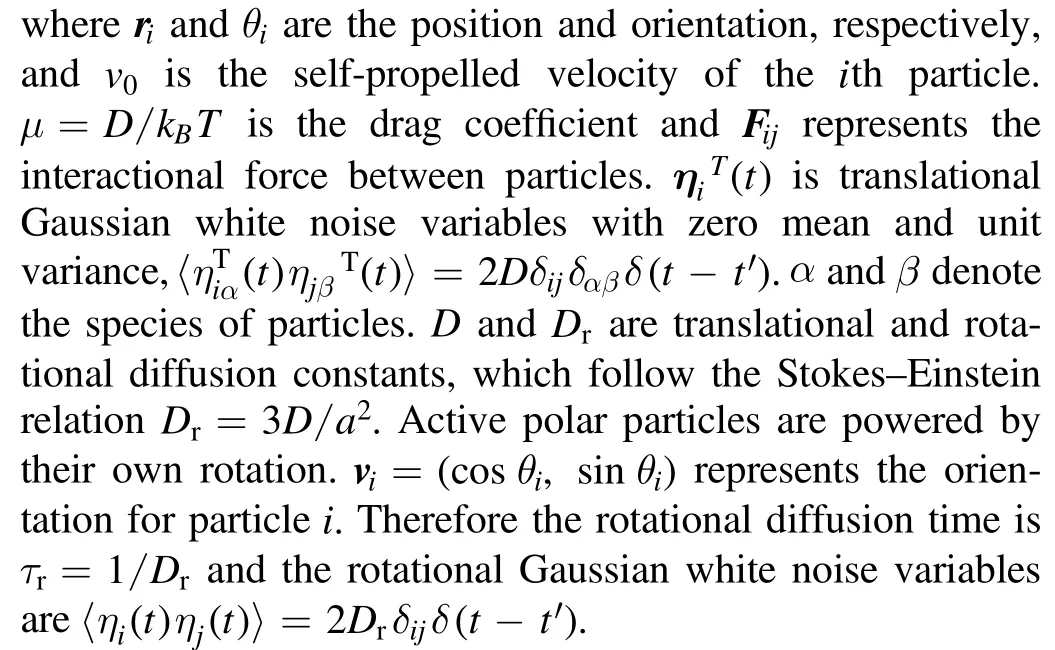
To directly observe the structures of the ABP systems,figure 1 shows snapshots for the different Péclet numbers at the same time in a purely active system ( fa=1) and the mixture containing70% active particles ( fa=0.7) with the same fractionφ = 0.7.In the case of lower activities Pe =10, whether in purely active systems or mixtures, the studied systems are homogeneous and disordered in a liquidlike manner (see figures 1(a) and (d)).With increasing activities of ABPs ( Pe= 60 in figures 1(b) and (e)), the particles form many small clusters that aggregate and disperse continually as time goes by.The larger the fractions of the active particles are, the larger the cluster size is.For the further larger Pe,the clusters gather much more particles from their surrounding dilute regions and tend to close packing.The systems exhibit nucleation and the clusters grow.The particles that are not in the clusters are loosely distributed.As a result,the systems separate into dilute and dense phases.In other words, the systems exhibit the motility-induced phase separation(MIPS)as shown in figure 1(c).It should be noted that the passive particles suppress the activities of systems and prevent the occurrence of MIPS (see figure 1(f)).In a word, with increases in Péclet number and the fraction of active particles, the overall motility of the whole system has strengthened, and MIPS easily occurs.
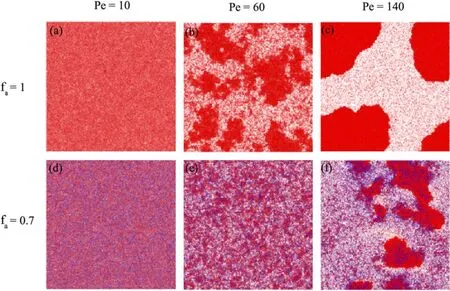
Figure 1.Snapshots of the active particle systems (upper planes,fa =1) and the mixtures of active and passive particles (bottom planes,fa =0.7)with different Péclet numbers at steady states, t =600 τ.Here, the red and blue points represent the active and passive particles,respectively.White regions indicate no particles.Parameterφ = 0.7 in both scenarios.
We implemented the Voronoi cell method to measure the local density to explore the boundary of the MIPS.Each particle is in a Voronoi cell and every corresponding tesselation area iss [31, 42].By computing a Voronoi tesselation over the simulation box, one can obtain the local density π =πa/2s.Figure 2 illustrates the distributions of local densities with various Pe and fa.Note that the appearance of a bimodal distribution of local density indicates the occurrence of the MIPS.Clearly, the dependencies of density distributions on Pe and faare consistent with the observation in figure 1.The increases in overall motility enhance the aggregation of particles.By increasing Pe/fain figures 2(a)/(b),the unimodal density distributions gradually split into two peaks.The higher density peak corresponds to the dense phase and the lower peak corresponds to the dilute phase.As a result, the systems exhibit phase separation.Furthermore,the boundary of MIPS in the plane of Pe and fais marked with the red dashed line in figure 4(a) [41, 46].
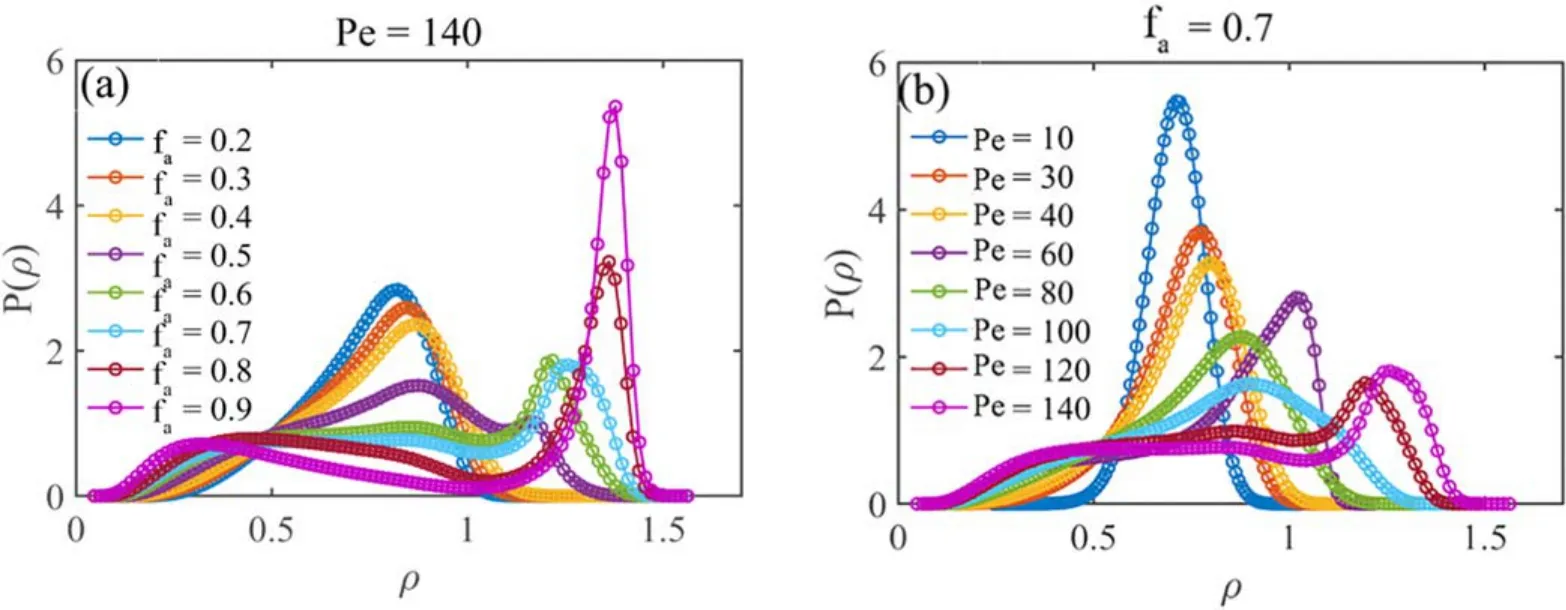
Figure 2.Local density distributions of the systems withφ = 0.7:(a)Pe =140 with various fractions fa and(b) fa =0.7with various Pe.The occurrence of the bimodal distribution means that phase separation occurs.
In the abovementioned snapshots illustrated in figure 1,clusters are in motion constantly,and there exist empty spaces in the regions they just pass.On the other hand, the interaction of the passive particles is repulsive so that the particles are not gathering and clustering.These two aspects give rise to low density in these regions.However, the clusters have a higher number density.To describe the density fluctuation of the particles at any time, one could measure the fluctuations of the particle numbers by computing the mean square displacement (MSD),σ2= 〈n(l)2〉 - 〈n(l)2〉 .n(l)and〈n(l)〉represent the current and averaged number of particles in a square-box subsystem with side lengthl.
Figure 3 shows log–log plots of the MSDs separately for a constant Péclet numberPe= 140 and a constant fraction of active particlesfa=0.7withφ= 0.7 for all particles in figure 2.The systems have varying degrees of density fluctuations regardless of the parameter profiles of the systems.The systems show a clear linear dependence ofσon〈n〉 in all cases in the log–log plot.This means that these dependence relationships conform with the formula,σ∝〈n(l)〉γ.The exponentγis the slope of log–log plots ofσversus〈n〉 in figure 3.However,γis neither constant nor a simple linear increase.For example,γjumps up betweenfa=0.4and0.5 as shown in figure 3(a).A similar leaping increase ofγoccurs for increasing Pe in the case of a fixedfa(figure 3(b)).
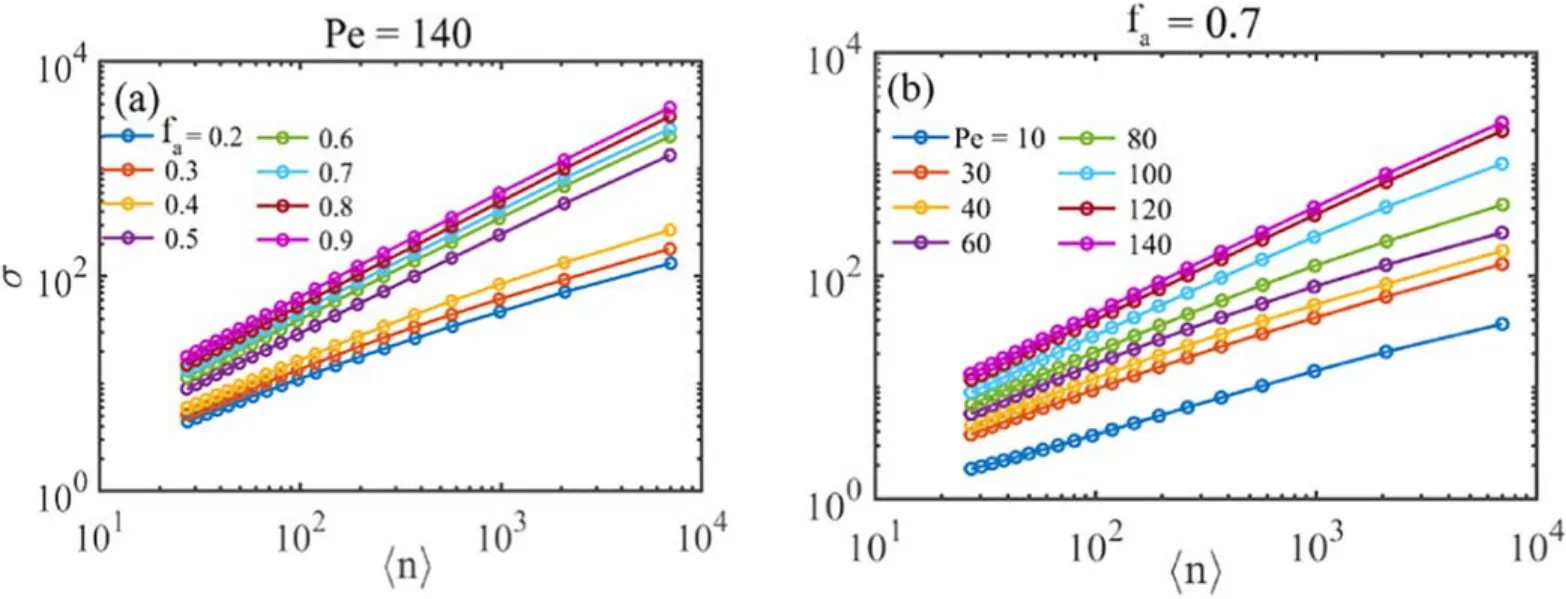
Figure 3.Log–log plots of the mean square displacementσ versus the number of particles〈 n〉 in a subsystem for (a)Pe =140 and (b)fa =0.7.The area fractionφ = 0.7.
Figure 4(a) summarizes the fluctuation exponents of active-passive mixtures in the plane of the Péclet number Pe and the fraction of active particlesfa.The increases of Pe orfaenhance the overall motilities of the mixtures.Correspondingly, this strengthens the density fluctuation and increases the values of exponentγ.For lower Pe andfa(see the bottom-left area in figure 4(a)),γtends to 0.5 which means normal fluctuation.Actually,it is known thatγis equal to 0.5 in a two-dimensional passive equilibrium system[29, 43].Conversely, for the upper-right area in figure 4(a),larger Pe andfawould induce the anomalous number fluctuation(γ>0.5)and drive the systems into a fluctuation withγ= 1.It is consistent withγ= 1 in a purely active system[26, 43–45].
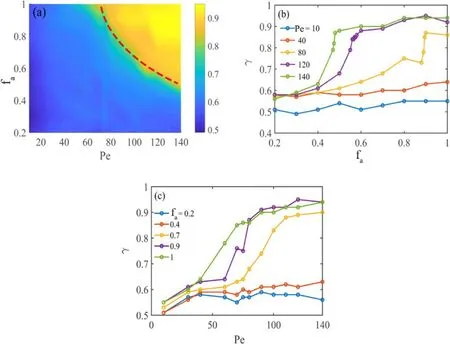
Figure 4.(a)Exponents of the power law of density fluctuation in active-passive mixtures withφ = 0.7.(b)and(c)illustrate the evolution of exponentsγ with fa and Pe, respectively.The red dashed curve in (a) denotes the boundary of phase separation.
It should also be noted that the values of the fluctuation exponentγdisplay a significant increase near the boundary of the MIPS marked with a red dashed line in figure 4(a).For the lower overall activities under the parameter configuration of the phase separation boundary, the exponent valuesγfluctuate gently,such as the curvesPe= 10 and 40 in figure 4(b)andfa=0.2and 0.4 in figure 4(c).However,γexhibits a significant increase once MIPS appears as shown in figures 4(b) and (c).Furthermore, figure 5 plots the fractions at the boundary of MIPSand the corresponding fluctuation exponentγ* for different Péclet numbers Pe in the twodimensional mixture with area fractionsφ= 0.7 and 0.8.This shows that the system has a power-law fluctuation with an approximate constant exponent of0.85 once MIPS occurs.
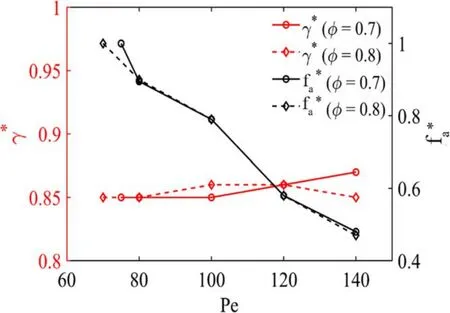
Figure 5.Fractions of active particlesand the exponents of the power-law of density fluctuations γ* at the boundary of phase separation for different Péclet numbers Pe.
4.Conclusion
In this work, we performed extensive simulations with varying compositions and the Péclet number to study twodimensional binary mixtures of active and passive Brownian particles.A standard Voronoi cell method is used to measure local number density to accurately detect the boundary of MIPS by the transition from the unimodal to bimodal density distributions [31, 42].By computing the local density distribution and MSD of the particle number density, we determined the boundary of the MIPS [41, 46] and showed the exponent of the power-law fluctuation in the Pe–faplane.It was found that there exists a significant jump of the exponent values near MIPS.In particular, the fluctuation exponent at the MIPS boundary is a constant of approximately 0.85.
The active matter has various shapes such as rods and chiral particles.GNF has also been observed in many active systems, such as long rods, radially symmetric particles,mixtures of self-propelled and passive rods, chiral active hexatics, etc [21, 34, 47, 48].Note that the nonuniformity of shapes could lead to alignment although apolar interaction enhances cluster formation.In this study, we explored the GNF in a mixture of active and passive spherical Brownian particles, which had not been studied previously.Our model consists of spherical particles.The main advantage over previous models is that no alignment can arise from steric effects.
It has been demonstrated that the phase behavior is related to the system activity [49].The jumping of the fluctuation exponent at the boundary of MIPS provides a new variable to analyze the critical properties of phase separation.Although active and passive particles interact with each other via a repulsive potential, it has been shown that active particles have attractive interactions in the presence of passive particles [50, 51].This is a possible kinetic solution to understanding the jumping phenomenon of the fluctuation exponent.On the other hand, many simulations and experiments confirm that MIPS occurred in different dimensions,from one to three[21,27,28,52].Marchetti et al also proved that the spatial dimension plays an important role in the fluctuation exponent [43].The density fluctuations of mixtures of active and passive particles should be subjected to a similar dimensional dependence.
Acknowledgments
This work was supported by the National Natural Science Foundation of China with Grant No.12075017 and by the high performance computing resources at Beihang University.
ORCID iDs
 Communications in Theoretical Physics2022年7期
- Communications in Theoretical Physics的其它文章
- Stable striped state in a rotating twodimensional spin–orbit coupled spin-1/2 Bose–Einstein condensate
- Probability density functions of quantum mechanical observable uncertainties
- The pseudoscalar meson and baryon octet interaction with strangeness S = -2 in the unitary coupled-channel approximation
- A new effective potential for deuteron
- Anisotropic and valley-resolved beamsplitter based on a tilted Dirac system
- Topological and dynamical phase transitions in the Su–Schrieffer–Heeger model with quasiperiodic and long-range hoppings