
Risk and Probability Considerations in Design of Major Infrastructure Systems
2011-01-04 01:58Ang
重庆交通大学学报(自然科学版) 2011年2期
A.H-S.Ang
(The University of California in Irvine,CA,USA)
1 Introduction
The safety of an infrastructure system,such as a major bridge,is the primary responsibility of the structural engineer.To ensure safety requires technical information on the loadings and forces that can be expected(as well as unforeseen)over the useful life of the structure;technical information on the structural capacity and its responses(including dynamic)to extreme hazards are also required.This information invariably contains uncertainties,especially over the long life of a major system(e.g.,for 50-100 years).
For practical purposes,uncertainties may be defined in two broad types;namely,those that are databased known as aleatory,and those that are knowledgebased known as the epistemic type.The aleatory type is represented primarily by the variability in observed data,whereas the epistemic type represents our inability to accurately model reality.
In light of these uncertainties,there is some probability or risk of nonperformance(or even failure)of the system over its useful life-the loadings may vary significantly including forces from unforeseen or unexpect-ed natural hazards,and the capacity of the system may deteriorate more than those assumed during the design stage;therefore,the performance of the system may be assured only in terms of probability,whereas the consequences to nonperformance(or failure)are also difficult to estimate;thus,some measures of risk are generally unavoidable.Properly then,decisions on the appropriate level of safety for design ought to be based on avoiding or minimizing these risks.
The thrust here is on a systematic procedure for handling the two types of uncertainties and developing the respective significances on the associated risk for formulating conservative(or risk-averse)design decisions,including safety levels for design.
2 On Risk and Probability
2.1 Basic Concept
Under conditions of uncertainty,the results of theoretical analyses or any estimates will also contain uncertainties;these uncertainties are often just as important as the relevant results of interest.For example,the loadings may vary significantly including forces from unforeseen or unexpected natural hazards,and the capacity of the system may deteriorate more than those assumed during the design stage;therefore,over its life-time,the performance of a system may be assured only in terms of probability or reliability due to the variabiliies(aleatory uncertainties)in the loadings and structural capacities.Furthermore,there is also uncertainty in all estimates including the calculated failure probability;i.e.,due to the epistemic type of uncertainty,the true failure probability may be defined within a range of possible values.The effect of this latter uncertainty is also important,particularly in order to specify(conservatively)what is a tolerable failure probability for the design of the system.
2.1.1 Modeling and Significance of Uncertainties
Uncertainties may be classified broadly into two types as defined above;namely,the aleatory and the epistemic types.The aleatory type is not reducible as it is inherently part of the randomness or variability of nature-additional observational data or improvement in the data collection process may increase the accuracy of the degree of variability,but may not reduce it;in fact it may even increase the variability.On the other hand,the epistemic uncertainty can be reduced through the use of better or improved models of reality,or through more seasoned judgments of experts.In practice,the epistemic uncertainty may be limited to the inaccuracy in estimating the mean(or median)values.
By separating the uncertainties into these two broad types,their respective significances in engineering applications can be delineated as follows:
The probability of non-performance or failure of a system(or conversely its safety index)is associated with the aleatory variability,whereas the epistemic uncertainty will yield a range of possible calculated failure probabilities(or corresponding safety indices).
That is,because of the epistemic type of uncertainty,the calculated failure probability or corresponding safety index becomes a random variable and thus would have a range of possible values with an associated probability distribution(e.g.,PDF)of its own.
Observe that if the two types of uncertainties were combined into a total uncertainty,the calculated probability of failure would be its“best estimate”value(a single value).This best estimate value is,in fact,the mean value of the range of the possible failure probabilities mentioned above.
2.1.2 Determination of Risk-Averse Safety Levels for Conservative Designs
As indicated above,the epistemic uncertainty is represented by the range of the possible values of the failure probability with its distribution function(PDF).This distribution conveys complete information of the possible values of the failure probability.Similarly,the inverse of the failure probability distribution yields the corresponding distribution of the safety index.
The probability distribution of the safety index is of special significance in the specification of the appropriate safety level for design.For risk averseness[1],a high percentile value may be specified,particularly for the conservative design of an important system,in order to minimize the effect of the epistemic uncertainty.For example,by selecting the 90%value within the range of possible safety indices,there is implicitly a 10%chance that the selected value may be inadequate.Observe,on the other hand,that the“best estimate”value(or mean value)of the safety index could be inadequate by a 50%probability.
With a specified safety index(e.g.,the 90%value)the corresponding safety factor(SF)for working stress design,or corresponding load and resistance factors for ultimate strength(LRFD)design can be derived[2-3].
3 A Numerical Illustration
3.1 Design Evaluation of a Cable-Stayed Bridge
In recent years,cable-stayed bridges have become one of the most popular type of long-span modern bridges in the world.The general concepts described above is applied to the review and evaluation of the design of a cable-stayed bridge in Korea[4],including a comparison with its minimum life-cycle cost design.For this latter purpose,several alternative designs of the bridge were considered in which the sections of the main members were increased or decreased relative to its standard design.Reliability analyses were then performed for each of the designs and the corresponding safety indices and expected life-cycle costs were estimated.
Fig.1 shows the overall configuration of the cablestayed bridge in Korea under consideration,which consisted of a steel box type girder,2 sets of steel box type towers,and 68 sets of lock coiled type cables.

Fig.1 Profile and 3-D model of the cable-stayed bridge图1 斜拉桥立面和三维模型
Also,Fig.1 shows the three dimensional model of the cable-stayed bridge[5],indicating the locations of the critical members.
The bridge was designed according to the specification for long-span highway bridges in Korea[6].Seismic response analysis was performed by applying the acceleration time history to the elastic supporting points of all piers and abutments in the horizontal,lateral and vertical directions simultaneously.
3.2 Probabilistic Reliability Analyses of the Bridge
A reliability analysis was performed for each alternative design of the cable-stayed bridge under the lifetime maximum load;i.e.,under the combined dead load,D,live load,L,and earthquake load,E.The reliability analyses were performed with cable tensions,axial forces of the girders and towers,and bending moments using the first-order reliability method(FORM).
The factors containing uncertainties include the maximum stresses in the critical members of the bridge structure(cable tensions,bending moments in the main girders,and tower forces).Appropriate probability distributions and statistical parameters were assumed and estimated for the ultimate capacities of the cables,the girders,and the towers.Also,coefficients of variations(c.o.v.)for the ultimate strength and all the member forces were prescribed to be between 10%-15%.These c.o.v.’s represent the respective aleatory uncertainties based on available data.
3.2.1 Results of Reliability Analyses
Reliability analysis was performed for the standard design of the bridge;similar analyses were also performed for the alternative designs with increased and decreased sections of the critical members as shown in Fig.1.Fig.2 shows the safety indices and failure probabilities of the critical members(girders,towers and cables)for the different designs.

Fig.2 Failure probabilities and safety indices associated with aleatory uncertainties图2 与偶然不确定性相关的失效概率和安全指数
For the standard design(based on current code),the failure probabilities of the critical members are as follows:
Girder:PF1=3.647E -03
Tower:PF2=6.664E -05
Cable:PF3=9.425E -05
The failure probability of the bridge system is the union of the failure probabilities of the critical members,yielding therefore the system failure probability of PFS=3.807E -03,for the standard design.The corresponding safety index would be β =2.669.
The above results assume that there are no errors(i.e.,epistemic uncertainties)in the estimation of the properties,such as ultimate capacities of the critical members,and of the maximum dead,live and seismic load effects.Clearly,there will be inaccuracies in these estimations,and thus epistemic uncertainties in the respective estimated mean(or median)values.These epistemic uncertainties may be expressed in terms of the respective c.o.v.’s,e.g.,the following reasonable values were prescribedfor the estimated mean structural capacity,ΔC=0.09;the estimated mean dead load,ΔD=0.10,and for the estimated median live and earthquake loads,ΔL= ΔE=0.20.
3.2.2 Determination of Optimal Design
In order to determine the optimal design based on minimum expected life-cycle cost(LCC),nine alternative designs were considered,including the standard one(based on current code),by increasing and decreasing the main member sections relative to the standard design.On this basis,the initial cost for each of the alternative designs can be determined as summarized in Table 1 .
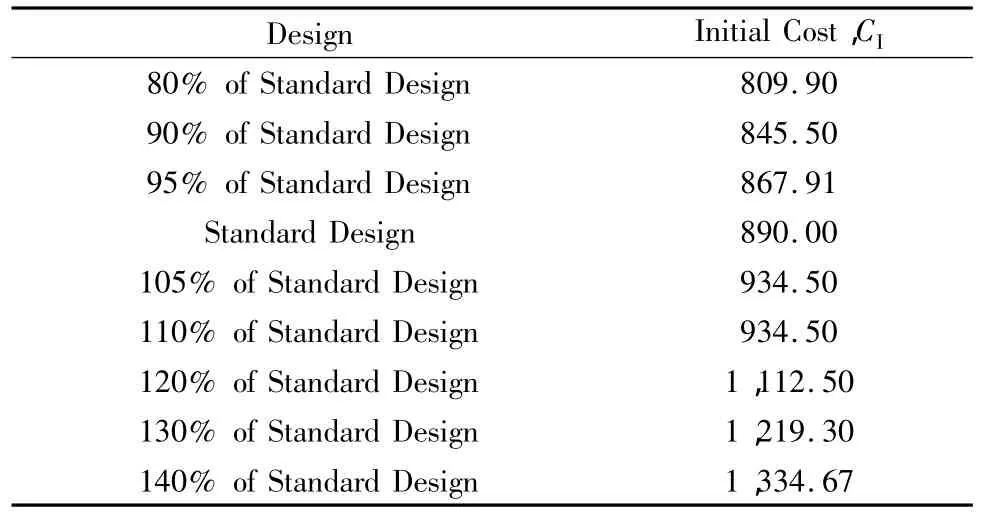
Table 1 Initial costs of alternative designs(in million USD)表1 各设计方案的初始成本 /百万美元
The initial cost for each of the alternative designs includes the design costs,construction costs and eventual load testing costs before use[7].The initial cost for the standard design of the bridge is based on information from construction reports in Korea.All of the initial costs for the standard design and those of the different alternative designs are shown in Table 1 (in US dollars).
3.2.3 Expected Damage Cost
The damage cost includes all the tangible and intangible economic losses resulting from a structural damage or failure of the cable-stayed bridge(including the cost associated with the closing of the bridge to traffic).Even though collapse of the bridge is highly unlikely under normal circumstances,the damage cost must include this cost as well as that of insurance[8].Therefore,the expected damage cost,CD,may consist of several components Cias follows:

where,CFR=bridge replacement cost;CFL=loss of lives and equipment costs;CFH=cultural and historical costs;CFD=functional disruption costs;and CFEN=environmental and social costs.
Specifically,in estimating the life-cycle cost of the cable-stayed bridge,the initial cost items,plus the maintenance cost and damage cost items as percentages of the initial cost can be summarized as shown in Table 2 .

Table 2 Expected life-cycle cost items表2 预期生命周期成本
All the above future damage cost items must be expressed in present worth.For this purpose,each potential future damage cost item would be multiplied by the Present Worth Factor(PVF),as follows[9],

where,α =ln(1+q);q=annual discount rate;and L=lifetime of structure.
This study assumes that the lifetime of the cablestayed bridge in question is 50 years and the annual discount rate is 4.0%.
The initial costs and expected damage costs as de-scribed above are summarized in Table 2 .
3.2.4 The Epistemic Uncertainties of Cost Items
The estimate of the initial and maintenance costs,CI,CM,for each of the alternative designs in Table 1 may contain some uncertainty(epistemic type).It may be reasonable to assume that the actual initial and maintenance costs could vary by± 20%;or expressed in terms of c.o.v.’s ΔCI=ΔCM=0.20.
Moreover,for each of the damage cost components in Eq.(1),the c.o.v.’s representing the respective epistemic uncertainties may be assumed to be those shown in Table 3 .

Table 3 Epistemic uncertainties in damage cost items表3 损坏成本的认知不确定性
Based on the information assumed in Table 2 and Table 3 ,the expected damage cost would be

from which the mean and variance of the expected total life-cycle cost(LCC),CT,become,

4 Optimal Design and Safety Factor
With the information summarized above,the LCC for all the nine alternative designs shown in Table 1 were evaluated;the results between the mean safety index,E(β),and the expected life-cycle cost,E(LCC),for each of the alternative designs due to the respective aleatory uncertainties are evaluated.These results are summarized graphically in Fig.3 which shows that the optimal design,with minimum E(LCC)is obtained at a mean safety index of E(β)=2.284.
Finally,because of the epistemic uncertainties described in Sect.3.2.4 and summarized in Table 3 ,the true failure probability and corresponding safety index will,respectively,be random variables.In particular,the histogram of the safety index generated through Monte Carlo simulation with a sample size of 10,000 is portrayed in Fig.4.From this figure,the mean value,the 75%value,and the 90%value of the safety index β are denoted by the arrows and summarized in Table 4 for the optimal design of the cable-stayed bridge in Jindo,Korea.

Fig.3 Mean value or percent LCC versus E(β)with epistemic uncertainties图3 生命周期成本的平均值或百分数与认知不确定性的平均安全指标值之间的关系
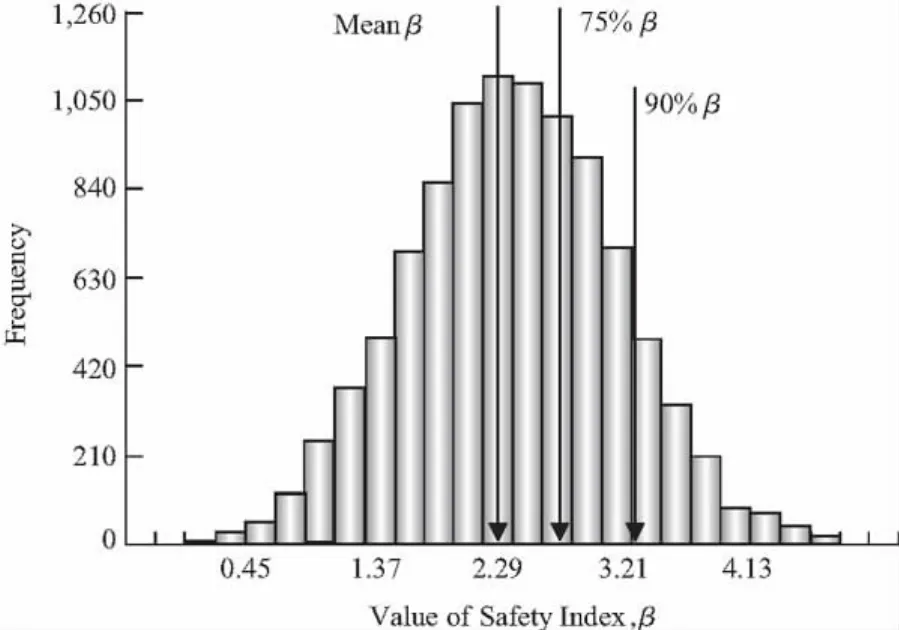
Fig.4 Frequency diagram of β for optimal design due to epistemic uncertainties图4 基于认知不确定性的优化设计安全指标频率图

Table 4 The mean value,75%value,and 90%value of the safety index表4 安全指标值的平均,75%及90%的值
The main results for the bridge can be summarized also as follows(including the respective failure probabilities):
Safety indices: Failure probabilities:
Mean β =2.281, Mean PF=1.112E -02,
75% β =2.835, 25%PF=1.394E -02,
90% β =3.324, 10%PF=1.627E -02.
4.1 Safety Factor in Design
The safety index is related to the failure probability as can be observed above.However,structural design is generally performed using safety factors,SF,in the case of working stress design,or load and resistance factors in the case of ultimate(or LRFD)design.For these purposes,the specified or required safety index,β,can be translated into the corresponding SF or load and resistance factors.
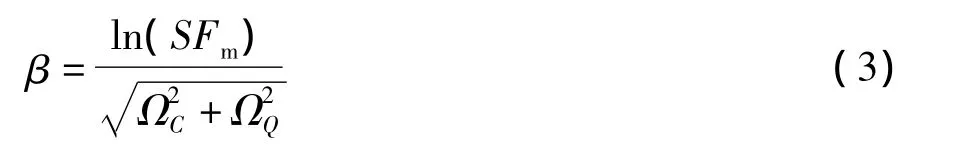
In particular,the safety index,β,is related to the median safety factor,SFm,as follows:
or conversely,

where,ln stands for the natural logarithm;and ΩCand ΩQare,respectively,the total uncertainties(in terms of the c.o.v.’s)of the capacity and loadings.
In the present case of the bridge in Korea,we may select(with appropriate conservativeness)the 90%β of 3.324.Then,according to Eq.(4),this is equivalent to a median safety factor(SFm)of around 3.00.
Also,equivalent load and resistance factors may be derived through the first-order reliability method(FORM)for ultimate(or LRFD)design.
4.2 Summary of Results of Illustrative Example
The systematic procedure for handling uncertainties was illustrated with the evaluation of a cable-stayed bridge in Jindo,Korea under dead,live and earthquake loadings.Based on estimates of the aleatory uncertainties and reasonably realistic assumptions of the respective epistemic uncertainties,complete information(i.e.,distributions)of the failure probability and safety index,are obtained for the original design of the bridge and its minimum life-cycle cost design.This allows the specification of prescribed percentile values of the pertinent results including safety parameters for conservative designs.
For the cable-stayed bridge in Jindo,Korea,the results indicated that the 90%value of the lifetime failure probability is 1.63E -02,or a 90%safety index of 3.324,which is equivalent to a safety factor of approximately 3.00.
This analysis also shows that the current design code for cable-stayed bridges in Korea should yield bridge structures that are close to its respective optimal designs(i.e.,from the standpoint of minimum life-cycle cost).
5 Conclusions
In the presence of unavoidable uncertainties,it is not possible to ensure the complete safety of a major infrastructure system,such as a long-span bridge,particularly when it must include the threat of a natural hazard such as a strong-motion earthquake.
Uncertainties may be categorized into the two broad types;one is data-based(aleatory)which is part of the randomness of natural phenomena whose significance can be expressed in terms of the probability of failure;the other is knowledge-based(epistemic)which is associated with imperfections in modeling and estimating reality and leads to a range of possible values of the failure probability.
For practical applications,epistemic uncertainty may be limited to the imperfections in the estimation or predication of the mean(or median)values of the design variables and parameters.
Because of the epistemic uncertainties,the calculated results such as failure probability,safety index,or risk,become random variables with respective distributions(or histograms).These distributions,such as for the safety index,allow the specifications of high percentile values to ensure sufficient risk averseness and minimize the effect of the epistemic uncertainty.For example,the 90%value(or the 95%value)of the safety index should provide some conservativeness in designs,which is particularly important for long span bridges or other major infrastructure systems.
With reference to the illustrative cable-stayed bridge in Jindo,Korea,the current bridge design code in Korea appears to yield structures that are close to the safety level of the minimum life-cycle cost design.The 90%safety index for this bridge in Jindo,Korea of β =3.324 is equivalent to a median safety factor of SFm≈ 3.00.
[1] Ang A H-S.Practical Assessments of Risk and Its Uncertainty[C].Kobe,Japan:Proc.IFIP Workshop,2006.
[2] Ang A H-S,Tang W H.Probability Concepts in Engineering[M].2ndEdition.New York:John Wiley & Sons,Inc.,2007.
[3] Ang A H-S,Tang W H.Probability Concepts in Engineering Planning and Design:Vol II[M].New York:John Wiley & Sons,Inc.,1984.
[4] Han S H,Ang A H-S.Optimal Design of Cable-Stayed Bridges Based on Minimum Life-Cycle Cost[C].Seoul,Korea:Proceedings,IABMAS'08,2008.
[5] Han S H,Shin J C.The stochastic finite element analysis and reliability analysis subjected to earthquake load[J].Journal of Computational Structural Engineering Institute of Korea,2005,18(1):29-42.
[6] Korea Institute of Construction Technology.A Study on Design and Construction Method for Long Span Bridges[R].Report ID KICT/95-SE-111-64.Goyang-Si Gyeonggi-Do:Korea lnstitnte of Contruction Technology,1995.
[7] Ang A H-S,De Leon D.Modeling and analysis of uncertainties for risk-informed decisions in infrastructures engineering[J].Journal of Structure& Infrastructure Engineering,2005,1(1):19-31.
[8] Frangopol D M,Lin K Y.Life-cycle cost design of deteriorating structures[J].Journal of Structure Engineering,ASCE,1997,123(10):1390-1401.
[9] Ang A H-S,Pires J,Lee J C.Reliability-based Optimal Aseismic Design of Reinforced Concrete Building,Year 2[R].Kajima:CUREe,1996.
[10] Lee K M,Cho H N,Choi Y M.Life-cycle cost effective optimum design of steel bridges[J].Elsevier:Journal of Constructional Research,2004,60:1585 -1613.
猜你喜欢
法律方法(2022年2期)2022-10-20
建材发展导向(2022年3期)2022-04-19
山东交通科技(2020年1期)2020-07-24
铁道建筑技术(2020年11期)2020-05-22
中国外汇(2019年7期)2019-07-13
进出口经理人(2017年5期)2017-07-07
兵器装备工程学报(2017年4期)2017-04-28
系统工程与电子技术(2016年4期)2016-08-24
地方财政研究(2014年12期)2014-03-19
应用技术学报(2014年3期)2014-02-28
