Estimates value of the expected wind speed in straits area wind environment using extreme value distribution scheme
2011-06-15 01:26LIUHuiZHANGLiangliangYANGZhuanyunHEWei
实验流体力学 2011年4期
LIU Hui ,ZHANG Liang-liang,YANG Zhuan-yun,HE Wei
(1.College of Civil Engineering,Chongqing University,Chongqing 400045,China;2.Sichuan College of Architecture Technology,Deyang Sichuan 618000,China;3.Key Laboratory of New Technology for Construction of Cities in Mountain Area(Chongqing University),Ministry of Education,Chongqing 400045,China)
Estimates value of the expected wind speed in straits area wind environment using extreme value distribution scheme
LIU Hui1,2,ZHANG Liang-liang1,3,YANG Zhuan-yun2,HE Wei2
(1.College of Civil Engineering,Chongqing University,Chongqing 400045,China;2.Sichuan College of Architecture Technology,Deyang Sichuan 618000,China;3.Key Laboratory of New Technology for Construction of Cities in Mountain Area(Chongqing University),Ministry of Education,Chongqing 400045,China)
For important bridges,it is required by the Wind-resistant Design Code for Highway Bridges that a reasonable basic design wind speed be selected from the results obtained either by re-observing the basic design wind speed at bridge site or by referring to the samples of measured wind speed.In this paper,the design wind speed of Xiamen-Zhangzhou Cross-sea Bridge corresponding to different return period was calculated using three extreme value distribution schemes with the extreme value of the wind speed and its corresponding wind direction standard value taken from 360months′10-minute-time-interval observation by Xiamen Observatory and Longhai Weather Bureau .It is obtained that the 100-year return period expected wind speed at the bridge site is 35.8m/s,lower than 39.7m/s as given in the Code.
extreme value distribution scheme;basic design wind speed;Xiamen-Zhangzhou cross-sea bridge;straits area wind environment
0 Introduction
“Wind-resistant Design Code for Highway Bridges”Code 3.2.6provides that when the observed data is insufficient or when the local meteorological station is far away from the bridge site and the lay of the land is greatly different from the me-teorological station,wind speed observation stations should be set up at the bridge site,and the design wind speed at the bridge site could be reckoned by the relevance of the wind speed observation data between the bridge site and the nearby meteorological stations;and then the design basic wind speed could be calculated using formula 3.2.4-2in this Code[1].For the long-span bridge,the wind load and wind-induced dynamic response of thebridge structure may be the key issues of its structural strength design.Therefore,it is very important to correctly consider the wind speed size and direction at the bridge site.In order to ensure the reliability of the research results of bridge wind resistance,it is not suitable to simply adopt the basic wind speed at the bridge site as the design wind speed at the bridge.The basic design wind speed near the Jingzhou-Yueyang Yangtze River Bridge was calculated by using Type I extreme value distribution and wind profile index calcuation method[2].At present,Type I extreme value distribution have been used by the wind-risistant design code of many countries,but TypeⅡ extreme value distribution has been adopted to the wind-resistant design code of the United States[3].Extreme wind speed was initially considered to obey the typeⅡextreme value distribution[4],and then the results had shown that the use of type I extreme value distribution be more appropriate[5],but recent study results have shown that application with typeⅢextreme value distribution can be given the best estimation of extreme wind speed[6].
1 Project Introduction
Xiamen-Zhangzhou Cross-Sea Bridge is located in the east of Xiamen and Zhangzhou and crosses the entrance of Jiulong River,of which,the north of Haimen Island connecting to Xiamen Haicang District is Beicha Bridge,a total length of 6392.6m.The main bridge is recommended to be steel full-box girder bridge,with a main span of 720mlong,and a total length of 1290m.The North Approach Bridge is 1130mlong,and South Approach Bridge is 3972.6m (see Figure 1).The main span of North Approach Main Bridge is 720m,ranking 6th of world's similar bridges in term of span,and ranking 4th in the coastal bridges.The bridge with the main span's length of 600mis still blank at the coastal area.Therefore,it is of great significance to carry out the wind resistance research on the Xiamen-Zhangzhou Cross-Sea North Approach Main Bridge so as to ensure the wind resistance stability,security and con-formity during its construction and usage.
2 Selection of wind speed samples
This study investigated and collected the wind speed record data of the meteorological station(Xiamen Professional Observatory and Longhai Meteorology Bureau)nearby the bridge site,including the wind speed and direction normalized values of monthly extreme value,10minutes average time interval from January 1977to December 2006.Thus,monthly extreme value wind speed and direction values of 360-month were compiled,and the mathematical statistical methods were used to fit out the wind speed distribution probability model suitable for the meteorological station.Then the design wind speed could be reckoned by the different usage period corresponding to different return period.In view that the wind speed station is close to the bridge site,the wind speed and direction information at the wind speed station could be accurately converted to calculate the wind field characteristic at the bridge site.The relation between the meteorological station and bridge site is as shown in Figure 1.
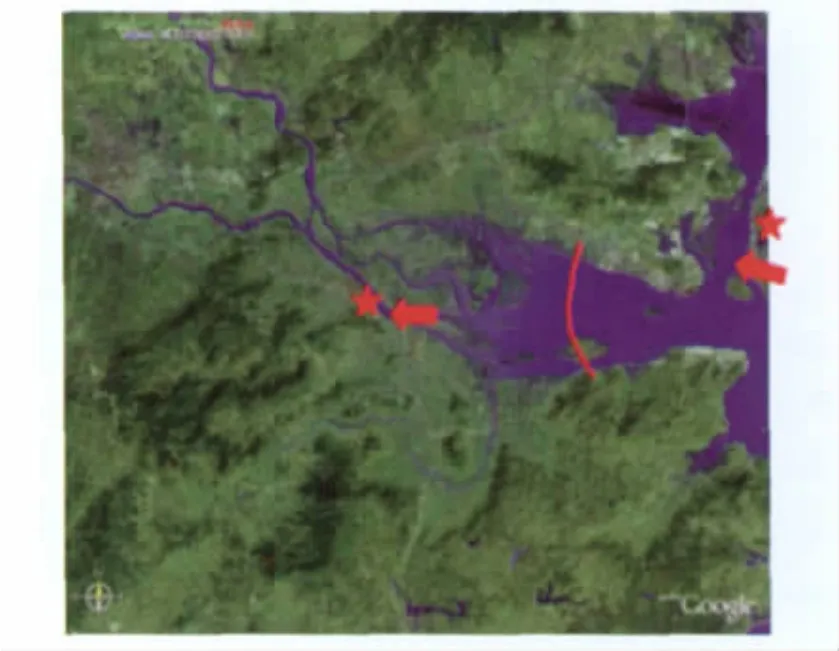
Fig.1 Satellite map at the bridge site by Google[7]图1 桥址处的卫星图片
Table 1shows the 30-year distribution relationship between the speed and direction of Xiamen Professional Meteorological Observatory.The wind direction of the monthly extreme value wind speed is not uniformly distributed at 16positions,mainly setting in the NNE,NE,ENE,E and ESE direction,covering 65.67%of total wind speed records,and monthly extreme wind speed at other directions is less likely,as shown in Figure 2a.
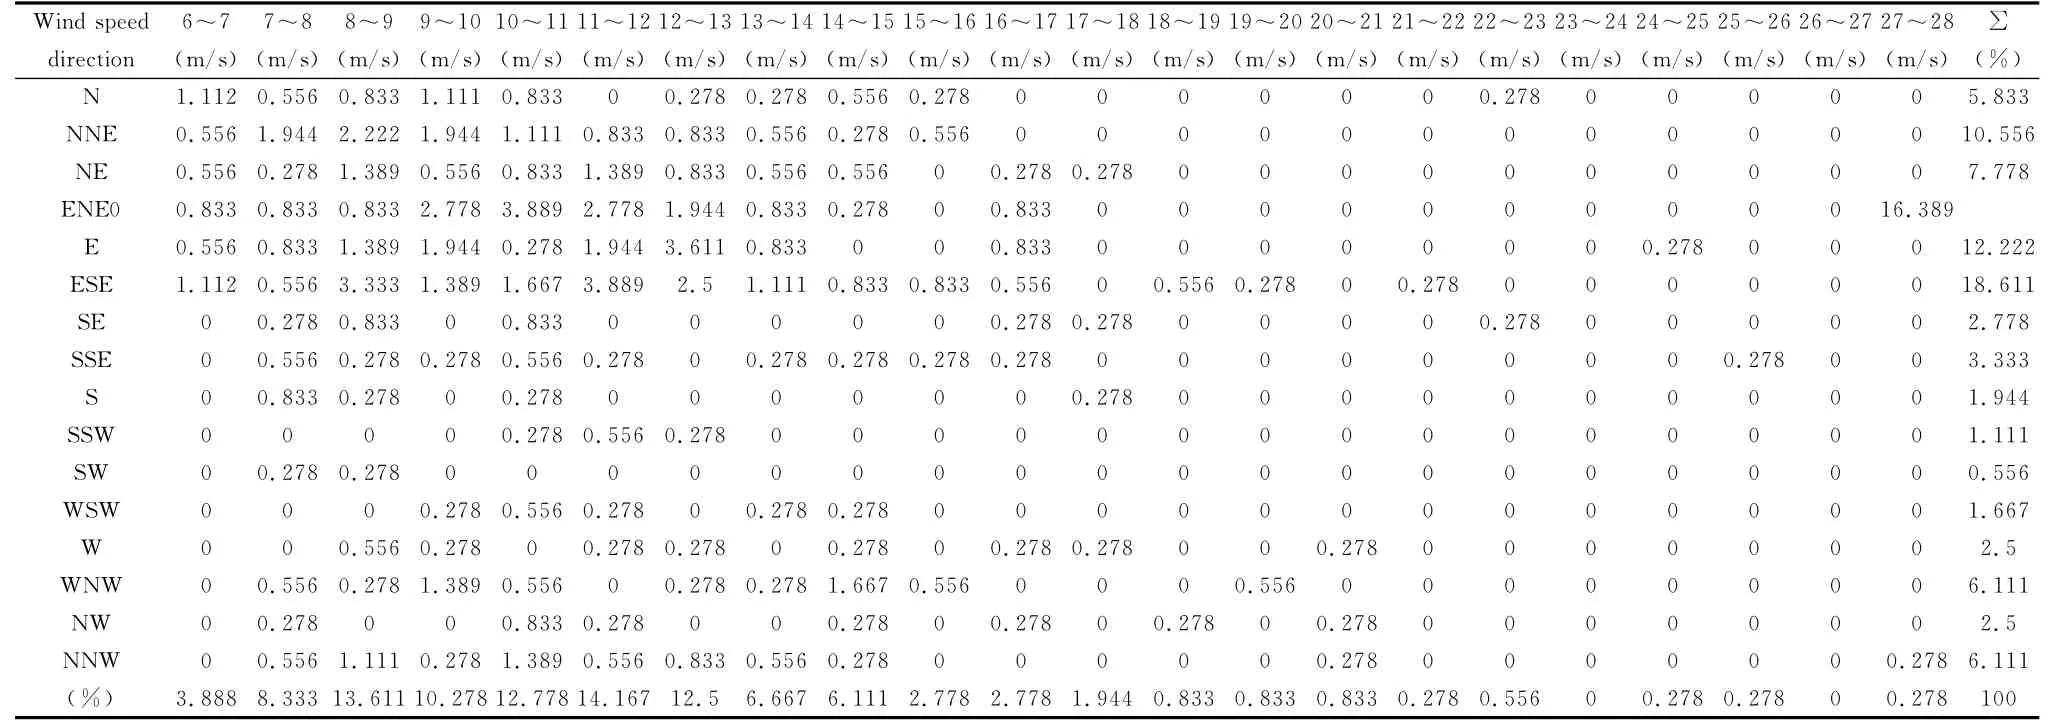
Table 1 Wind speed and direction statistics results at Xiamen Professional Meteorological Observatory
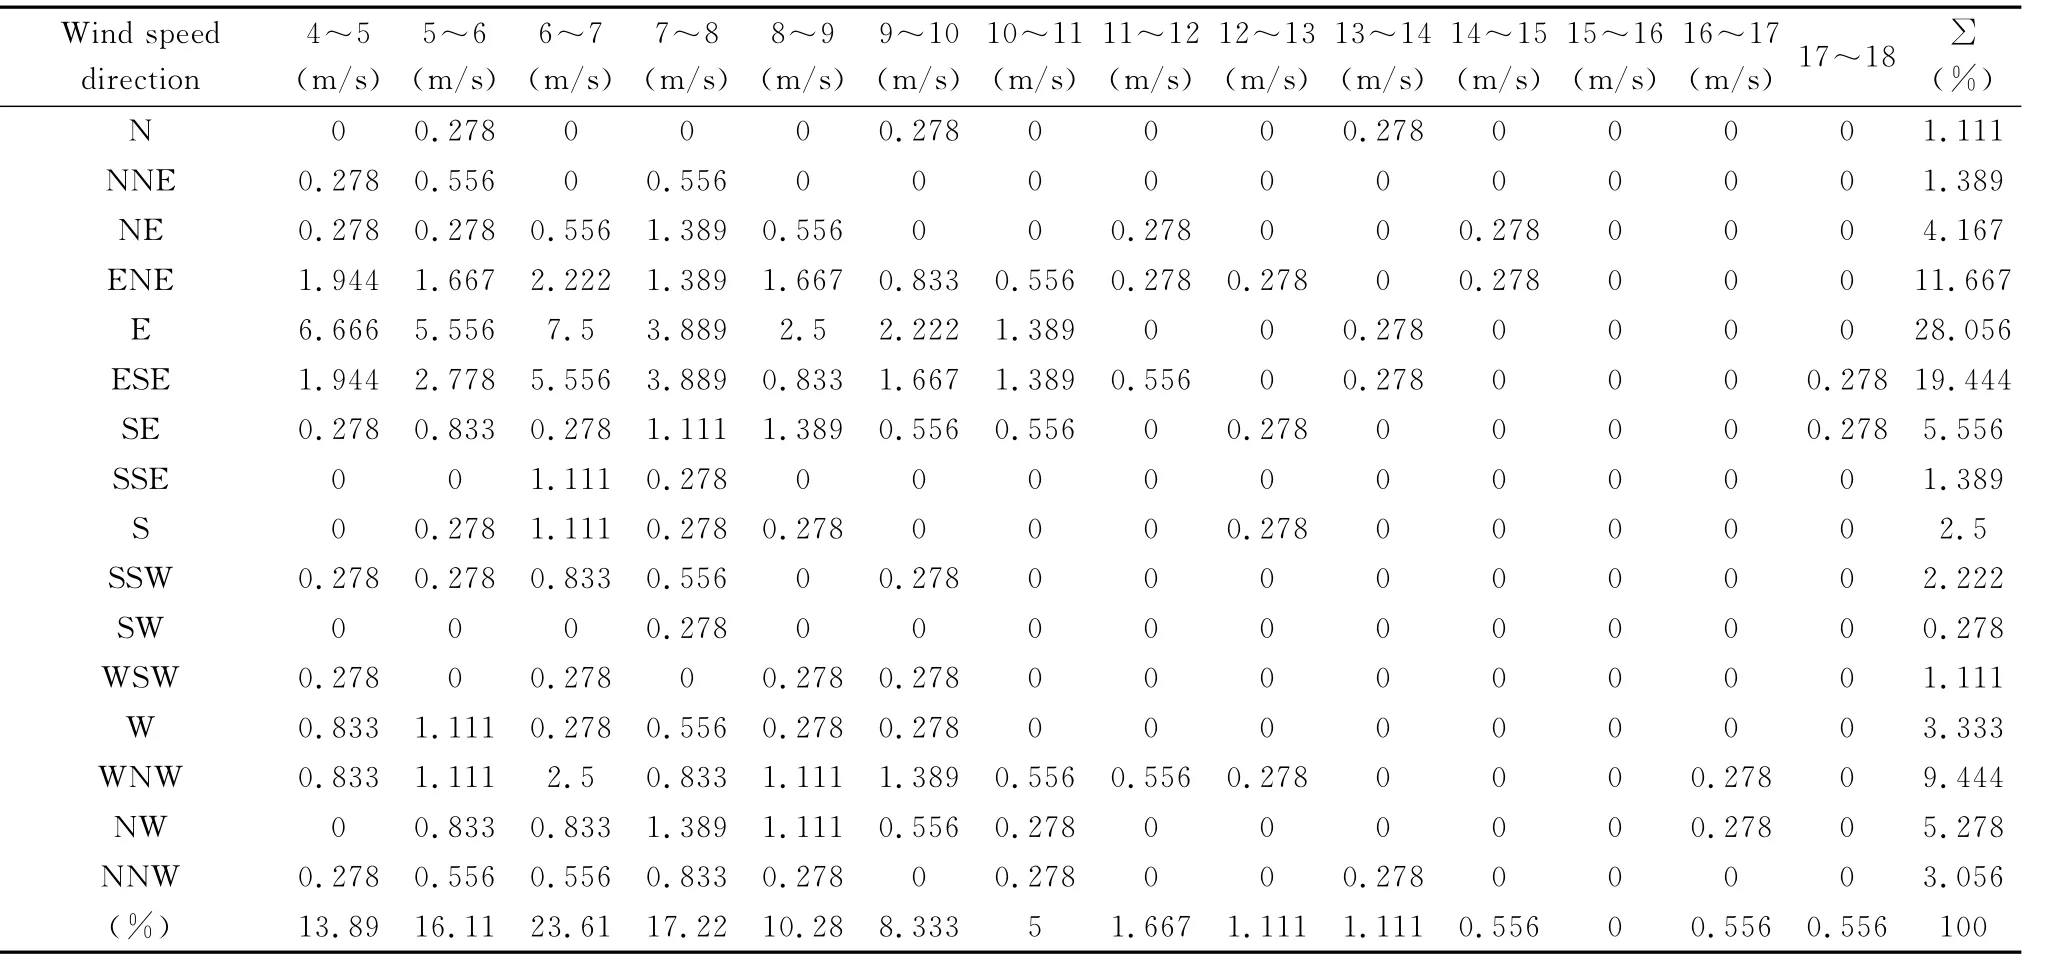
Table 2 Wind speed and direction statistics results at Longhai Meteorology Bureau
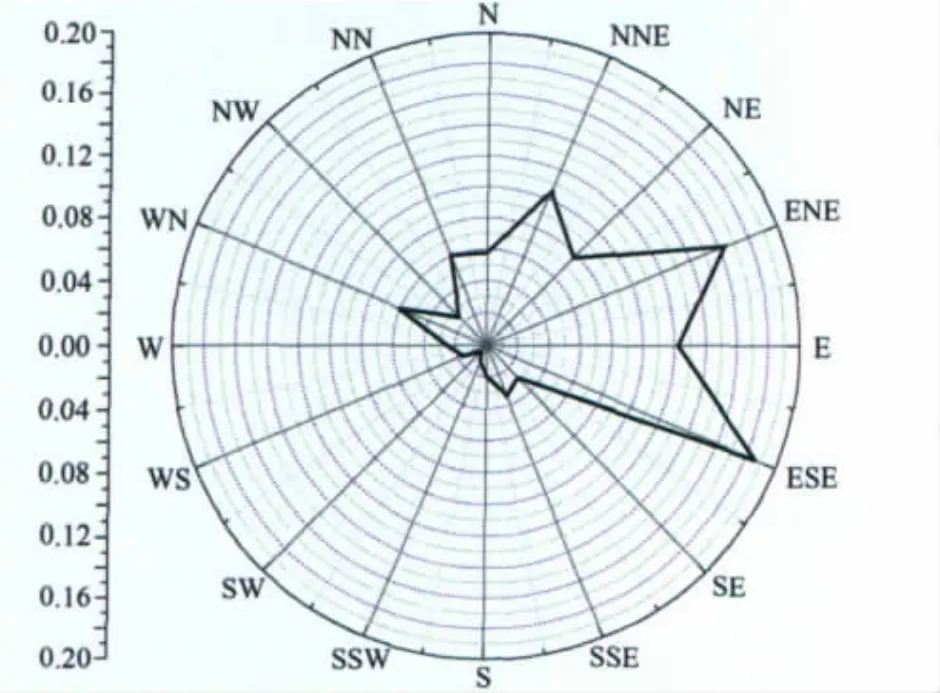
Fig.2a Rose diagram of 10mhigh wind direction distribution frequency of Xiamen professional meteorological observatory图2a 厦门市专业气象台10m高度风向分布频度玫瑰图
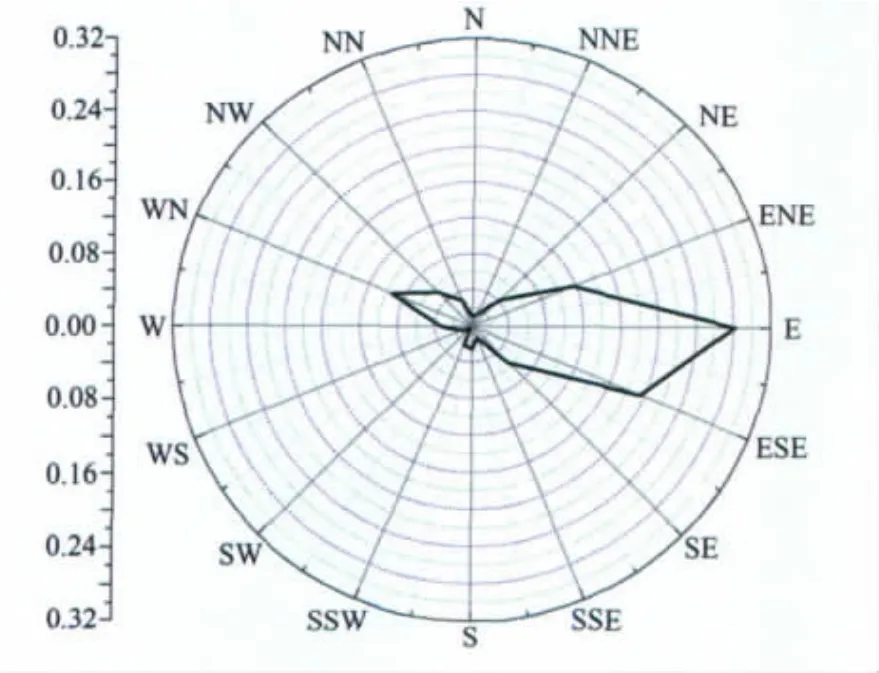
Fig.2b Rose diagram of 10mhigh wind direction distribution frequency of Longhai Meteorology Bureau图2b 龙海市气象局10m高度风向分布频度玫瑰图
Table 2shows the 30-year distribution relationship between the speed and direction of Longhai Meteorology Bureau,as shown in Figure 2b.The wind direction of the monthly extreme wind speed is not uniformly distributed at 16positions,mainly setting in the ENE,E and ESE direction,covering 59.17%of total wind speed record,and monthly extreme wind speed at other directions is less likely,as shown in Figure 2.So this paper will use the distribution type testing and fitting methods,excluding the azimuthal wind speed;and base on wind direction distribution frequency to estimate the maximum possible emerging extreme value wind speed and direction.
3 Wind speed distribution type testing
The description of the average wind probability generally uses the random variable model.When the wind speed recorded data is collected enough,the distribution will show a certain regularity,which is called the wind speed distribution probability model and referred to as the distribution type.It is based on the statistical test that one may find whether or not the wind speed recorded data is fitted into one specific distribution probability model.
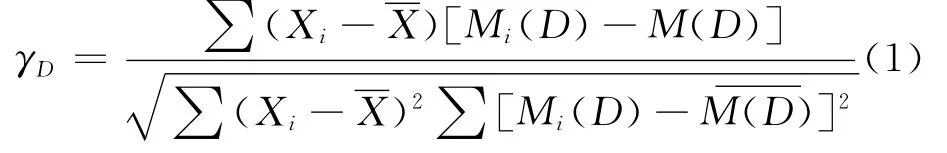
Because the wind speed observation numbers are small,the probability plot correlation coefficient(PPCC)method for small testing samples may be used.Probability plot correlation coefficient is defined as:
In the statistical analysis of average wind,the data that are mainly considered are generally the recorded data of extreme wind speed,but the final calling for the calculation are also the expected extreme value wind speed in the return period,namely the wind speed in N-year return period.Therefore,in terms of mathematical statistics theory,it is most reasonable to adopt the extreme value distribution probability model.
No matter what type the original distribution of random variable is,if the sub-samples taken are the maximum value,they can be described by the following three types of extreme value distribution as long as the maximum value asymptotic distribution exists:
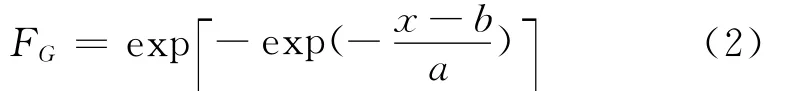
Type I extreme value distribution(Gumbel)
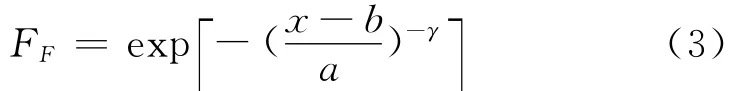
TypeⅡextreme value distribution(Frechet)
Type III extreme value(Weibull)distribution
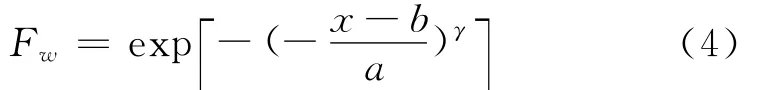
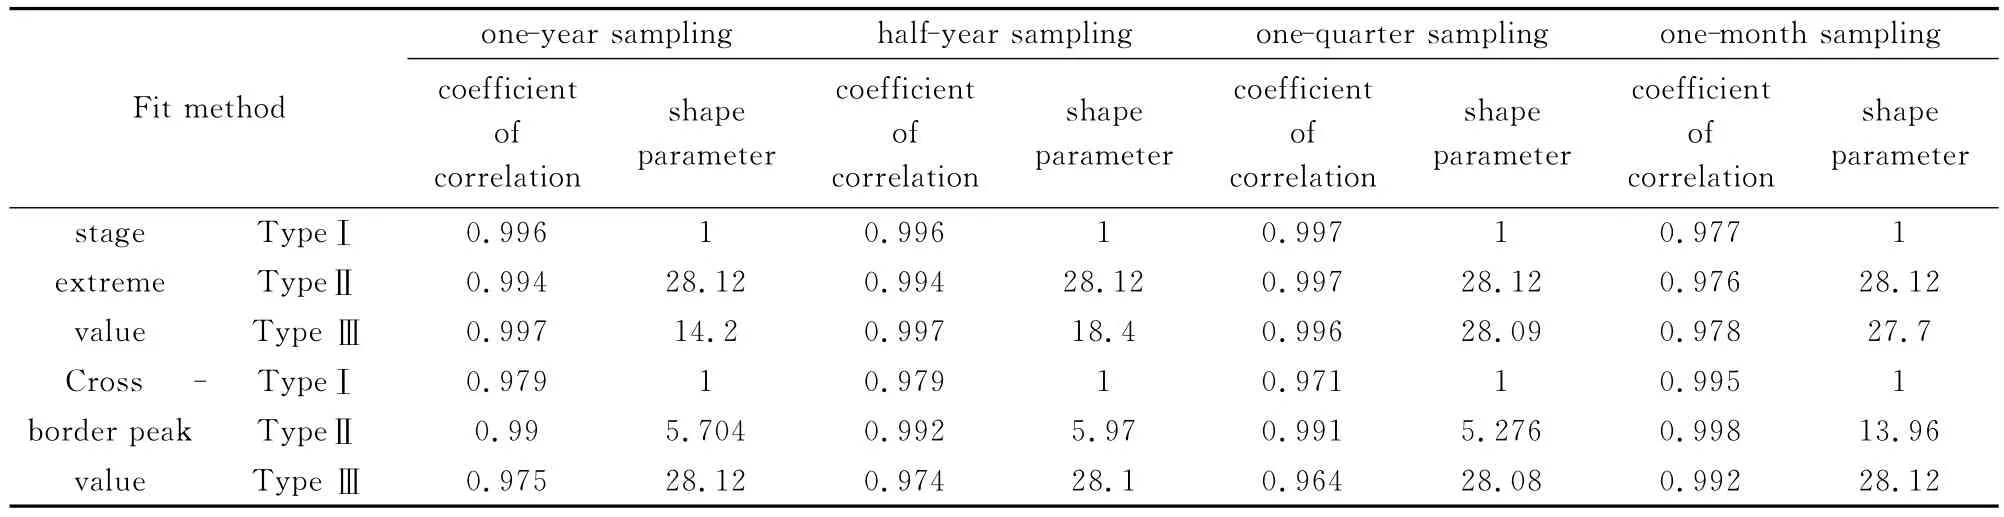
Table 3 Test results of different wind speed sampling methods at Xiamen Professional Meteorological Observatory
In the above three equations,ais the scale parameter;bis the location parameter;γis the shape parameter.
The samples are selected using the stage extreme value and out-of-bounds peak value methods.Then Type I,Ⅱand III extreme value distributions are tested with the largest sub-samples of one year,half a year,one quarter and one month.The obtained results are summarized in Table 3and Table 4.The test results of the different types of samples range between 0.9 6 4and 0.9 9 8.So,just from the sam-pling point,any sampling method shown in Table 3 and Table 4can be used.Wind speed process is not strictly a stationary process.The existing average wind probability analysis and research results show that no matter what type of distribution of the wind speed parent sample is,TypeⅡextreme values are sampled for one year,half year,or Type I and type III extreme values are sampled by one month and one quarter;both are likely to give better estimation results of the expected wind speeds.
In summary,Table 5lists the acceptance degree of the different samplings to different fit types.
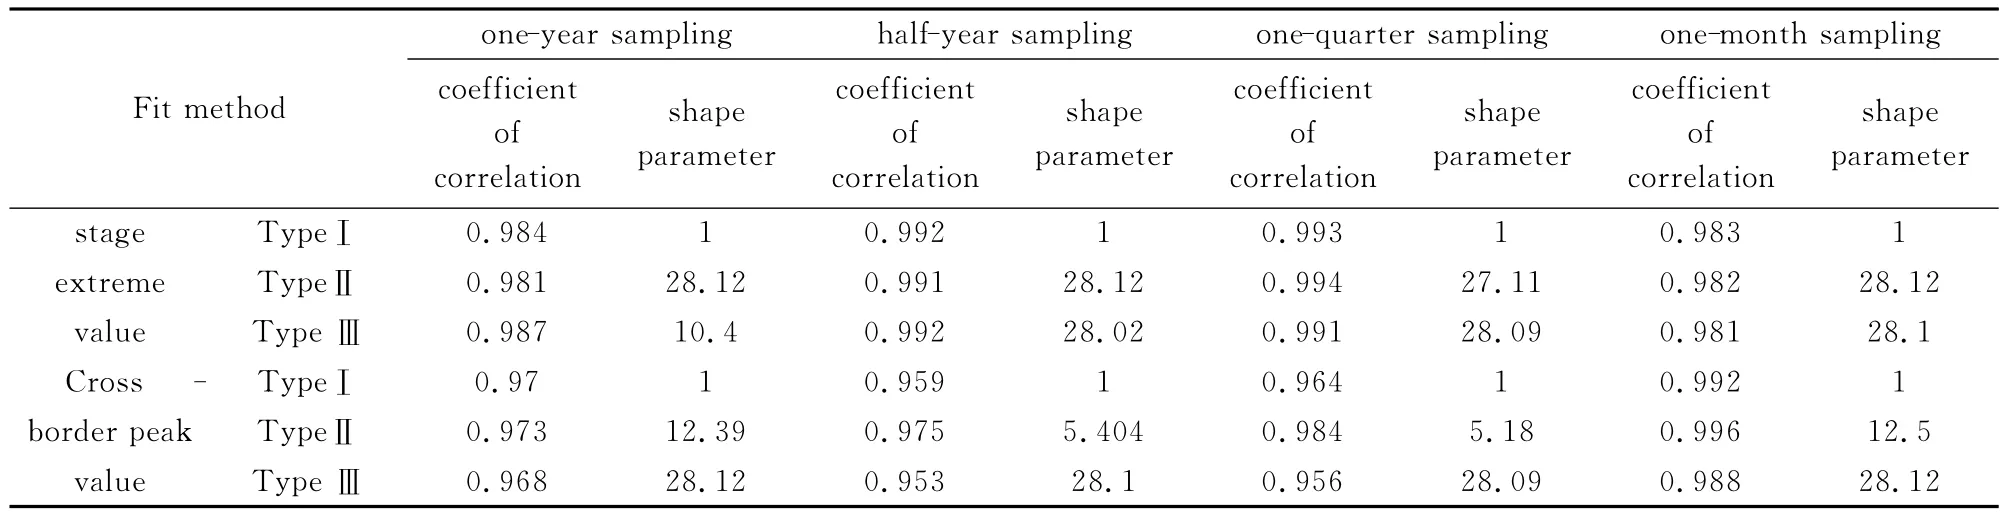
Table 4 Test results of different wind speed sampling methods at Longhai Meteorology Bureau
4 Parameter estimation of extreme value distribution
Based on the maximum likelihood principle,the maximum likelihood parameter estimation formula of three types of extreme value distribution can be derived as follows:
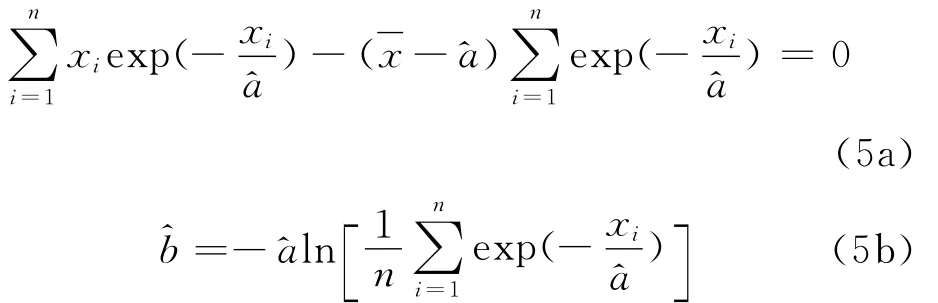
The maximum likelihood parameter estimation formula of Type I extreme value:
The maximum likelihood parameter estimation formula of Type II extreme value:

The maximum likelihood parameter estimation formula of Type III extreme value:
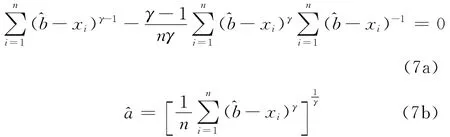
Type I extreme value can be directly parameters-estimated using equation(5);for TypeⅡ and III extreme values,the shape parametersγshould be first determined,and the values ofγshould satisfy the principle that the probability plot correlation coefficientγDis approximated(or is close to)to 1,and the bestvalue should makeγDavailable to the maximum value,that is,

If the annual maximum wind speed exceeds the average Tyearly occurrences of a strong wind,Tis called return period of wind speed.As the annual maximum wind speed is independent each other,the occurrence of x≥xNevents can be seen as the Bernoulli trials.Then when strong wind does not occur in the first n-1years,but occurs in the first nyears,the event's probability density function is:

The return period of wind speed Tis the expected value of N,so
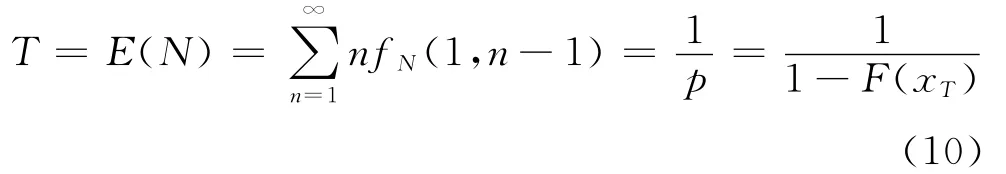
Equation(10)shows that for the extreme distribution function determined,any expected value xTof wind speed during the return period can be obtained.
This paper selects the maximum likelihood parameter estimation method with a high goodness of fit to establish the joint distribution type of wind speed and direction.However,in solving the extreme Type III parameters (in particular,the shape parameterγ),the estimation is more difficult;and sometimes it is difficult to find a stable solution.This paper uses the stepwise iterative estimation method,which can solve these problems well thereby proving the efficiency of maximum likelihood parameter estimation method showing the advantages of probability curve correlation coefficient factors used for a small number of samples.Also,the method overcomes the problems that when the maximum likelihood parameter estimation method is applied to extreme value distribution,it can not obtain the maximum likelihood estimation or the non-consistent estimation problems.
For reference to the bridge site mean wind test analysis results(Table 5),TypeⅡextreme values are sampled for each year,half year or Type I and Type III extreme value samples are sampled by smaller sampling by one month or one quarter to predict extreme wind speed at different return period.Table 4shows the basic parametersμxandσxas well as the distribution parameters a,b,γand the first N years expected wind speed,using the three types of extreme value distribution type calculation,respectively.
It is known that the maximum wind speed that occurred at Xiamen Professional Meteorological Observatory is 27.0m/s within 30years.Comparing the results in Table 6,one could find that in fitting the result by a one-year sampling,TypeⅡ extreme value 28.8m/s is the closest.So this report selects one-year sampling TypeⅡ extreme value fitting methods to estimate the N-year expected values;and thus the expected wind speed in a-hundred-year return period is reckoned to be 35.8m/s.Figure 3 shows the curves comparison between the bridge site's 10mhigh yearly sampling wind speed frequency distribution histogram and the fitting results of Type I extreme value.
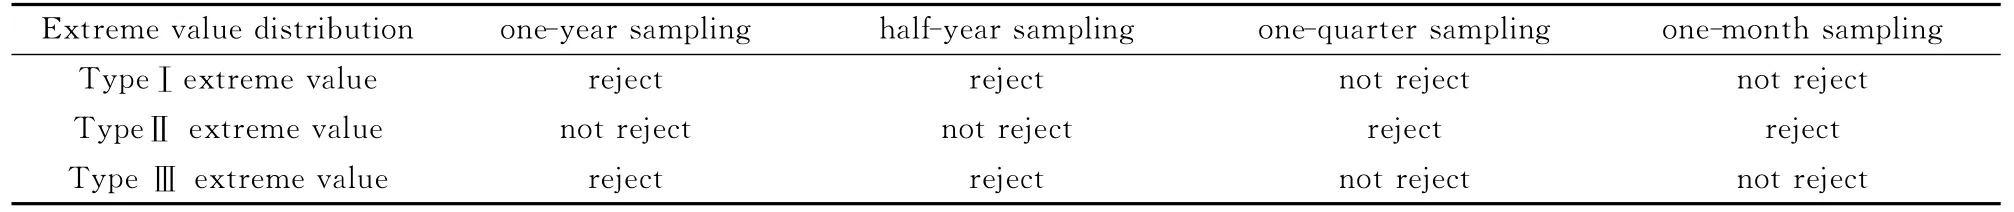
Table 5 Test conclusion of wind speed extreme value distribution at bridge site
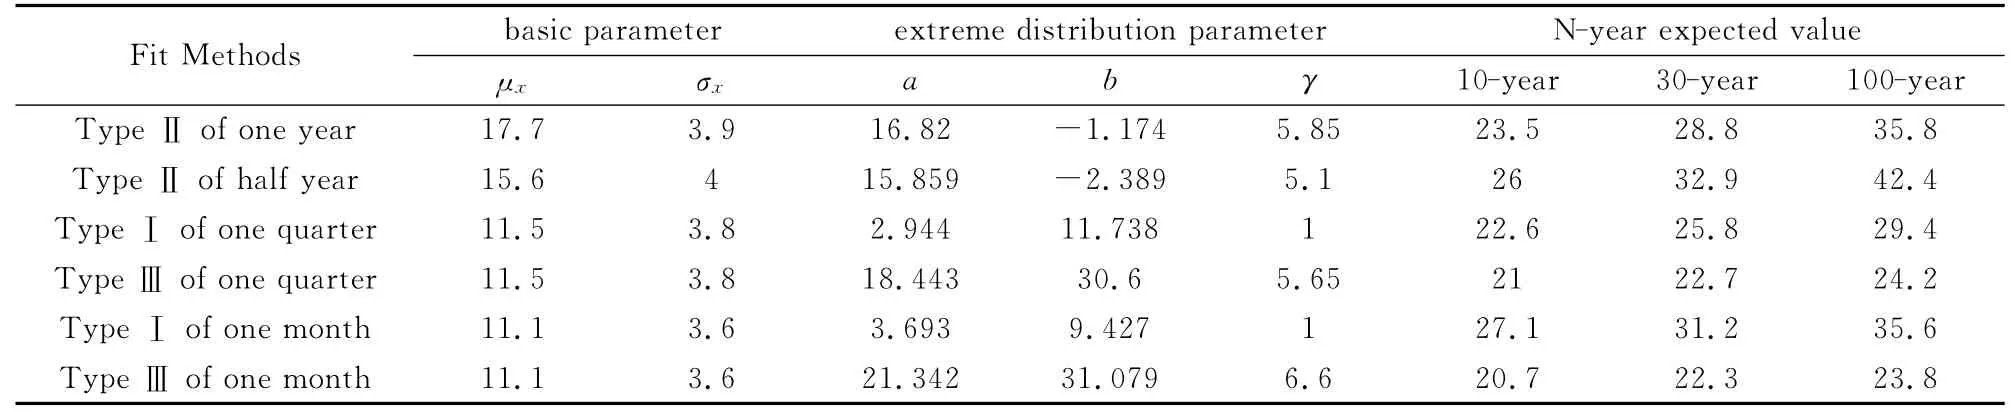
Table 6 Basic wind speed(m/s)10mhigh of Xiamen Professional Meteorological Observatory
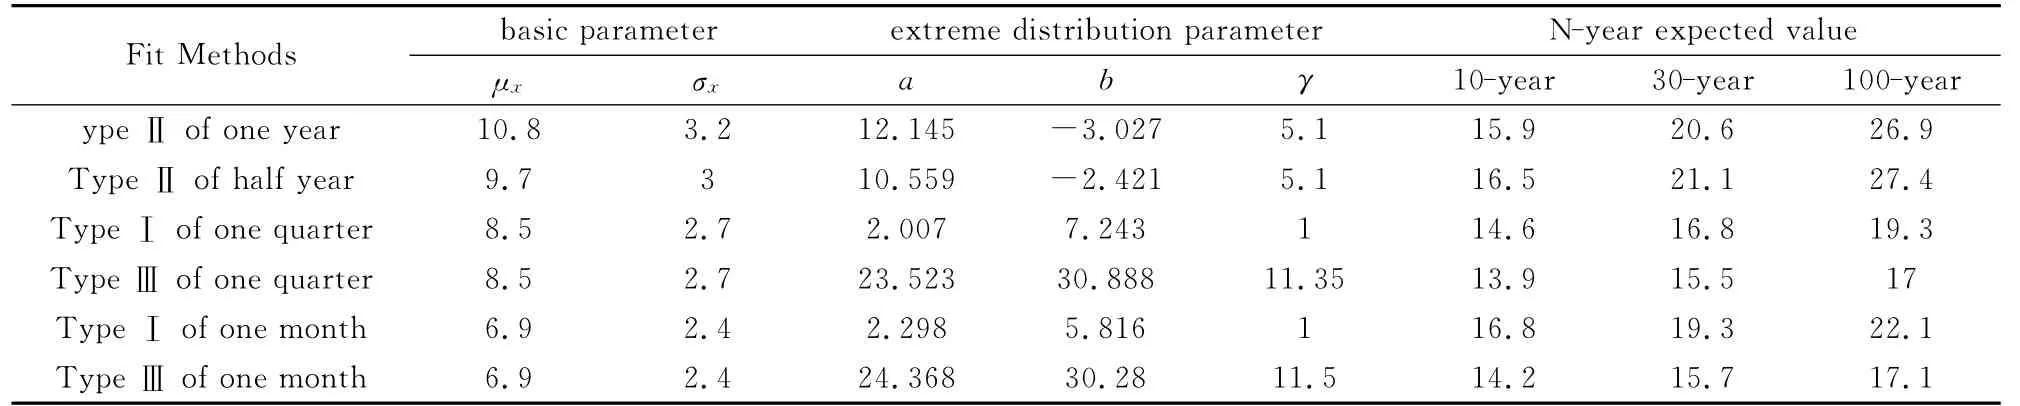
Table 7 Longhai City Bureau of Meteorology basic wind speed of 10meters height(m/s)
It is known that the maximum wind speed that occurred at Longhai Meteorology Bureau is 17.3m/s within 30years.Comparing the results in Table 7,one could find that in fitting the result by one-year sampling,Type I extreme value 16.8m/s is the closest.So this paper selects one-year sampling Type I extreme value fit methods to estimate the N-year expected values and thus the expected wind speed in a-hundred-year return period is reckoned to be 19.3 m/s.Figure 3depicts the curves comparison between the bridge site's 10mhigh quarterly sampling wind speed frequency distribution histogram and the fitting results of Type I extreme value.
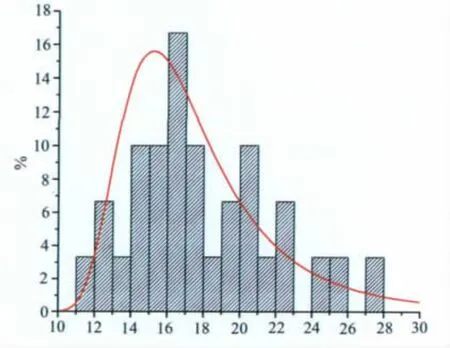
Fig.3 Curve comparisons between 10mhigh yearly sampling wind speed frequency distribution histogram and the fitting results at Xiamen Professional Meteorological Observatory图3 厦门市专业气象台10m高度年抽样风速分布频度直方图与拟合结果曲线比较
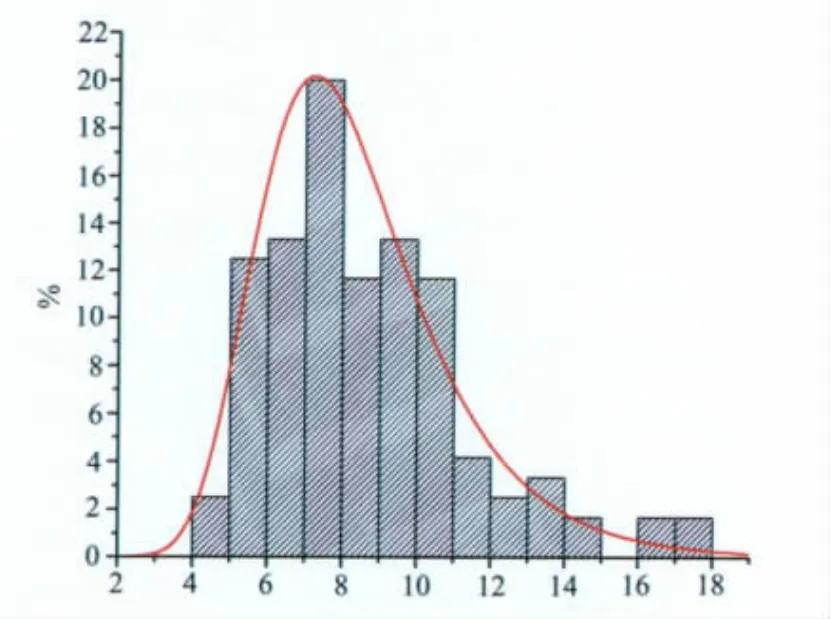
Fig.4 Curves comparison between 10mhigh quarterly sampling wind speed frequency distribution histogram and the fitting results at Longhai Meteorology Bureau图4 龙海市气象局10m高度季抽样风速分布频度直方图与拟合结果曲线比较
5 Conclusions
The above study suggests that the basic design wind speed of 39.7m/s in a-hundred-year return period,given in the“Wind-resistant Design Code for Highway Bridges ”(JTG/T D60-01-2004),is partially safe for this bridge design.At the same time,as the actual wind speed measured from Xiamen to Longhai decreases rapidly(this bridge site is located at the middle position between this two meteorological stations),the basic design wind speed of 39.7m/s adopted in this bridge design can fully meet the requirements of the bridge wind resistance.
[1]JTG/T D60-01-2004.Wind resistance design code for highway bridges[S],2004.
[2]WEN Y Q,CHEN Z H.Study on the estimation of design wind speed for Jingyue Yangtze River highway bridge[J].Journal of Wuhan University of Technology(Transportation Science & Engineering),2010,34(4):306-309.
[3]THOM C S.Distribution of extreme winds in the United States[J].Journal of the Structural Division,1960,86(ST4):11-24.
[4]SIMIU E,CHANGERY M J and FILLIBEN J J.Extremewind speeds at 129airport stations[J].Journal of the Structural Division,1980,106(ST4):809-817.
[5]SIMIU E,FILLIBEN J J.Probability distributions ofextreme wind speeds[J].Jounal of the Structural Division,1976,102(ST9):1861-1877.
[6]DUAN Z D,OU J P and ZHOU D.The optimal probabilisttc distribution for extreme wind speed[J].China Civil Engineering Journal,2002,35(5):11-16.
[7]Information on http://www.Google.com.hk.
Author biography:

LIU Hui(1977-),female,born in Jingzhou,Hubei province,PhD candidate;Research interest:Wind Engineering of Bridges;E-mail:lyzliuhui@126.com;Corresponding author:Zhang Liangliang,zll200510@126.com;Tel:023-65121987.
1672-9897(2011)04-0060-07
利用极值分布概型预测海峡地区风环境期望风速
刘 会1,2,张亮亮1,3,杨转运2,何 伟2
(1.重庆大学土木工程学院,重庆 400045;2.四川建筑职业技术学院,四川 德阳 618000;3.山地城镇建设与新技术教育部重点实验室(重庆大学),重庆 400045)
根据《公路桥梁抗风设计规范》,对于特别重要的桥梁要求对桥址处的设计基本风速进行重新观测或参考实测风速样本进行推算得到,选取合理的基本设计风速。本文选取厦门—漳州跨海大桥附近的厦门市专业气象台和龙海市气象局360个月的极值10分钟平均时距的风速和风向标准值,采用3种极值分布概型推算出不同重现期内的设计风速。得出了厦门海峡桥址处100年一遇的期望风速为35.8m/s,小于规范给出的厦门地区100年一遇基本设计风速39.7m/s。
极值分布概型;基本设计风速;厦门—漳州跨海大桥;海峡地区风环境
P425.5
A
date:2010-01-28;< class="emphasis_bold">Revised date
date:2011-03-18
National Natural Science Foundation of China(50778185)and Chongqing University of 211Project PhaseⅢ
猜你喜欢
中学生数理化·高一版(2021年3期)2021-06-09
中学生数理化·高一版(2021年3期)2021-06-09
——入侵植物响应人为扰动的适应性进化方向探究
发明与创新(2021年2期)2021-01-19
中学生数理化·高一版(2019年3期)2019-04-15
中学生数理化(高中版.高考数学)(2018年12期)2019-01-17
故事会(2017年21期)2017-11-08
妇女之友(2017年3期)2017-04-20
健康必读(2016年12期)2016-12-30
中学英语之友·上(2008年11期)2008-12-08