
Numerical research for contaminant release from un-suspended bottom sediment under different hydrodynamic conditions*
2013-06-01 12:29CHENGPengda程鹏达
水动力学研究与进展 B辑 2013年4期
CHENG Peng-da (程鹏达)
School of Mechatronical Engineering and Automation, Shanghai University, Shanghai 200072, China
Shanghai Institute of Applied Mathematics and Mechanics, Shanghai University, Shanghai 200072, China, E-mail: turbo_cheng@foxmail.com
ZHU Hong-wei(朱红伟), FAN Jing-yu (樊靖郁)
Shanghai Institute of Applied Mathematics and Mechanics, Shanghai University, Shanghai 200072, China FEI Min-rui (费敏锐)
School of Mechatronical Engineering and Automation, Shanghai University, Shanghai 200072, China
WANG Dao-zeng (王道增)
Shanghai Institute of Applied Mathematics and Mechanics, Shanghai University, Shanghai 200072, China
Numerical research for contaminant release from un-suspended bottom sediment under different hydrodynamic conditions*
CHENG Peng-da (程鹏达)
School of Mechatronical Engineering and Automation, Shanghai University, Shanghai 200072, China
Shanghai Institute of Applied Mathematics and Mechanics, Shanghai University, Shanghai 200072, China, E-mail: turbo_cheng@foxmail.com
ZHU Hong-wei(朱红伟), FAN Jing-yu (樊靖郁)
Shanghai Institute of Applied Mathematics and Mechanics, Shanghai University, Shanghai 200072, China FEI Min-rui (费敏锐)
School of Mechatronical Engineering and Automation, Shanghai University, Shanghai 200072, China
WANG Dao-zeng (王道增)
Shanghai Institute of Applied Mathematics and Mechanics, Shanghai University, Shanghai 200072, China
(Received December 8, 2012, Revised February 21, 2013)
Contaminant release from bottom sediments in rivers is one of the main problems to study the environmental hydrodynamics. Contaminant will release into the overlying water column under different hydrodynamic conditions through pore-water in sediment, the release mechanism can be roughly divided into convection diffusion, molecular diffusion and adsorption/desorption. In this article, phosphorus was as a typical contaminant with sorption. Through theoretical analysis of the contaminant release, according to different particle-sized and hydraulic conditions, the mathematics model of contaminant release can be established by the coupled Navier-Stokes equation, Darcy equation, solute transport equation and adsorption/desorption equation. Then that model was verified by flume experiment. Numerical studies show that, under different velocity, the instantaneous concentration of convection diffusion is about 6 times to 50 times larger than that of molecular diffusion during initial stages. The concentration of molecular diffusion is about 1 times to 4 times larger than to that of convection diffusion during late stages. Through analysis, the diffusive boundary layer near the interface can be obtained. In addition, the release will increase with particle size decreasing, and the release will be influenced much more by the size change when the particle size is relatively big under different velocity.
sediment, contaminant, instantaneous release, coupling, adsorption/desorption
Introduction
The complex exchange processes of substances like nutrients, POPs, heavy metals and other potentially harmful materials between the contaminated sediments and the overlying water column in rivers, lakes, reservoirs, and estuaries are of considerable importance in understanding the impacts of the contaminated sediments on the aquatic environment[1-3]. It is well known that the transport process across the sediment-water interface in the case of the static release is dominated by the direct diffusive process, and there exists a diffusive boundary layer within which the mass transfer of the contaminants occurs largely due to the molecular diffusion or convective diffusion[4,5]. The faster flow velocity of overlying water-body will cause the more powerful shear force near the interface, which influences the thickness of diffusive boundary layer near the interface. The convective diffusion would exist in the diffusive boundary layer. Most experimental studies in recent years have focused on static release[6,7]. Laboratory experiments such as osci-llating grid[8], annular tank and open water channel have been conducted to study the contaminated sediment release regularity under conditions of flowing water. By using the annular tank test, the law of sediment suspension and release were simulated by different disturbance forces[9]. Considering that the natural sediments are composed of different particle-sized components, and it is significant to characterize the size-specific contaminant adsorption/desorption behavior, which is essential for estimating the adsorption/ desorption of the natural sediments by the linear additivity assumption with respect to their size fractions[10]. In this article, phosphorus is a typical sorption of contaminant, and the phosphorus adsorption isotherms and artificial sediment samples are firstly examined for different particle-sized sediment in the experiment. According to different particle-sized and hydraulic conditions, the coupled mathematical model of contaminant release can be established by Navier-Stokes equation, Darcy equation, solute transport equation and adsorption/desorption equation. The release mechanism can be divided into convection diffusion, molecular diffusion and adsorption/desorption. The contaminant release features from the porous sediment layer are then investigated under different flow conditions.
1. The sorption experiment of different particlesized sediment
In general, the contaminant adsorption/desorption characteristics of the sediments depends on numerous interacting physical, biochemical and environmental factors, among which the physical properties of the sediments are the main influencing factors under consideration in this article. For the adsorptive contaminants, the adsorption/desorption behaviors of the bottom sediments play an important role in the transport process across the sediment-water interface, and the physical properties of the porous sediment layer may be particularly pronounced for the mass transfer across the diffusive boundary layer[11,12]. In this regard, the sediment size is an important property that affects the contaminant adsorption and desorption.
The adsorption/desorption isotherms for different particle-sized sediment are the fundamental properties that greatly affect the sediment-associated contaminant transport process. In the present adsorption experiment, the artificial sediments samples were prepared and sieved into three size fractions with the particle sizes of1D (0.0001 m-0.0002 m),2D (0.00005 m-0.0001 m),3D (<0.00005 m), and the phosphorus adsorption isotherms for sediment were measured and obtained at specific initial aqueous concentrations C0
[13,14]. The obtained experiment data in terms of the adsorption quantity and the aqueous equilibrium concentration for all cases fit well with the Langmuir equation, results are shown in Table 1. K is the adsorption coefficient, which increases with particle-sized increasing. S is the maximum sorption, which increases with particle-sized decrease. The sorption of 3D is 2.7 times larger than that of2D and 3 times larger than that of1D.

Table 1 The fitting parameters for Langmuir adsorption isotherms
2. The coupled model of contaminant transport
It is well known that the shear force exists in the sediment-water interface under different water flow velocity, which can promote the contaminant release. The shear force changes with variable velocity, meanwhile the seepage field changes with that shear force, the concentration field changes with that seepage field and water flow. Moreover, the contaminant adsorption/desorption can also influence the concentration field[15]. Therefore, according to the characteristics of water flow, seepage, solution transport and adsorption/desorption, the coupled model can be established for the process of contaminant release, it has certain practical significance for the controlling of contaminant release.
2.1 The coupled model of contaminant release
(1) Contaminant transport equation
Considering the adsorption of sediment, the transport equation can be expressed as following

where θ is porosity, C is concentration in,bρ,pc is concentration of desorption from sediment, D is diffusion coefficient,LD is the diffusion coefficient of Y direction (DL=αLv+Dd), DTis the diffusion coefficient of X direction (DT=αTu+Dd), αLis the dispersivity of Y direction and Tα is the dispersivity of X direction. dD is the coefficient of molecular diffusion.
In general, the contaminant adsorption/desorption characteristics of the sediments are according with Langmuir equation as following

where K is sorption coefficient, s is maximum sorption.
(2) Darcy equation

wheredrU is velocity of Darcy, ρ is density of fluid, κ is permeability, μ is the viscosity of fluid.
(3) Navier-Stokes equation
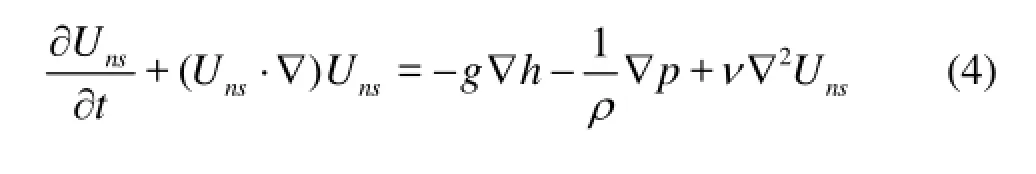
wherensU is velocity of overlying water flow, p is pressure.
Based on Variation principle and Galerkin method, the discretization equations of coupled model could be obtained.
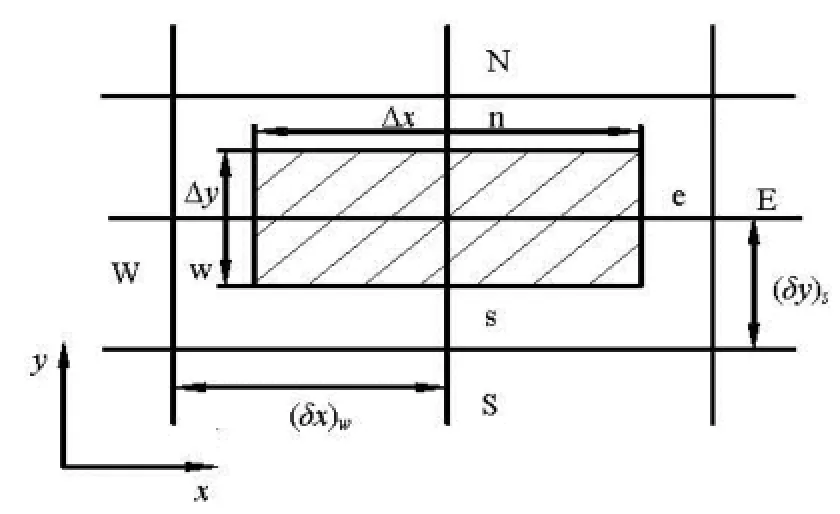
Fig.1 The unit of control body
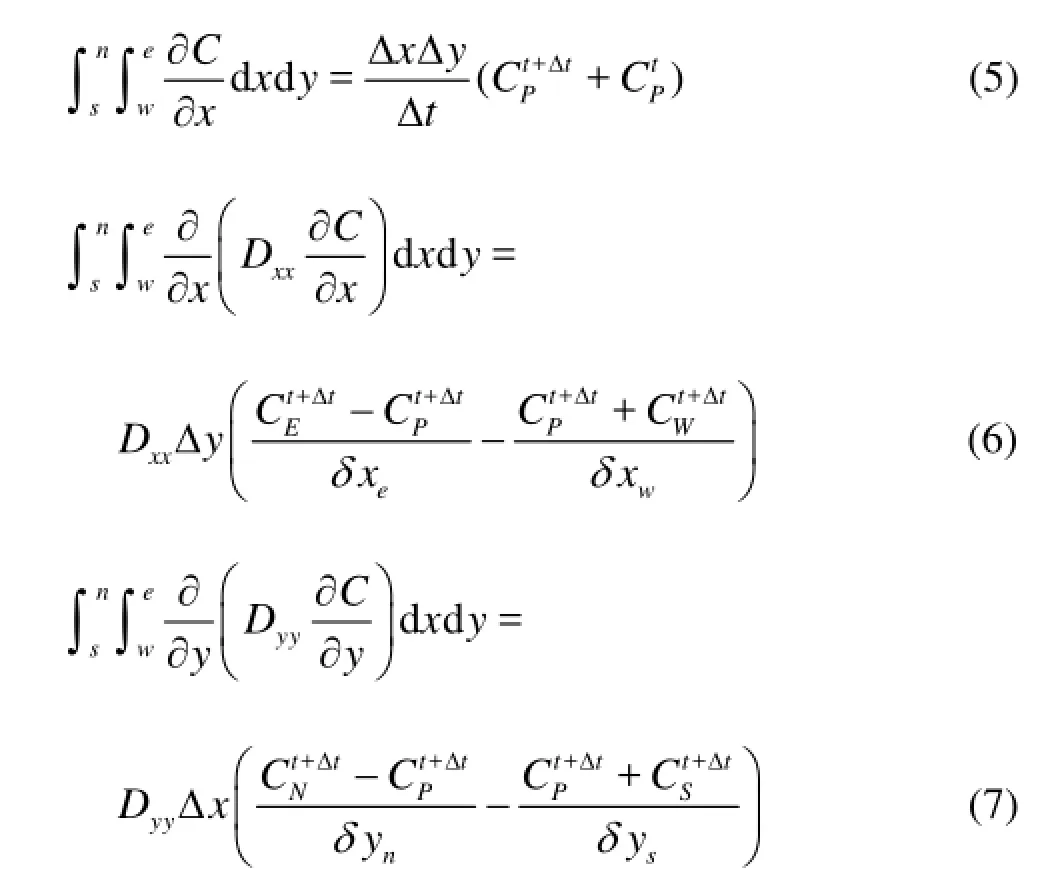
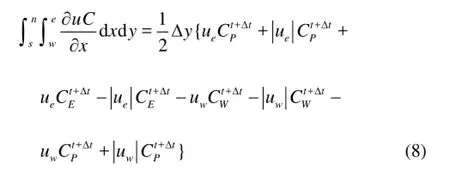
As shown in Fig.1, the continuity equation, diffusion equation and convection equation can be expressed as Eqs.(5)-(8).
2.2 Geometrical model, boundary conditions and initial conditions
In order to analyze the solute transfer process from sediment to water and the different influence of the various mechanism in release, the coupled model should be established. The numerical simulation not only can obtain the accuracy results, but also can reproduce the process of the contaminant release.

Fig.2 The geometrical model
Because of the uniformity of contaminant release along the width of flume, the 2-D geometric model will be built to simulate the process of release near interface. The 2-D geometric model is shown in Fig.2, water flow is above the sediment, the thickness of overlying water layer is 0.04 m. Sediment is below the interface, the thickness of sediment is 0.08 m. The length of geometric model is 0.30 m.
Initial conditions:
According experiment results, the simulation parameters are shown in Table 2.

Table 2 The parameters of simulation
The coefficient of molecular diffusion (Dd) is 2.3×10⁻⁵m2/s, αLis 0.005 m, αTis 0.001 m. Tortuosity factor is 0.7. Initial concentration of sediment is C0.
Boundary conditions:
(1) Boundary conditions of Darcy: 2 and 4 are open boundary in the Figs.2, 3 is wall.
(2) Boundary conditions of Navier-Stokes: 1 in the Fig.2 is inlet, velocity is 0, 0.01, 0.05 and 0.1. 2 is outlet, pressure is 0.6 is symmetry boundary.
(3) Boundary conditions of concentration transport: 2, 3 and 4 are concentration boundary in the Fig.2, concentration is 0, 1, 5 and 6 are symmetry boundary.
(4) Interface is 7 in the Fig.2, Uns=Udr, Pns= Pdr.
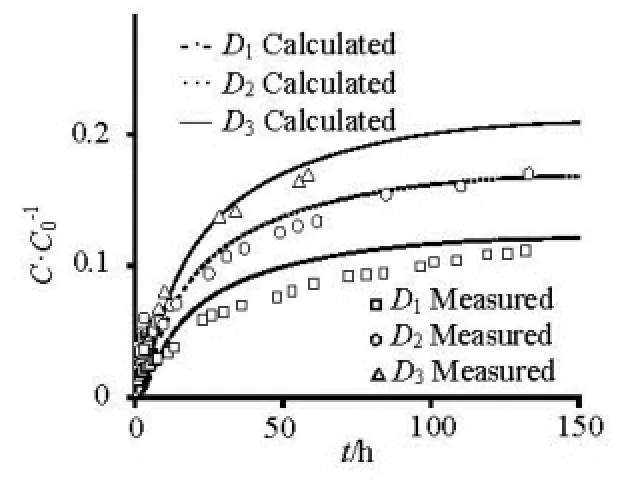
Fig.3 The release of different particle-sized sediment
2.3 Results
As shown in Fig.3, The contaminant concentration from a static sediment layer into the overlying water column under quiescent condition changes abruptly adjacent to sediment-water interface in an initial release stage and tends to more and more uniform in an equilibrium stage. The dimensionless concentration (C/C0) of the overlying water column increases with time increase, and rises with particle-sized decrease. Because of the larger particle size of1D, the contaminant concentration of adsorption/desorption is very small, there has little deviation between the calculation results and the experiment results. The calculation results are mainly close to experiment results, which verify the rationality of the coupled model. For particulate contaminants, only the uppermost sediments can desorb the contaminants directly into the overlying water column, and the subsurface sediments may desorb the contaminants into the pore-water within the porous sediment layer. Therefore, the dissolved contaminants in the pore-water involving the initial part and the subsurface sediment desorption part may exert more pronounced effect on the concentration variation of the overlying water column via the diffusion within the porous sediment layer, which is a relatively slow diffusive process gauged by the particlesized, and thus this contribution to the interfacial diffusion is dominated mainly in the posterior release stage.
In this case, the contaminant concentration variation of the overlying water column is directly related to the supply of the contaminants from the sediment, including the direct desorption from the uppermost sediments and the molecular diffusion from the porewater within the underlying sediment layer. In order to analyze the release process near the interface, the concentration and flux will be selected at location h1, h2and h3, h1is 0.01 m below the interface, h2is 0.03 m below the interface, 3h is 0.05 m below the interface respectively. As shown in Figs.4-5, the release flux reaches peak in 12 h at1h, then the flux decreases with time increase. The release flux increases with time increase at2h and3h. In the initial part of release, the contaminant release is mainly via the molecular diffusion and the desorption from1h, the release flux reaches the peak in short time, and the flux of1h is 10 times to 100 times larger than that of2h and3h. In the posterior release stage, the flux of1h decreases with time, the flux of2h and3h increase with time, the contaminant release is mainly via the molecular diffusion from3h to1h. Finally, the flux of1h,2h and3h are close to each other, then the concentration profile tends to more and more uniform in an equilibrium stage.

Fig.4 The concentration in1D sediment

Fig.5 The porous release flux in1D sediment
As shown in Fig.6, the adsorption rate decreases with time. In the initial part of release, the adsorption rate decreases rapidly in 24 h at1h, the reducing speed is 10 times-100 times larger than that of2h and h3. The variation of adsorption rate of D2and D3has same trend as that of1D. As shown in Fig.7, the release flux reaches peak in 12 h at1h under differentparticle-sized, then that decreases with time. In the posterior release stage, the release flux increases with particle-sized reduced, and that is obviously influenced by particle-sized. The sorption capacity of sediment impacts the adsorbing/desorbing concentration. Because of the low capacity of sorption in experiment sediment, the concentration of' adsorbing/desorbing is relatively low. So the release of contamination is mainly by the molecular diffusion near the interface in this experiment.

Fig.6 The adsorption rate in1D

Fig.7 The porous release flux at1h
The velocity will cause the shear force near the interface, and the shear force will improve the contamination release from sediment layer to overlying water column. Variable shear force will bring different flow in sediment layer, then the flow will impact the release, and the adsorption/desorption will be influenced by flow during that process. In order to research the contaminant release under different water flow velocity, the coupled model will be calculated under1=V0.01 m/s,2=V0.05 m/s and3=V 0.10 m/s respectively.
As shown in Fig.8, the interface between sediment and water is 0 position of the -Xaxis, the flow velocity decreases with depth increase under the different flow conditions, and the velocity gradient is larger near interface. The velocity rises with particlesized reduced at same location, and the changing trend of velocity of2D and3D is same as that of1D.The shear force near interface is influenced by the flow velocity of overlying water column, that rises 5 times when the velocity of overlying water doubled under the velocity relatively low. That rises 2 times when the velocity of overlying water doubled under the velocity relatively high. The velocity near interface will be influenced much more by the flow change when the velocity is relatively low in overlying water column.
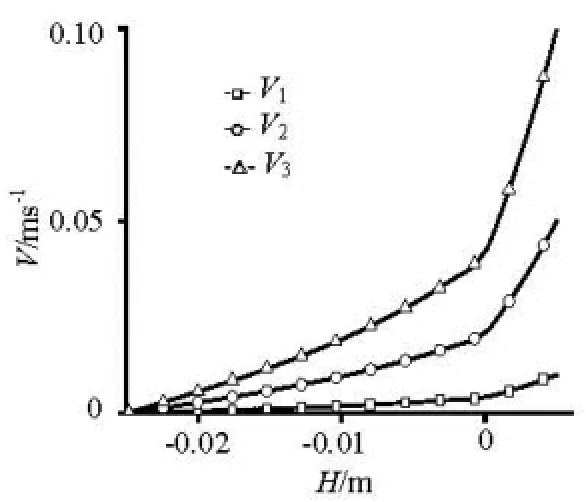
Fig.8 The velocity changing with depth in1D

Fig.9 The adsorption rate changing with time at1h in1D
As shown in Fig.9, The adsorption rate decreases rapidly with time in initial under high velocity. The adsorption rate decreases slowly with time in initial under low velocity. The high velocity will cause the powerful shear force near the interface, meanwhile it will also influence the concentration gradient near the interface. The desorption increases with the concentration gradient increase, it has much more influence to the contaminant release under high velocity. The changing trend of adsorption/desorption of2D and3D is same as that of1D. Because of the low sorption capacity of experiment sediment, the concentration of desorption is always very small under different velocity, different particle-sized and different initial concentration. Thus, the release of contaminant is mainly by convection diffusion and molecular diffusion in experiment.
As shown in Fig.10, the velocity greatly influences the instantaneous concentration of release. The concentration of1h is going down after 20 min and reaches the balance concentration in 90 min under low velocity. The concentration of1h decreases rapidlyat the beginning and reaches the balance concentration in 30 min under high velocity. Convection diffusion and molecular diffusion influence the concentration release respectively. Under low velocity, the concentration of convection diffusion is 6 times larger than that of molecular diffusion in 90 min, and the convection diffusion is a quarter of the molecular diffusion after 120 h. Under high velocity, the concentration of convection diffusion is 10 times larger than that of molecular diffusion in 30 min, and the convection diffusion is close to the molecular diffusion after 120 h. The release of contaminant is mainly by the convection diffusion in initial stage under different velocity. The molecular diffusion dominates the release of contaminant in later period under low velocity. Then the influence of particle-sized is analyzed under lower velocity, which mainly affects the molecular diffusion. The influence of diffusive boundary layer is analyzed under higher velocity, which mainly is affected the convection diffusion.

Fig.10 The concentration changing with velocity at1h in1D
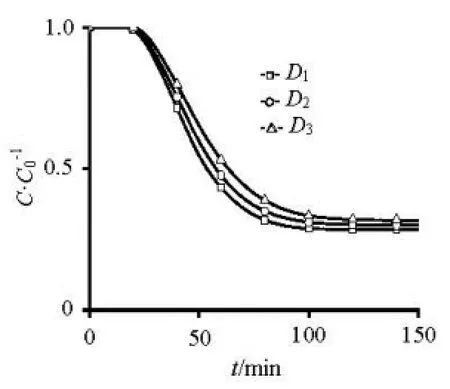
Fig.11 The concentration changing with time at1h under 0.01 m/s
As shown in Fig.11, the location of1h is 0.01 m below the interface, the concentration of1h decreases with time. At same time, the concentration rises with particle-sized decrease. When the particle-sized1()D is relatively larger, the concentration increases 70% when particle-sized reduced half. When the particlesized3()D is relatively small, the concentration only increases 10% when particle-sized reduced half. The concentration of release from un-suspended bottom sediment will be influenced much more by the size change when the particle size is relatively big under low velocity.

Fig.12 The concentration changing with depth in1D under 0.1 m/s
It is well known that the transport process across the sediment-water interface in the case of the static release is dominated by the direct diffusive process, and there exists a diffusive boundary layer within which the mass transfer of the contaminants occurs largely due to the molecular diffusion or convective diffusion. As shown in Fig.12, the release is mainly via convection diffusion under high velocity. The diffusive boundary layer below interface plays an important role during the release. The concentration increases with the depth increasing under same velocity and particle sized. The concentration decreases with time and finally reaches the balance concentration at same location below interface. The location1h is 0.01 m below the interface,2h is 0.03 m below the interface and 3h is 0.05 m below the interface respectively. The balance concentration of3h is 1.5 times higher than that of2h and 27 times higher than that of1h. The larger concentration gradient exists in the diffusive boundary layer under strong shear force. Further analysis shows that the contaminant release is mainly via the molecular diffusion from the bottom about to3h and via the convection diffusion from the3h to the interface, the thickness of diffusive boundary layer is about 0.03 m-0.05 m below the interface under high velocity in the experiment. That has important significance for the project of contaminant control.
Comparing the results of the flume experiment and the numerical simulation, the flow of overlying water will improve diffusion from sediment to water by shear force. The faster flow velocity of overlying water will cause the more powerful shear force near the interface. The shear force will enhance concentration gradient between water and sediment, furthermore it also will cause the seepage flow in sediment, and thus the contaminant release will be improved.
3. Conclusions
Based on the verified coupling model, the characteristics of contaminant release from un-suspended bottom sediments to overlying water were investigated under different flow velocity and particle-sized conditions. Conclusions can be summarized as follows:
(1) The porosity and adsorption/desorption of the sediment were analyzed for different particle-sized. In general, the porosity increases with particle-sized decrease. The obtained experiment data in terms of the adsorption quantity and the aqueous equilibrium concentration for all cases fit well with the Langmuir equation. The maximum sorption quantity increases with particle-sized reducing. The sorption of the sediment particle diameter3D is 2.7 times larger than that of 2D and 3 times larger than that of 1D respectively.
(2) Because of the flow of overlying water body, the shear force exists near the interface between sediment and water, and it can promote the contaminant release. The shear force changes with the water flow, meanwhile the seepage field is affected by different shear force, and then the concentration field is transformed. Moreover, the adsorption/desorption of the sediment also influences the concentration field during contaminant release. Therefore, according to the characteristics of water flow, seepage, solute transport and adsorption/desorption, a coupled mathematical model should be established for contaminant release, and then the model was verified by water channel experiment. The calculation results are close to experiment results, which can verify the rationality of the coupled model.
(3) Without overlying water flow, the contaminant release is mainly via the molecular diffusion and the desorption in the initial part, the release flux reaches the peak in short time, and the flux of1h is 10 to 100 times larger than that of2h and 3h. In the posterior release stage, the flux of h1decreases with time, the flux of2h and3h increase with time. Finally, the flux of1h,2h and3h are close to each other, then the concentration profile tends to more and more uniform in an equilibrium stage, the contaminant release is mainly via the molecular diffusion from the range near bottom to1h.
(4) Under low velocity1()V, the concentration of convection diffusion is 6 times larger than that of molecular diffusion in 90 min near the interface, and the concentration of convection diffusion is a quarter of that of molecular diffusion after 120 h at same location, the contaminant release is mainly via the molecular diffusion from the range near bottom to1h. Under high velocity 3()V, the concentration of convection diffusion is 10 times larger than that of molecular diffusion in 30 min near the interface, and the concentration of convection diffusion is close to that of molecular diffusion after 120 h at same location, the contaminant release is mainly via the molecular diffusion from the range near bottom to3h and via the convection diffusion from the 3h to interface. The thickness of diffusive boundary is 0.03 m-0.05 m below the interface under higher velocity in experiment of static sediment. Because of large concentration gradient, the diffusive boundary plays very important role during the process of contaminant release, and the thickness of diffusive boundary has important significance for the environmental project of contaminant control.
(5) The concentration of contaminant increases with the particle-sized of sediment decrease. When the particle-sized1()D is relatively larger, that will increase 70% when particle-sized reduced half. When the particle-sized3()D is relatively small, that will only increase 10% when particle-sized reduced half. The concentration of contaminant release from unsuspended bottom sediment will be influenced much more by the size change when the particle size is relatively big under different water flow velocity.
[1] SCHINDLER D. W., HECKY R. E. Eutrophication: More nitrogen data needed[J]. Science, 2009, 324(5928): 721-722.
[2] SUNDARESHWAR P. V., MORRIS J. T. and KOEPFLER E. K. et al. Phosphorus limitation of coastal ecosystem processes[J]. Science, 2003, 299(5606): 563-565.
[3] KIM L. H., CHOI E. and STENSTROM M. K. Sediment characteristics, phosphorus types and phosphorus release rates between river and lake sediments[J]. Chemosphere, 2003, 50(1): 53-61.
[4] FRIES J. S. Predicting interfacial diffusion coefficients for fluxes across the sediment-water interface[J]. Journal of Hydraulic Engineering, ASCE, 2007, 133(3): 267-272.
[5] LI Bin, ZHANG Kun and WANG Dao-zeng. An experimental study on release of pollutants from sediment under hydrodynamic conditions[J]. Chinese Journal of Hydrodynamics, 2008, 23(2): 126-133(in Chinese).
[6] HIGASHINO M., GANTZER C. J. and STENFAN H. G. Unsteady diffusional mass transfer at the sediment/ water interface: Theory and significance for SOD measurement[J]. Water Research, 2004, 38(1): 1-12.
[7] KALNEJAIS L. H., MARTIN W. R. and SIGNALL R. P. The release of dissolved nutrients and metals from coastal sediments due to resuspension[J]. Marine Chemistry, 2010, 121(1-4): 224-235
[8] ORLINS J. J., GULLIVER J. S. Turbulence quantifica
tion and sediment resuspension in an oscillating grid chamber[J]. Experiments in Fluids, 2003, 34(6): 662-677.
[9] LI Yi-ping, PENG Yong and LI Yong. Re-suspended flux of sediment in Taihu Lake under hydrodynamic action[J]. Journal of Hydraulic Engineering, 2007, 38(5): 558-564(in Chinese).
[10] ZHANG Kun, LI Bin and WANG Dao-zeng. Contaminant (CODCr) release from river bottom sediments under flow conditions[J]. Acta Scientiae Circumstantiae, 2010, 30(5): 985-989(in Chinese).
[11] FENG Z. G., MICHAELIDES E. E. Secondary flow within a river bed and contaminant transport[J]. Environmentai Fluid Mechanics, 2009, 9(6): 617-634.
[12] CARDENAS M. B., WILSON J. L. Hydrodynamics of coupled flow above and below a sediment-water interface with triangular bedforms[J]. Advances Water Resources, 2007, 30(3): 301-313.
[13] JIN G., TANG H. and GIBBES B. et al. Transport of nonsorbing solutes in a streambed with periodic bedforms[J]. Advances in Water Resources, 2010, 33(11): 1402-1416.
[14] FAN Jing-yu, WANG Dao-zeng and ZHANG Kun. Experimental study on a dynamic contaminant release into overlying water-body across sediment-water interface[J]. Journal of Hydrodynamics, 2010, 22(5Suppl.): 343-346.
[15] CHENG Peng-da, LI Lu and TANG Jun et al. The application of time-varying viscous grout in gravel-layer anti-seepage treatment[J]. Journal of Hydrodynamics, 2011, 23(3): 391-397.
10.1016/S1001-6058(11)60404-7
* Project supported by the National Natural Science Foundation of China (Grant No. 10972134), the National Key Program of National Natural Science Foundation of China (Grant No. 11032007) and the Shanghai Program for Innovative Research Team in Universities.
Biography: CHENG Peng-da (1983-), Male, Ph. D.
WANG Dao-zeng, E-mail: dzwang@staff.shu.edu.cn
猜你喜欢
江苏科技报·E教中国(2022年5期)2022-05-11
今日农业(2021年7期)2021-07-28
邯郸学院学报(2020年2期)2020-08-11
青年生活(2020年27期)2020-07-30
扬子江(2019年1期)2019-03-08
中小学实验与装备(2018年5期)2018-10-31
现代营销(创富信息版)(2018年3期)2018-03-15
古代文明(2016年2期)2016-04-26
第二课堂(课外活动版)(2015年8期)2015-10-21
水动力学研究与进展 B辑(2014年6期)2014-06-01

- 水动力学研究与进展 B辑的其它文章
- Ship bow waves*
- Progress in numerical simulation of cavitating water jets*
- Three-dimensional large eddy simulation and vorticity analysis of unsteady cavitating flow around a twisted hydrofoil*
- Numerical simulation of shallow-water flooding using a two-dimensional finite volume model*
- Dynamical analysis of high-pressure supercritical carbon dioxide jet in well drilling*
- Micropaticle transport and deposition from electrokinetic microflow in a 90obend*