
ActiGraph GT3X determined variations in“free-living”standing, lying,and sitting duration among sedentary adults
2013-06-21 12:53FislBrwisThomsCuddihyJeromeRcheleTrcyWshington
Fisl A.Brwis,Thoms F.Cuddihy,Jerome N.Rchele,Trcy L.Wshington
aSchool of Exercise and Nutrition Sciences,Institute of Health and Biomedical Innovation,Queensland University of Technology,Brisbane 4059, Queensland,Australia
bDepartment of Physical Education and Sports,Umm Al-Qura University,Makkah 21421,Saudi Arabia
ActiGraph GT3X determined variations in“free-living”standing, lying,and sitting duration among sedentary adults
Faisal A.Barwaisa,b,*,Thomas F.Cuddihya,Jerome N.Rachelea,Tracy L.Washingtona
aSchool of Exercise and Nutrition Sciences,Institute of Health and Biomedical Innovation,Queensland University of Technology,Brisbane 4059, Queensland,Australia
bDepartment of Physical Education and Sports,Umm Al-Qura University,Makkah 21421,Saudi Arabia
Background:Overweight and obesity has become a serious public health problem in many parts of the world.Studies suggest that making small changes in daily activity levels such as“breaking-up”sedentary time(i.e.,standing)may help mitigate the health risks of sedentary behavior. The aim of the present study was to examine time spent in standing(determined by count threshold),lying,and sitting postures(determined by inclinometer function)via the ActiGraph GT3X among sedentary adults with differing weight status based on body mass index(BMI) categories.
Methods:Participants included 22 sedentary adults(14 men,8 women;mean age 26.5±4.1 years).All subjects completed the self-report International Physical Activity Questionnaire to determine time spent sitting over the previous 7 days.Participants were included if they spent seven or more hours sitting per day.Postures were determined with the ActiGraph GT3X inclinometer function.Participants were instructed to wear the accelerometer for 7 consecutive days(24 h a day).BMI was categorized as:18.5 to<25 kg/m2as normal,25 to<30 kg/m2as overweight,and≥30 kg/m2as obese.
Results:Participants in the normal weight(n=10)and overweight(n=6)groups spent significantly more time standing(after adjustment for moderate-to-vigorous intensity physical activity and wear-time)(6.7 h and 7.3 h respectively)and less time sitting(7.1 h and 6.9 h respectively) than those in obese(n=6)categories(5.5 h and 8.0 h respectively)after adjustment for wear-time(p<0.001).There were no significant differences in standing and sitting time between normal weight and overweight groups(p=0.051 and p=0.670 respectively).Differences were not significant among groups for lying time(p=0.55).
Conclusion:This study described postural allocations standing,lying,and sitting among normal weight,overweight,and obese sedentary adults. The results provide additional evidence for the use of increasing standing time in obesity prevention strategies.
Copyright©2013,Shanghai University of Sport.Production and hosting by Elsevier B.V.All rights reserved.
Anatomical position;Inclinometer function;Obesity;Overweight;Sedentary behavior
1.Introduction
In recent decades,overweight and obesity has become a serious public health problem in many parts of the world.1The prevalence of obesity,as defined by body mass index (BMI)has increased dramatically worldwide.2—5BMI,which is based on the relationship between height and weight,is the most frequently used predictor for classifications of overweight(BMI=25.0—29.9)and obesity(BMI=30 orhigher).6According to the World Health Organization(WHO), approximately 1.5 billion adults of 20 years or older worldwide were classified as overweight,with approximately 500 million of these classified as obese.7The rapidly rising rates of overweight and obesity have led to an increase in health risk factors for chronic diseases,including type II diabetes,cardiovascular diseases,various cancers and other health problems,all of which can lead to further morbidity and mortality.8Due to a modern lifestyle that is characterized by spending large periods of the day in low level energy pursuits,recent epidemiological and descriptive studies have examined the associations between weight-related health risk and sedentary behavior status.9,10Sedentary behavior is defined as any waking behavior characterized by an energy expenditure≤1.5 METs while in a sitting or reclining posture.11Lightintensity physical activities(PAs)such as slow walking, washing dishes,cooking food,and other routine domestic or occupational tasks,involve low levels of energy expenditure.12In general,sedentary behavior and light-intensity PA behaviors have become increasingly common in adults at home,at work,and during their leisure time.13,14There is substantial evidence showing that adults spend most of their waking hours either in sedentary or in light-intensity PAs.In a recent position statement on PA and exercise intensity terminology15a typical human 24 h cycle was noted to consist of 7.5 h sleeping,9.4 h in sedentary behaviors(“time spent sitting”), 6.5 h in light-intensity activities and approximately 43 min of moderate or vigorous PA.Although activities of daily living are generally of light intensity,the cumulative effect of these activities has been shown to result in substantial increases in total daily energy expenditure.16—18Several studies have focused on increasing energy expenditure through increasing non-exercise activity thermogenesis(NEAT).16,18NEAT is comprised of low energy expenditure of daily activities such as standing,walking,sitting,and fidgeting,all of which are activities that are not considered planned PA in a person’s daily life.19Changing one’s postural position from seated to standing or engaging in light ambulation has been shown to significantly increase energy expenditure.19
Incidence of overweight and obesity are related to a sedentary lifestyle and lack of PA.Given this relationship, there is an increased need to quantify sedentary behaviors.20Total time spent in sedentary behaviors can be captured by objective monitoring devices,such as accelerometers and inclinometers.21Accelerometers can quantify sedentary behavior via the amount of time spent below a pre-defined intensity threshold,22whereas inclinometers can quantify time spent in different postures by distinguishing between lying,sitting,and standing.21Nevertheless,investigators have begun to classify standing differently to sitting when defining sedentary time.9Through the use of an inclinometer function, accelerometers now have the ability to measure the position of the lower body,whereby standing can be treated as a separate activity which is classified as a light activity.23Devices have been developed which contain both accelerometer and inclinometer functions and have been used to report postures in previous research.19,24,25To date,no studies have examined postures using the ActiGraph GT3X26inclinometer during free-living activities.The objective of this study was to examine timespentin standing (determined by count threshold),lying,and sitting postures(determined by inclinometer function)via the ActiGraph GT3X among sedentary adults with differing weight status based on BMI categories.It was hypothesized that obese participants would spend less time standing and more time sitting when compared to normal weight or overweight participants.
2.Materials and methods
2.1.Participants
Twenty-five adults were recruited through newsletter advertisements and flyers placed within buildings at a metropolitan university in Brisbane,Australia.Participants were required to meet the following inclusion criteria:(a)18—45 years of age;(b)sitting for more than 7 h per day,as mandated by the International Physical Activity Questionnaire(IPAQ), short version;27and(c)the ability and willingness to wear accelerometers for a period of 7 days(weekday/weekend) during free-living activities and sleeping.A total of 22(88%) participants(14 males,8 females)aged 18—45 years (mean±SD,26.5±4.1 years)met the inclusion criteria for wear-time of more than 16 h per day over a 7-day period,and were included in the analysis.The majority of the participants were either full time students(12,54%)or worked full time (10,46%).Participants read and signed a written informed consent forms to be included in this study.This study was approved by the Queensland University of Technology Human Research Ethics Committee.
2.2.BMI measurement
Height was measured to the nearest 0.25 cm using a portable stadiometer(SECA model 214,Seca Ltd.,Birmingham,UK)and weight was measured to the nearest 0.1 kg using a portable electronic scale(SECA model 770,Seca Ltd.) following standard procedures.28Participants were asked to wear light clothes and to remove shoes for measurements. BMI was calculated as weight(in kg)divided by squared height(in meters).BMI groups were defined using the WHO classification system being;underweight< 18.5 kg/m2, normal≥18.5—24.9 kg/m2,overweight≥25—29.9 kg/m2, and obese≥30 kg/m2.29
2.3.Posture measurements
Standing,sitting,and lying were assessed using the tri-axis ActiGraph GT3X Activity Monitor(ActiGraph LLC,Pensacola,FL,USA).Thedevicehasdimensionsof1.50×1.44×0.70 inchesandhasaweightof28g.ActiLifesoftware(version5.6.1; ActiGraph LLC,Fort Walton Beach,FL,USA)was used with Low Frequency Extension(LFE)to increase the instrument’s sensitivity to improve accuracy while measuring sedentarybehavior.30TheGT3Xprovidestwotypesofinformation:(1)PA measurements including activity counts and(2)inclinometer information(3 axes),used to determine posture(i.e.,as in vertical,horizontal,and lateral(Axes 1,2,and 3)).With the GT3X device worn on the hip,the inbuilt inclinometer function detects standing,lying,sitting and“off”.The ActiGraph algorithm classifies counts above 100—1951 cpm as standing.31,32If the counts arebelow 100cpm,the information fromtheaxes isused toclassifywhethertheparticipantissittingorlyingorthedevice is“off”.33

Fig.1.Free-living time allocated across consecutive 24 h spent in each of the postural positions of standing,lying,sitting,and non-wear.(A)normal weight,(B) overweight,and(C)obese.
Raw inclinometer data for each 60-s epoch was extracted and matched by date and time.Classification of each minute of activity into an anatomical position(i.e.,standing,sitting,and lying)of the accelerometer data was determined as per the manufacturer’s specifications(i.e.,1 for standing,2 for lying down,3 for sitting,and 0 for non-wear)(Fig.1).The protocols for most existing sedentary activity instruments request adults to wear the monitor during all waking hours and to remove it during sleeping time and for any water-based activity.Nonwear time(including sleeping time and water activities)is often problematic,and can lead to measurement error in sedentary calculations.34—36In order to avoid this measurement error in the current study,participants wore the GT3X for a period of 7 days(weekdays and weekend days)during the full 24 h(which included time spent lying while sleeping), though the GT3X was removed for water-based activities. Although sedentary behavior is defined as activities in sitting or reclined positions≤1.5 METs,and not including sleeping, sleeping still has a MET value of 0.9,37and a considered decision was taken as the risk of loss of data due to non-wear time was more meaningful than differentiation between sleep and non-sleep lying time.Participants were asked to complete a time sheet recording the time and reason why the device was removed for 5 min or more for any activity such as swimming, showering or other activities.As recommended by the guidelines,38,39for inclusion in the data analysis,a day was considered complete if it contained≥16 h per day of wearing time.Additionally,only participants with 7 complete days, including two weekend days were included.Research has shown that the GT3X inclinometer function has acceptable validity when measuring activities of lying down,sitting watching TV,sitting using a computer,and standing still,with accuracy between 60.6%and 66.7%.26
2.4.Statistical analyses
All statistical analyses were carried out using SPSS statistical software,version 19.0 for Windows(IBM SPSS Inc., Chicago,IL,USA).Participants were only included in the analysis if they wore the monitor for more than 16 h per day. Analysis of covariance(ANCOVA)was used to compare adoption of the postures of sedentary behaviors(i.e.,standing, sitting,and lying)among the three BMI categories.Actual wearing time was employed as a covariate to partial the effects of different wear durations from the analysis.The ANCOVA assumptions were checked and none were violated.Sidak confidence interval adjustments were made for multiple comparisons.40Standing time was additionally adjusted for moderate-to-vigorous intensity PA(MVPA)time(h/day)and wear-time.Effect size for time spent in the different postures of standing,lying,and sitting was calculated as the difference between means of the normal weight,overweight,and obese groups,divided by the standard deviation of the two groups. Calculating effect size is a recommended technique for presenting the“meaningfulness”of differences between groups.41Values for Cohen’sdof(0.2—0.5),(0.5—0.8),and(>0.8)were interpreted as small,moderate,and large,respectively.41
3.Results
Characteristics of the study participants are presented in Table 1.Participants wore the accelerometer for 7 days with an average of 22.23 h of wear-time per day.The average durations of wear time(h/day)for all participants were similar for both weekdays and weekend days(22.3 and 22.0 h respectively).The mean BMI±SD values for each category are displayed in Table 1.
Daily posture frequencies are illustrated in Fig.2.Participants within the normal weight and overweight groups spent more standing time(6.7 h and 7.3 h,respectively)than those in the obese group(5.5 h)after adjustment for MVPA and weartime.The ANCOVA revealed that after accounting for the effectsofMVPAandwear-timetherewasastatisticallysignificant effect of BMI status on standing time(F(2,149)=13.02,p< 0.001).Post-hoctests showed significant differences in standing time for normal weight and overweight groups with obese groups(p<0.001)while no significant difference was found between normalweightand overweightgroups (p=0.051).The ANCOVA revealed that after accounting for theeffectsofwear-timetherewasastatisticallysignificanteffect ofBMIstatusonsittingtime(F(2,150)=6.39,p<0.05).Posthoctests reveal a significant difference existed between the normal weight(7.1 h)and obese groups(8.0 h)(p<0.05),and between overweight(6.9 h)and obese groups(p<0.001)for sitting time.There was no significant difference in sitting time between normal weight and overweight groups(p=0.67)after adjustment for wear-time.No significant difference was found inthetotaltimespentlyingamongallgroups(F(2,150)=0.58,p=0.55).
According to Table 2,large effect sizes were observed between the normal weight and obese groups(d=0.9)and between the overweight and obese groups(d=1.5)instanding time.A moderate effect size was observed(d=0.5) between the normal weight and the overweight group for standing duration.A moderate effect size was observed for sitting time between the normal weight and obese groups and between overweight and obese groups(d=0.6,d=0.7, respectively).The obese group spent significantly less standing time for weekdays and weekend days than those in the normal weight and overweight groups(p<0.001).No significant differences were observed for weekdays and weekend days between normal weight and overweight groups(p=0.33 andp=0.35,respectively)in standing time.There were no significant differences on the time spent for sitting and lying in either weekdays or weekends between the three groups (p>0.05)(Table 3).

Table 1 Demographic data for normal-weight,overweight,and obese participants (mean±SD)(n=22).

Fig.2.Average hours per day spent in posture allocations standing,lying,and sitting(Error bars represent SE)after adjustment for MVPA and wear-time. *p<0.05,**p<0.001,compared with the obese.
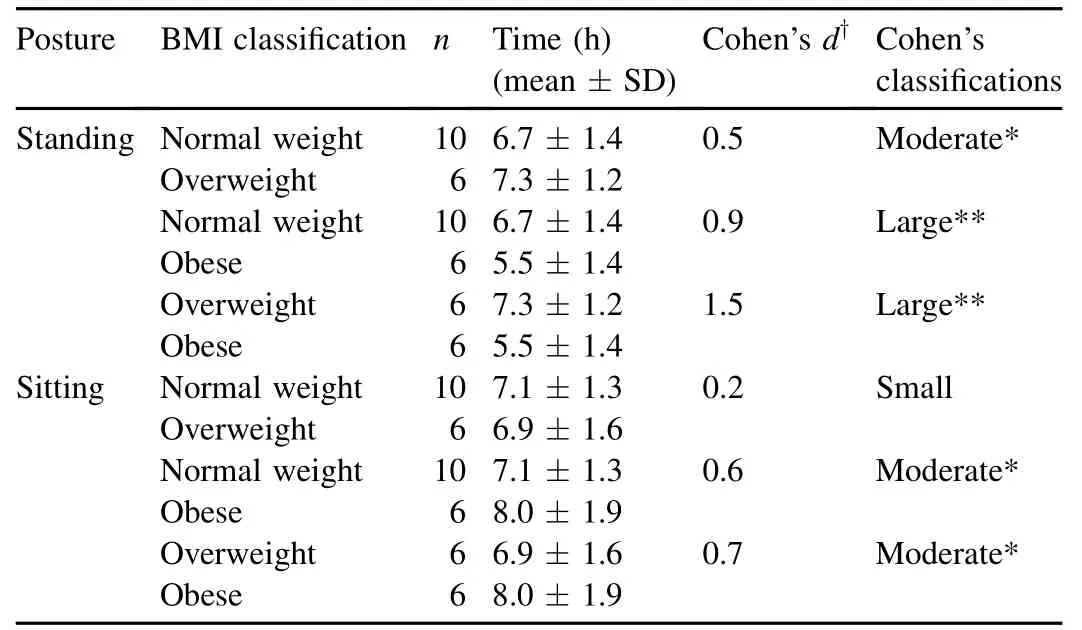
Table 2 Duration and estimated effect sizes,comparing BMI categories in time spent in different postures(standing and sitting).
4.Discussion
The results of this study support the hypothesis that obese participants,on daily average,spent significantly less time standing and more time sitting than either the normal weight or overweight groups.These results are comparable to a study conducted by Levine et al.19who studied 10 lean and 10 obese sedentary adults,using a PA monitoring system(PAMS)that collected data on body positioning(standing still,sitting,and lying)for 10 consecutive days.Those researchers found that the lean group stood for 2 h longer per day than the obese group.In addition,the obese group was seated an average of 2.7 h longer each day than the lean group.The obese group in the current study sat for comparatively less time(0.4 h/day) yet stood for longer than those in the Levine et al.19study. A study by Schaller et al.42also showed that obese individualsself-reported spending significantly more time sitting(watching TVor using the computer for leisure)compared to normal weight or overweight groups.

Table 3 Time(h)spent in difference postures on weekdays and weekends of the three BMI groups(mean±SD).
Unexpectedly,this investigation found no significant difference in standing and sitting time between normal weight and overweight groups.There are several possible reasons why,on daily average,these overweight individuals spent more time in standing than did the normal weight participants. It is possible that the assessment time period in this investigation may have been too short.It should be noted that,for standing,because all of the people in this study were initially sedentary(IPAQ criteria),the expected differences,between the overweight and normal weight participants who,in other studies,may initially present with a normal range of physically active behaviors,are not found in these data.Consequently,the variance observed for“standing”is small therefore the differences which may be found between normal weight and overweight groups were reduced for this group.However, while there was a trend,no significant difference between the groups was found.A large sample would provide greater clarity.The relative instability of standing time between normal and overweight people requires more research for confirmation.However,this is an unexpected result and does not agree with current study hypothesis,i.e.,the group with the higher BMI(the overweight group)were less sedentary(stood for longer)than the group with lower BMI.Objective measurement of sedentary behaviors with larger sample sizes remains a priority for future research.
No significant difference(p=0.55)was observed among all groups for time spent lying(normal weight,9.3 h;overweight,9.3 h;obese,9.6 h).These results are in line with previous research,which illustrates that lean and obese groups spent approximately the same amount of time lying down.19The large amount of lying in this sample is not surprising, given that sedentary adults often spend most of their waking hours either sitting or lying down.31
In the face of growing sedentary lifestyle behavior(sitting and lying),variants of light-intensity PAs have become increasingly important.It has been shown that breaking up sedentary time such as with short bouts of light-or moderateintensity walking,or activities as minimal as standing rather than sitting can have positive effects on BMI.19,43For instance, a review of experimental research by Levine and Miller,44found that if obese sedentary adults were to replace 2—3 h of sitting in front of the computer with walking,energy expenditure could increase by 100 kcal/h.If other components of energy balance were to remain constant,a weight reduction of 20—30 kg per year could occur.44
Due to the high levels of time spent in sedentary pursuits (e.g.,sitting)time observed in our sample and the fact that the majority of the participants were sedentary university students; it may be expected that these adults would sit more on weekdays than weekend days.However,the participants spent similar amounts of time sitting on both weekdays and weekend days.This finding differs from results of previous research which show that on average,sitting time was higher on weekdays than on weekend days.45—47In contrast,a recent study by Burton et al.,48examined 7719 mid-aged adults’selfreported sitting time in variations between weekdays and weekend days,with longer sitting times on weekend days as opposed to weekdays.However,studies examining sitting time during weekdays and weekend days have relied on selfreported data,in which sitting time has been defined either by the amount of time spent watching television or time spent sitting in different settings,such as transport,at home,at work, and during leisure time.A recent study highlighted limitations associated with the use of self-report measures of sitting time. Lee et al.47found that self-reports of time spent sitting on weekdays were subject to less bias due to work and leisure time routines,but the average weekend days provided more discretionary time,therefore,there was increased potential for more reporting error.Moreover,our finding is different to those of a recent experimental study from Australia of 193 employees working in offices,49which found that sitting, assessed using the ActiGraph GT1M(ActiGraph,LLC,Pensacola,FL,USA)accelerometer,was higher on workdays than weekend days.Another study of Scottish postal workers,50using activPAL™(PAL Technologies Ltd,Glasgow,UK)for 7 days,reported that office-based workers spent more sedentary time during workdays and less time on weekend hours than did postal delivery workers.As indicated previously, sitting time may be an important risk factor for chronic health problems,thus accurate measurement of time spent sitting throughout both weekdays and weekend days,is important for our understanding of the links between sitting time and health.
The strength of this study is in its assessment of daily posture allocation(i.e.,standing,sitting,and lying)using a new inclinometer function included with the ActiGraph GT3X accelerometer.As a part of the inclusion criteria,behavior status for all participants was determined as sedentary via the IPAQ.Additionally,participants wore the accelerometer during free-living and sleeping hoursforan average of 22.23± 1.30 h/day for 7 days(no participants reported any issues with wearing the GT3X while sleeping).The limitations of this study,however,include a relatively small sample size of University students,and lack of female participants categorized as obese.The majority of the participants were fulltime students(54%),who participated at the end of the academic year.This is a period of intensive examinations,which may reflect relatively smaller changes in postural allocations between weekdays and weekend days.51However,the results indicate a positive relationship between levels of adiposity and sedentary behaviors which have developed over a much longer time period than the exam week.Additionally,this study has presented postural allocation times over a 24-h day.The GT3X device(inclinometer function)is also unable to distinguish between lying awake and lying asleep.However,without a self-report log for participants to report sleep time,it is diff icult to make conclusions regarding total time spent lying awake or asleep.This makes it difficult to compare these results with previous studies,whereby participants removed the monitor for sleep,and therefore sleep time could be quantified.
Furthermore,previous studies have investigated that when using the GT3X inclinometer function data should beinterpreted with care,as misclassifications are common for standing to be misclassified as sitting.33,52Self-reports should be used in addition to objective indicators of movement to quantify the amount of sedentary behavior throughout the day (morning,afternoon,and evening,both weekdays and weekend days),and to identify sedentary behavior found across all domains:work,leisure,home,and transport.36Further research needs to be conducted,with a larger sample size,and with additional measures such as caloric intake,so that interactions and relationships between PA,sedentariness,and caloric intake may be more closely examined.Furthermore, comparisons should be made for postural allocations(i.e.,the inclinometer functions of standing,sitting,and lying)between sedentary and non-sedentary participants.Given the findings from this study,more research,including randomized controlled trials,is needed to explore the potential for using increased standing time on body composition in obesity prevention strategies.
5.Conclusion
This study is one of the first to use the GT3X inclinometer function-measured time spent in standing,lying,and sitting postures among sedentary adults within differing BMI categories.This study identified that obese participants,on daily average,spent significantly less time in a standing posture and more time sitting than either the normally weighted or overweightgroups.Giventhatstandingcaloricexpenditureisdouble that of sitting and lying,19practitioners working with obese individuals should use an approach that includes increasing daily standing time,as well as reducing daily sitting when aiming to achieve a weight loss.Further,additional research,including randomizedcontrolledtrials,isneededtodeterminetheeffectof increasing standing time on body composition.
Acknowledgment
The authors would like to thank the study participants for their involvement.
1.Pasco JA,Nicholson GC,Brennan SL,Kotowicz MA.Prevalence of obesity and the relationship between the body mass index and body fat: cross-sectional,population-based data.PloS One2012;7:e29580.
2.Rhee SY,Park SW,Kim DJ,Woo J.Gender disparity in the secular trends for obesity prevalence in Korea:analyses based on the KNHANES 1998—2009.Korean J Int Med2013;28:29—34.
3.Du T,Sun X,Yin P,Huo R,Ni C,Yu X.Increasing trends in central obesity among Chinese adults with normal body mass index,1993—2009.BMC Public Health2013;13:327.
4.Gutie´rrez-Fisac J,Guallar-Castillo´n P,Leo´n-Mun˜oz L,Graciani A, Banegas J,Rodrı´guez-Artalejo F.Prevalence of general and abdominal obesity in the adult population of Spain,2008—2010:the ENRICA study.Obes Rev2012;13:388—92.
5.Flegal KM,Carroll MD,Ogden CL,Curtin LR.Prevalence and trends in obesity among US adults,1999—2008.JAMA2010;303:235—41.
6.Kuczmarski RJ,Flegal KM.Criteria for definition of overweight in transition:background and recommendations for the United States.Am J Clin Nutr2000;72:1074—81.
7.World Health Organization.Obesity and overweight fact sheet No.311: updated March 2011.Available at:http://www.who.int/mediacentre/factsheets/fs311/en/.[accessed 04.05.2012].
8.Chan R,Woo J.Prevention of overweight and obesity:how effective is the current public health approach.Int J Environ Res Public Health2010;7:765—83.
9.Owen N,Healy GN,Matthews CE,Dunstan DW.Too much sitting:the population health science of sedentary behavior.Exerc Sport Sci Rev2010;38:105—13.
10.Healy GN,Dunstan DW,Salmon J,Cerin E,Shaw JE,Zimmet PZ,et al. Breaks in sedentary time:beneficial associations with metabolic risk.Diabetes Care2008;31:661—6.
11.Sedentary Behaviour Research Network.Letter to the editor:standardized use of the terms“sedentary”and“sedentary behaviours”.Appl Physiol Nutr Metab2012;37:540—2.
12.Pate RR,O’Neill JR,Lobelo F.The evolving definition of“sedentary”.Exerc Sport Sci Rev2008;36:173—8.
13.Jeffery RW,Utter J.The changing environment and population obesity in the United States.Obes Res2003;11(Suppl):S12—22.
14.Healy GN,Dunstan DW,Salmon J,Cerin E,Shaw JE,Zimmet PZ,et al. Objectively measured light-intensity physical activity is independently associated with 2-h plasma glucose.Diabetes Care2007;30:1384—9.
15.Norton K,Norton L,Sadgrove D.Position statement on physical activity and exercise intensity terminology.J Sci Med Sport2010;13:496—502.
16.Levine JA.Nonexercise activity thermogenesis—liberating the life-force.J Int Med2007;262:273—87.
17.Levin S,Jacobs Jr DR,Ainsworth BE,Richardson MT,Leon AS.Intraindividual variation and estimates of usual physical activity.Ann Epidemiol1999;9:481—8.
18.Tremblay MS,Esliger DW,Tremblay A,Colley R.Incidental movement, lifestyle-embedded activity and sleep:new frontiers in physical activity assessment.Can J Public Health2007;98(Suppl.2):S208—17.
19.Levine JA,Lanningham-Foster LM,McCrady SK,Krizan AC,Olson LR, Kane PH,et al.Interindividual variation in posture allocation:possible role in human obesity.Science2005;307:584—6.
20.Racette SB,Deusinger SS,Deusinger RH.Obesity:overview of prevalence,etiology,and treatment.Phys Ther2003;83:276—88.
21.Biddle S,Cavill N,Ekelund U,Gorely T,Griffiths MD,Jago R,et al.Sedentary behaviour and obesity:review of the current scientific evidence. London,UK:Department of Health;2010.
22.Rachele JN,McPhail SM,Washington TL,Cuddihy TF.Practical physical activity measurement in youth:a review of contemporary approaches.World J Pediatr2012;8:207—16.
23.Harrington D,Dowd K,Bourke A,Donnelly A.Objectively measured sedentary levels of a cross-section of limerick adolescent females.Fifth PE-PAYS Res2010;5:19—28.
24.Kozey-Keadle S,Libertine A,Lyden K,Staudenmayer J,Freedson PS. Validation of wearable monitors for assessing sedentary behavior.Med Sci Sports Exerc2011;43:1561—7.
25.Grant PM,Granat MH,Thow MK,Maclaren WM.Analyzing free-living physical activity of older adults in different environments using bodyworn activity monitors.J Aging Phys Act2010;18:171—84.
26.Carr LJ,Mahar MT.Accuracy of intensity and inclinometer output of three activity monitors for identification of sedentary behavior and light intensity activity.J Obes2012;2012:460271.http://dx.doi.org/10.1155/ 2012/460271[Epub ahead of print].
27.Rosenberg DE,Bull FC,Marshall AL,Sallis JF,Bauman AE.Assessment of sedentary behavior with the international physical activity questionnaire.J Phys Act Health2008;5(Suppl.1):S30—44.
28.Marfell-Jones TOM,Stewart A,Carter L.International standards for anthropometric assessment.Wellington,New Zealand:International Society for the Advancement of Kinanthropometry;2006.
29.WHO.Obesity:preventing and managing the global epidemicInWorld Health Organization technical report series,894;2000.http://libdoc.who. int/trs/WHO_TRS_894.pdf;2000.
30.Rothney MP,Apker GA,Song Y,Chen KY.Comparing the performance of three generations of ActiGraph accelerometers.J Appl Physiol2008;105:1091—7.
31.Matthews CE,Chen KY,Freedson PS,Buchowski MS,Beech BM, Pate RR,et al.Amount of time spent in sedentary behaviors in the United States,2003—2004.Am J Epidemiol2008;167:875—81.
32.FreedsonPS,MelansonE,SirardJ.Calibrationofthecomputerscienceand applications,inc.accelerometer.Med Sci Sports Exerc1998;30:777—81.
33.Ha¨nggi JM,Phillips LR,Rowlands AV.Validation of the GT3X ActiGraph in children and comparison with the GT1M ActiGraph.J Sci Med Sport2013;16:40—4.
34.Masse LC,Fuemmeler BF,Anaerson CB,Matthews CE,Trost SG, Catellier DJ,et al.Accelerometer data reduction:a comparison of four reduction algorithms on select outcome variables.Med Sci Sports Exerc2005;37:S544—54.
35.Healy GN,Matthews CE,Dunstan DW,Winkler EA,Owen N.Sedentary time and cardio-metabolic biomarkers in US adults:NHANES 2003—06.Eur Heart J2011;32:590—7.
36.Barwais FA,Cuddihy TF,Washington TL,Tomson LM,Brymer E.Development and validation of a new self-report instrument for measuring sedentary behaviors and light-intensityphysicalactivity inadults.J PhysAct Health2013.[Epub ahead of print].
37.Ainsworth BE,Haskell WL,Whitt MC,Irwin ML,Swartz AM,Strath SJ, et al.Compendium of physical activities:an update of activity codes and MET intensities.Med Sci Sport Exerc2000;32:S498—504.
38.Colley R,Connor Gorber S,Tremblay MS.Quality control and data reduction procedures for accelerometry-derived measures of physical activity.Health Rep2010;21:63—9.
39.Matthews CE.Physical activity in the United States measured by accelerometer:comment.Med Sci Sports Exerc2008;40:1188.
40.Field A.Discovering statistics using SPSS.London:Sage Publications Limited;2009.
41.Cohen J.Statistical power analysis for the behavioral sciences.2nd edition.Hillsdale,NJ:Lawrence Erlbaum;1988.
42.Schaller N,Seiler H,Himmerich S,Karg G,Gedrich K,Wolfram G,et al. Estimated physical activity in Bavaria,Germany,and its implications for obesity risk:results from the BVS-II Study.Int J Behav Nutr Phys Act2005;2:6.
43.Dunstan DW,Owen N.New exercise prescription:don’t just sit there: stand up and move more,more often:comment on“sitting time and allcause mortality risk in 222 497 Australian adults”.Arch Int Med2012;172:494—500.
44.Levine JA,Miller JM.The energy expenditure of using a“walk-andwork”desk foroffice workerswith obesity.BrJSportsMed2007;41:558—61.
45.Proper KI,Cerin E,Brown WJ,Owen N.Sitting time and socio-economic differences in overweight and obesity.Int J Obes(Lond)2007;31:169—76.
46.van Uffelen JG,Watson MJ,Dobson AJ,Brown WJ.Comparison of selfreported week-day and weekend-day sitting time and weekly time-use: results from the Australian longitudinal study on women’s health.Int J Behav Med2011;18:221—8.
47.Lee RE,Mama SK,Lopez III Y.Sitting time and cardiometabolic risk factors in African American overweight women.J Obes2012;2012: 803467.http://dx.doi.org/10.1155/2012/803467.
48.Burton NW,Haynes M,van Uffelen JG,Brown WJ,Turrell G.Mid-aged adults’sitting time in three contexts.Am J Prev Med2012;42:363—73.
49.Thorp AA,Healy GN,Winkler E,Clark BK,Gardiner PA,Owen N,et al. Prolonged sedentary time and physical activity in workplace and nonwork contexts:a cross-sectional study of office,customer service and call centre employees.Int J Behav Nutr Phys Act2012;9:1—9.
50.Tigbe WW,Lean ME,Granat MH.A physically active occupation does not result in compensatory inactivity during out-of-work hours.Prev Med2011;53:48—52.
51.Daskapan A,Tuzun EH,Eker L.Perceived barriers to physical activity in university students.J Sports Sci Med2006;5:615—20.
52.McMahon GC,Brychta RJ.Validation of the ActiGraph(GT3X)inclinometer function.Med Sci Sports Exerc2010;42:489.
17 October 2012;revised 20 January 2013;accepted 9 June 2013
*Corresponding author.
E-mail address:fabarwais@uqu.edu.sa(F.A.Barwais)
Peer review under responsibility of Shanghai University of Sport
2095-2546/$-see front matter Copyright©2013,Shanghai University of Sport.Production and hosting by Elsevier B.V.All rights reserved. http://dx.doi.org/10.1016/j.jshs.2013.06.003
 Journal of Sport and Health Science2013年4期
- Journal of Sport and Health Science的其它文章
- The effects of Tai Chi exercise on cognitive function in older adults: A meta-analysis
- Effects of resistance and Tai Ji training on mobility and symptoms in knee osteoarthritis patients
- A 6-week diet and exercise intervention alters metabolic syndrome risk factors in obese Chinese children aged 11—13 years
- Process and outcome evaluation of the“No more smoking!It’s time for physical activity”program
- Human neuromuscular structure and function in old age:A brief review Geoffrey A.Powera,*,Brian H.Daltonb,Charles L.Ricec,d
- Current concepts in sport concussion management:A multifaceted approach