
Sensor Configuration and Test for Fault Diagnoses of Subway Braking System Based on Signed Digraph Method
2014-03-01 01:48ZUOJianyongandCHENZhongkai
ZUO Jianyong and CHEN Zhongkai
Institute of Railway and Urban Mass Transit, Tongji University, Shanghai 201804, China
1 Introduction
Increasing demands for passenger safety, availability,and reliability have led to the call for more tolerance in subway systems. Generally, fault tolerance is achievable by either passive or active strategies[1]. The passive approach utilizes robust control techniques to ensure that a closed-loop control system is insensitive to minor faults,whereas the active approach utilizes fault accommodation to adapt the control system to an environment in which faults have occurred. Obviously, the latter is more reliable than the former, especially in public transportation, in which any accident may have severe consequences. For instance, a Shanghai subway train rear-ended another one in 2011, resulting in the injury of hundreds, owing to the accidental shortening of the signal system electricity accidently[2]. If the sensor combination of the subway line had detected the electricity shortage, there might not have been so many injuries.
In fault diagnosis, the performance of two tasks is generally required. One is the identification of possible faults using the available sensor data, and the other is the optimization of sensor locations and the according enumeration of the discernible faults. Comparatively numerous studies have been conducted on fault diagnosis of railway systems. Typical methods include the use of principal component analysis, genetic algorithms, heuristic approaches, and neural networks[3–5]. Nevertheless, studies regarding the optimization of sensor sets are not very popular in the railway industry. Because this paper is about sensor configuration and the corresponding design process of fault diagnosis systems, it is important to know the efficiency of the sensor sets used for diagnosing faults.BHUSHAN, et al[6], proposed an effective method based on the signed digraph (SDG) for analyzing the observability and resolution of a given sensor network. Although the method was originally developed for the diagnosis of faults in chemical plants, it can be applied to the diagnosis of faults in mechanical and electrical devices provided necessary modifications are made. Regarding SDG modeling, there are two widely accepted methods. One of them, developed by UMEDA, et al[7], is based on quantitative models of tested systems. The other one,proposed by LAPP, et al[8], uses flow sheets to develop SDG models. The former requires specific formulas of different variables, whereas the latter may produce complex SDG models that are difficult to handle. Therefore, a method based on the effect function is introduced to facilitate SDG modeling[9].
This paper is organized as follows. Following this introduction, section 2 presents a brief description of the sensor configuration based on SDG modeling using effect functions. Section 3 introduces the application of the SDG method to a case study of the HP2008 braking system.Subsequently, in section 4, we present and analyze the results of detailed bench tests conducted on the optimized sensor set obtained by the SDG method. Finally, we offer some concluding remarks in section 5.
2 Effect-function Modeling and SDG-based Sensor Configuration
The design of an optimized senor configuration can be broadly divided into two tasks: fault modeling and sensor location identification. For most control systems, fault modeling requires specific knowledge of fault propagation or cause-effect behavior, in which SDG-based causal models are widely utilized because of their advantages of not only capturing the information flow but also its direction[10]. After the completion of fault modeling, the optimized sensor configuration can be obtained by generating bipartite graphs based on different design criteria, such as the observability, resolution, and reliability.
2.1 SDG modeling using effect functions
When diagnosing complex systems, there is the problem of insufficiently accurate mathematical models that can be used to adequately represent the systems. Borrowing the concept of graph theory, the SDG can extract the essence of the causal relationships in a given system. Generally, a typical SDG model includes nodes (corresponding to variables) and arcs (representing the causal influences between the nodes). The influences are represented by the positive and negative arcs because the cause and effect variables tend to change in the same or opposite direction.Because SDG models are purely qualitative, the legal values that can be assigned to the nodes are restricted to the set {−, 0, +}, where - indicates low deviation, 0 indicates normal deviation, and + indicates high deviation[11].Furthermore, it is assumed that fault nodes are only allowed to be in the “0” or “+” state, meaning that the representation of the signs are handled by the signed arcs originating from the fault nodes. Because most systems are closed-loop control systems, which tend to eliminate disturbances occurring at controlled variables, noncausal arcs are defined to characterize the control loops during SDG modeling. As indicated in Fig. 1, the arc from S to C is noncausal because a deviation in S will cause a corresponding fluctuation in C, whereas a change in C would not necessarily affect S.

Fig. 1. Typical SDG model including a control loop
In the chemical industry, most process systems can be modeled as a system of differential equations (DE),algebraic equations (AE), or differential algebraic equations (DAE). The algorithms for DE, AE, and DAE systems used to facilitate the modeling process have already been studied by MAURYA, et al[10]. However,mathematical equations are sometimes difficult to derive,especially for designing fault diagnosis systems for railway brakes. Thus, a method originally developed by LI, et al[9]to simplify the SDG modeling process is considered. Based on the modeling requirement of railway braking systems,the efficiency of the original modeling method is improved.The detailed modeling procedure is as follows:
(1) Divide a control system into several units.
(2) Define the variables of each unit.
(3) Obtain the effect functions concerning the relationship of the variables. In effect functions, all the variables are listed separately on the left, and the variables affecting them are listed on the right with signs concerning the direction of the effect.
(4) Obtain the SDG model of each unit.
(5) Combine unit models into the system model of the control system.
(6) Obtain the system fault model by adding fault nodes to the system model.
2.2 SDG-based sensor configuration
Once a system fault model is obtained, the sensor configuration based on it can be analyzed by following two steps.
(1) Generate different bipartite graphs of the SDG system fault model according to different optimization criteria.
(2) Solve the set cover problem given by the bipartite graphs and obtain the optimized sensor sets for each optimization criterion.
Bipartite graph generation is the kernel process of the SDG algorithm because it transfers problems with different optimization criteria to a singular form that can be further processed by a greedy algorithm. The generation methods differ according to their optimization criteria and the number of faults considered. In this paper, four generation methods with four different criteria are considered:observability with single-fault assumption, observability with double-fault assumption, fault resolution with single-fault assumption, and fault resolution with double-fault assumption. Observability requires every defined fault to be observed by at least one sensor, whereas resolution refers to the ability to identify the exact fault that has occurred. Other criteria include reliability, robustness,and so forth[12–13]. A simplified schematic of bipartite graph generation for single-fault observability and resolution is shown in Fig. 2. When observability is considered, a SDG model can be replaced by a digraph (DG) model because the signs are no longer important. In the resulting DG model, one needs to find the measurable nodes affected by each fault, and then, the bipartite graph is formed. When resolution is considered, the signs cannot be neglected anymore, and set theory is used to construct the node sets that contain the information crucial to distinguish between faults. For instance, Bdc+ and Bdc- are nodes created to make a distinction between D and C. The extended details of the four methods are rather lengthy and thus will not be covered in this paper.
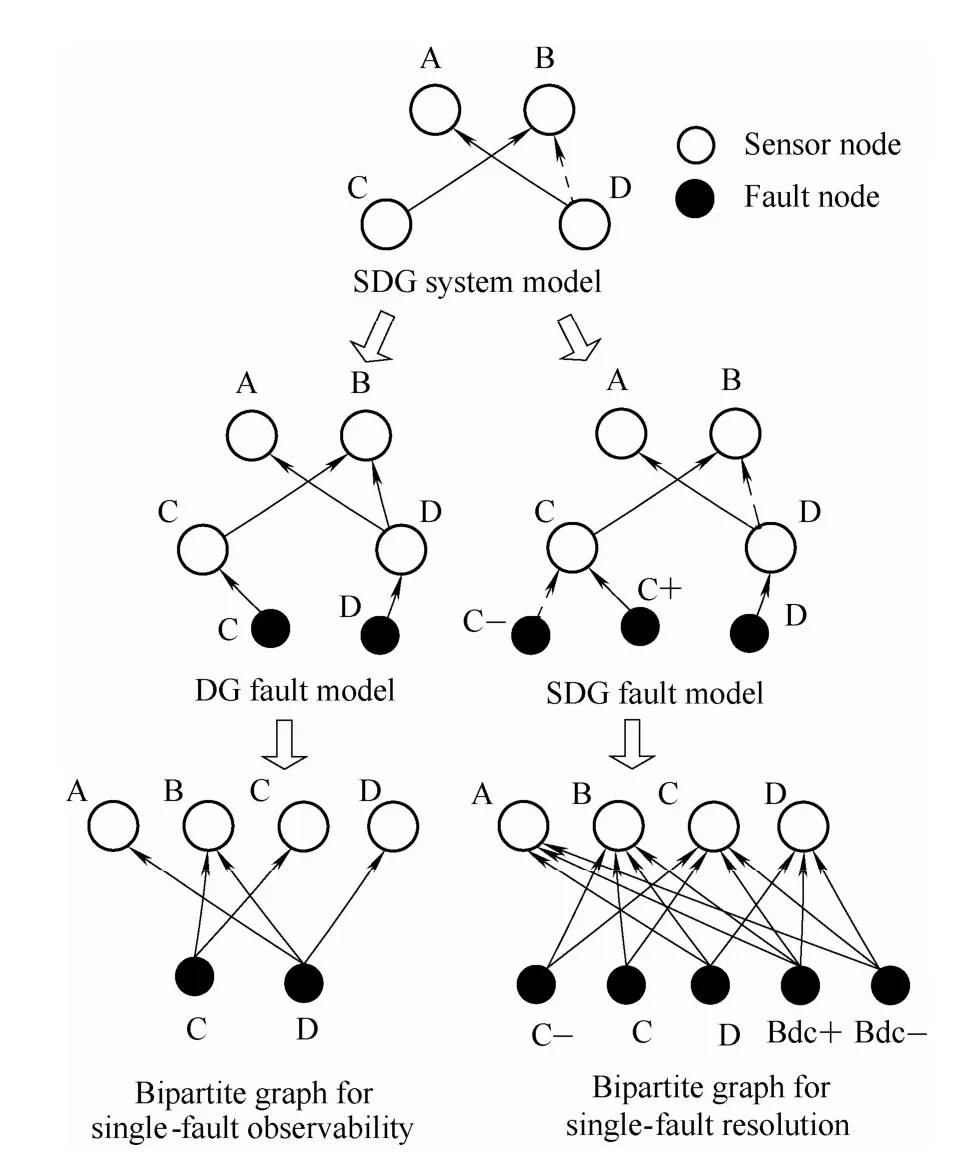
Fig. 2. Schematic diagram of bipartite graph generation
The problem of finding a minimal set that covers every root node in the bipartite graph is a well-known set cover problem[14]. A flowchart of this approach, designed for finding the minimal sensor set, is provided in Fig. 3. As we can see from the figure, the approach focuses on searching the unmarked sensors with highest unmarked arcs, which is a typical characteristic of a greedy algorithm[15]. Because greedy algorithms may keep some redundant sensors, the marked sensors without any arcs are deleted.
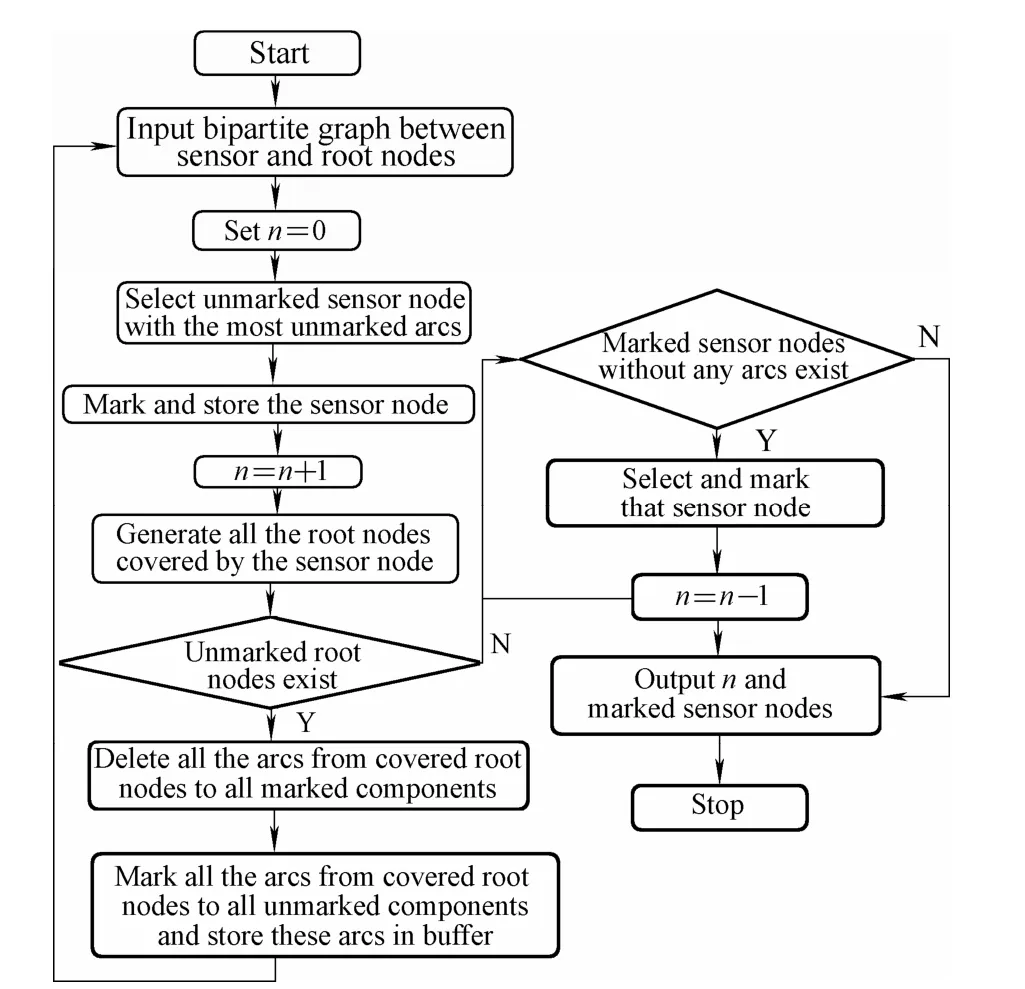
Fig. 3. Greedy algorithm for finding minimal sensor sets
3 Application to HP2008 Braking System
3.1 HP2008 braking system modeling
The HP2008 braking system, illustrated in Fig. 4, is one of the braking systems used in Shanghai Subway Line 1. Its electropneumatic braking system contains microcontrollers and pneumatic actuators and has independent antiskid systems for both air brakes and electric brakes. There are several central units constituting the system: an air supply unit, a pneumatic control unit (PCU), a brake control unit(BCU), a brake electric control unit (BECU), a brake unit,an antiskid valve, a positioning valve, and a closure. In this study, we do not attempt to model all the parts of the braking system, which would be overwhelming. Hence,only the central parts (i.e., the BCU, pneumatic actuators,and antiskid devices) of the braking system are considered.

Fig. 4. System structure of a HP2008 braking system
As shown in Fig. 5, the BCU of the HP2008 braking system mainly contains an EP (electronic pressure) valve,an emergency valve, a load valve, a relay valve, and a CV pressure sensor, all of which are mounted on a plate of aluminum alloy. The EP valve comprises a release valve and a brake valve, and the EP valve forms a control loop together with the CV pressure sensor to control the pressure of an air circuit generated by the EP valve, which sets the brake cylinder pressure via a relay valve. The emergency valve and load valve are only active during an emergency brake and thus are negligible in the service brake condition.The pneumatic actuator contains built-in channels and four brake cylinders, which create friction forces to slow the train. The antiskid device mounted on each wheelset includes a speed sensor and an antiskid valve, and they form a control loop to permit the exhaust of the brake cylinder pressure so that the skidding wheelset can regain the normal adhesion state.

Fig. 5. Pneumatic diagram of HP2008 during a service brake
As previously mentioned, the system SDG model is generated by combining its unit SDG models. For a BCU,there are several variables associated with a service brake:the actual CV pressure (CP), the CV pressure sensor indication (CS), the EP controller value (EPC), the EP indication (EPV), the relay valve pressure difference (RPD),the relay valve pressure (RV), and the relay valve output pressure (ROP). Using these variables, the effect functions of BCU can be formed as follows:
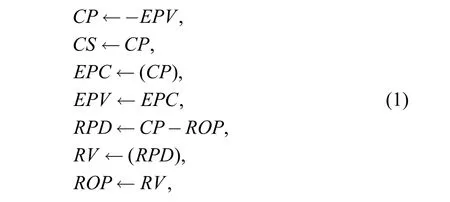
where (CP) and (PD) indicate that the influence of these variables is noncausal.
For a brake unit containing a brake cylinder and an antiskid device, the variables to be considered are the brake cylinder pressure (BCP), the wheelset rotating speed (RS),the speed sensor (RSS), the antiskid valve state (ASV), and the antiskid control state (AC). Thus, the corresponding effect functions can be formed as follows:

After the system units are modeled, the SDG model for the entire braking system is created. This is done using the effect functions representing the relation between different units:

This indicates that the relation between the controller and actuators of the HP2008 braking system is consistent.
As illustrated in Fig. 6, the SDG model of the entire braking system is the combination of the SDG models of the BCU and the four brake units. Note that there are seven noncausal arcs in the model as indicated by the effect functions.

Fig. 6. SDG model of the HP2008 braking system
The possible faults of each component in HP2008 braking system in a service brake process are listed in Table 1. Because the channels within the BCU are created by drilling inside an air-circuit board, the occurrence rate of leakage is quite low[16]. Therefore, it is proper to focus on the failures of the valves and sensors. To facilitate the application of the SDG algorithm, all the component failures obtained from the users’ feedback are represented as fault nodes, which can be conveniently added to the SDG model. Thus, the SDG model for the calculation of sensor sets using these fault nodes can be created, as shown in Fig. 7.

Table 1. Fault nodes and variable nodes

Fig. 7. DG fault model of the HP2008 braking system
3.2 Model of the flow divider valve sensor configuration for fault observability and resolution
If observability is considered, the SDG fault model of the HP2008 braking system can be replaced by a corresponding DG model. Supposing that only one component fault can occur in a given time period, the affected sensor nodes are shown in Table 2. Thus, the sensor set for single-fault observability is {EPC, AC1, AC2, AC3, AC4}. Notice that control sensors like CS are neglected in the calculation,which means the actual sensor set is {EPC, CS, AC1, AC2,AC3, AC4, RSS1, RSS2, RSS3, RSS4}.
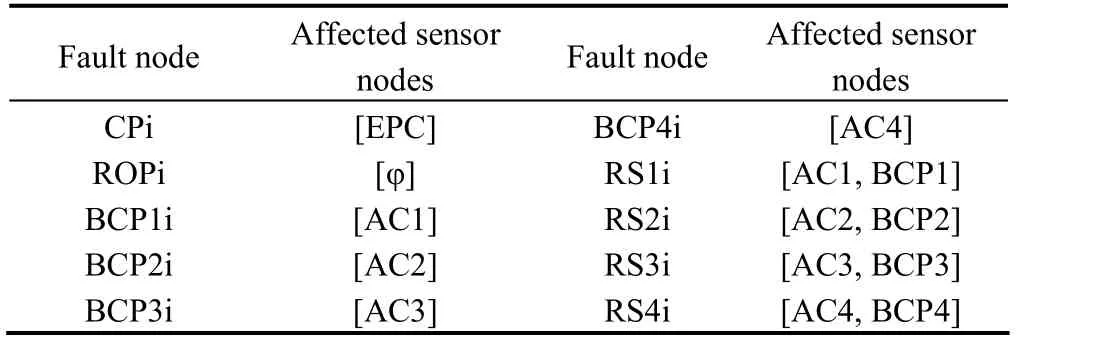
Table 2. Affected nodes under the single-fault observability assumption
Under the double-fault assumption, the affected sensor nodes for every fault node are listed in Table 3. Using these data, the calculated sensor set for double-fault observability is {EPC, AC1, AC2, AC3, AC4, BCP1, BCP2, BCP3,BCP4}, whereas the actual sensor set considering the control sensors is {EPC, CS, AC1, AC2, AC3, AC4, BCP1,BCP2, BCP3, BCP4, RSS1, RSS2, RSS3, RSS4}.

Table 3. Affected nodes under double-fault observability assumption
If resolution is considered, it is necessary to take into account the signs of the fault nodes. Under the single-fault assumption, control loop failures are not recognizable, and similarly, the affected sensor nodes can be obtained from Table 4. Based on these data, the sensor set for single-fault resolution will be {EPC, AC1, AC2, AC3, AC4} with the actual set being {EPC, CS, AC1, AC2, AC3, AC4, RSS1,RSS2, RSS3, RSS4}. Interestingly, this sensor set is the same as the sensor set produced for single-fault observability.

Table 4. Affected nodes under single-fault resolution assumption
Under the double-fault assumption, the SDG algorithm is much more complicated, and thus, only a part of the affected nodes is listed in Table 5. Using the greedy algorithm, the sensor set for double-fault resolution will be{EPC, BCP1, BCP2, BCP3, BCP4, RSS1, RSS2, RSS3,RSS4, AC1, AC2, AC3, AC4} with the actual set being{EPC, CS, BCP1, BCP2, BCP3, BCP4, RSS1, RSS2, RSS3,RSS4, AC1, AC2, AC3, AC4}.
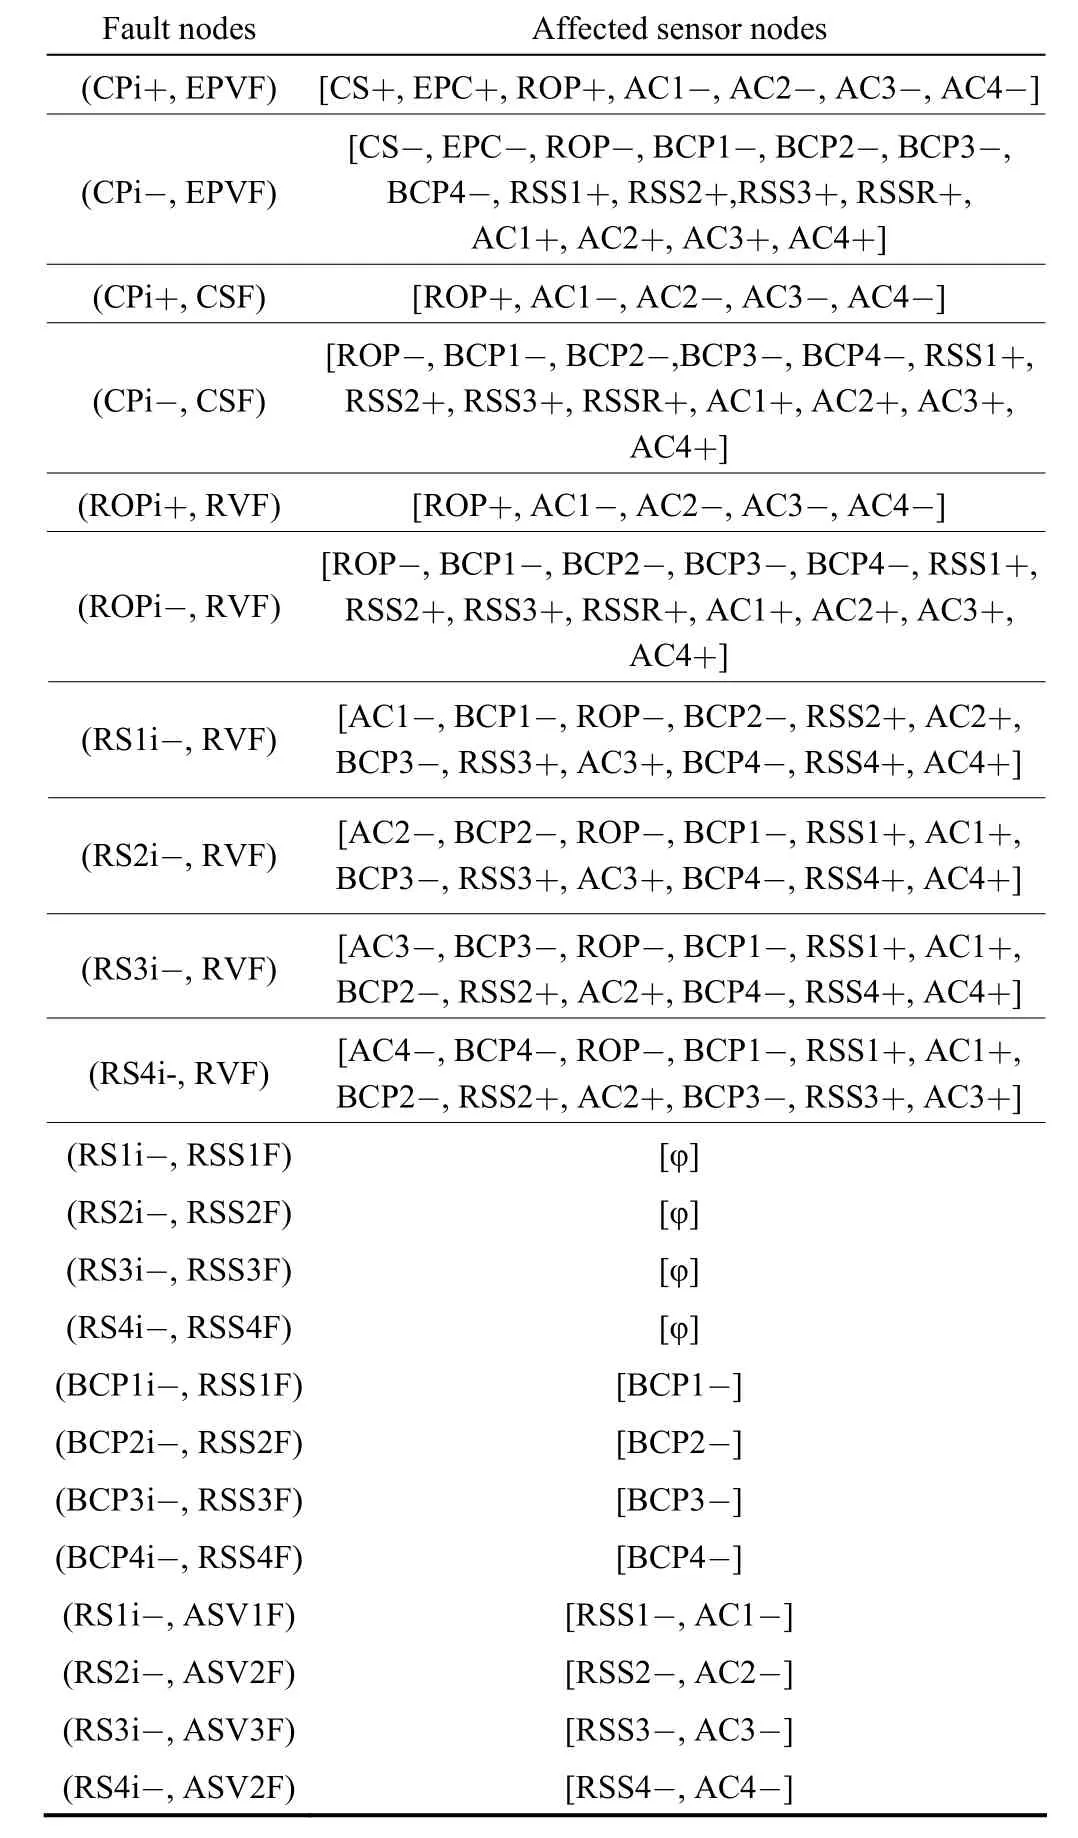
Table 5. Affected nodes under double-fault resolution assumption
4 Analysis of Optimized Sensor Configuration Using Air Brake Test Bench
4.1 Description of air brake test bench
The optimized sensor set can be evaluated using the air brake test bench at the Urban Mass Transit Railway Research Institute, Tongji University[17], as shown in Fig. 8.The test bench consists of an industrial computer, a fault generation board, a PCI (Peripheral Component Interconnect) data board, three BECUs, three BCUs, and a vibration platform. The vibration platform is utilized to mimic the actual condition inside subway trains. The fundamental advantages of using the test bench capable of simulating most faults in subway braking systems are as follows.
(1) Using the test bench, the tests can be carried out repetitively and with most environmental variables controlled.
(2) It is more convenient and economical to add or reduce sensors in a test bench than in a real braking system used by Shanghai Metro.

Fig. 8. Air brake test bench
As illustrated in Fig. 9, the LabVIEW program of the test bench can be divided into four simultaneously running processes with respective objectives. The fault generation process is in charge of reproduce the faults originally observed in field tests, whereas the data acquisition process and data display process, respectively, transfer data from the PCI data board to the industrial computer and display them graphically. In addition, operators can also create brake control signals by using the brake control process.All the data generated during a testing process can be logged into a test database, and there is also a fault database full of fault patterns obtained from Shanghai subway trains to facilitate the evaluation of the fault reactions of various sensor sets.

Fig. 9. Software diagram
4.2 Test results
As previously mentioned, the SDG algorithm for sensor optimization is qualitative, and after the optimization process, the engineers must design detailed fault diagnosis algorithms or rules. Therefore, it is of the utmost importance to verify whether the optimized sensor set can truly observe the faults used during the optimization process. We verified this by simulating these faults using the air brake test bench. As the details of all these faults can be overwhelming, a specific example concerning release valve failure is described elaborately. Fig. 10 shows that a normal staged brake is always characterized by alternating inflation and deflation. Nevertheless, the deflation phenomenon disappears when the release valve is broken and can no longer connect to the atmosphere. According to the affected nodes in Table 5, the sensors affected by the release valve failure include CS+, ROP+, and BCPi+,which is verified by Fig. 10, as all these pressures are comparatively higher than their counterparts during a normal staged brake. By studying all the fault patterns, it is proven that the affected sensor nodes used in the SDG algorithm qualitatively predict the deviation of the state variables during system failures.

Fig. 10. Pressure curves during staged brakes
In general, the purpose of the SDG algorithm is to reduce the number of sensors and to improve the quality of fault detection. As for the HP2008 braking system, the optimization effect is supported by the bar charts in Fig.11(a). One immediately notes that the SDG algorithm uses general sensors instead of tangible ones to improve fault detection capability. Through this method, we are able to add five general sensors to both the single-fault resolution and double-fault resolution sensor sets, and thus, the equivalent sensor numbers for both situations are equal to 10 and 14, respectively. The difference between the general sensors and tangible ones is that the former type treats the values inside the controllers as sensor values.
Furthermore, there is a huge gap between the counted double-fault and detectable fault because current fault detection methods in subway braking systems are generally rule based[18]. Because most rules currently utilized are purely empirical, their number is quite limited. If the gap can be filled through the introduction of new algorithms capable of detecting faults systematically, the accuracy of subway brake fault diagnosis will be greatly improved. As illustrated in Fig. 11(b), the original diagnosis method can only detect six single faults of the HP2008 braking system.After the application of the SDG method, we increase the number of detectable single faults to 10 faults and include 67 additional double faults that were not detectable before.

Fig. 11. Effect of sensor configuration
5 Conclusions
In this study, the SDG algorithm developed by Bhushan and Rengaswamy[6]was used to run the observability and resolution analyses for electromechanical systems such as the HP2008 braking system. To achieve this goal, the research follows three procedures: (1) build the SDG model via effect functions, (2) generate bipartite graphs from SDG models, and (3) solve the set cover problem of the bipartite graphs based on criteria such as observability or resolution.To prove the efficiency of our approach, a case study using the HP2008 braking system is introduced in detail, and the bench tests using the air brake test bench enabled us to make the following conclusions.
(1) The SDG approach is capable of generating optimized sensor sets. Regarding the HP2008 braking system, the sensor set solution is proposed.
(2) For the HP2008 braking system, we find that the SDG algorithm can improve the single-fault resolution from 6 faults to 10 faults, and with an additional four BCP sensors it can cover up to 67 double faults, which were not considered by the traditional fault diagnosis system.
(3) The potential faults of the air braking system can be detected by the sensor sets calculated using this method. It is useful to build the fault map and diagnose them in detail.
[1] BARBOZA D. Shanghai subway accident injures hundreds[N/OL].The New York Times, (2011) [2011-9-28]. http://www.nytimes.com/2011/09/28/world/asia/shanghai-subway-accident-injures-hundreds.html.
[2] FRANK P M. New developments using AI in fault diagnosis:engineering applications[J]. Artificial Intelligence, 1997, 10(1):3–14.
[3] VAZQUEZ J, MAZO M, LAZARO J L, et al. Detection of moving objects in railway using vision[C]//IEEE Intelligent Vehicles Symposium, Parma, Italy, June 14–17, 2004: 872–875.
[4] ROBERTS C, GOODMAN C, BAI H. A generic fault detection and diagnosis approach for railway assets[C]//International Conference on Railway Engineering – Challenges for Railway Transportation in Information Age, Hong Kong, China, March 25–28, 2008: 1–8.
[5] LI P, KONG F, DANG L. A new fault diagnosis system for train bearings based on PCA and ACO[C]//Logistic Systems and Intelligent Management, Harbin, China, January 9–10, 2010: 526–530.
[6] BHUSHAN M, RENGASWAMY R. Design of sensor network based on the signed directed graph of the process for efficient fault diagnosis[J]. Industrial and Engineering Chemistry Research, 2000,39(4): 999–1019.
[7] UMEDA T, KURIYAMA T, O’SHIMA E, et al. A graphical approach to cause and effect analysis of chemical processing systems[J]. Computer Applications in Chemical Engineering.Proceedings of the 12th European Symposium, 1980, 35(12):2379–2388.
[8] LAPP S A, POWERS G J. Computer-aided synthesis of fault-trees[J]. IEEE Transactions on Reliability, 1977, 26(1): 2–13.
[9] LI A, XIA T, ZHANG B, et al. SDG modeling approach for chemical engineering process[J]. Journal of System Simulation,2003, 15(10): 1364–1368.
[10] MAURYA M R, RENGASWAMY R, VENKATASUBRAMANIAN V. Application of signed digraphs-based analysis for fault diagnosis of chemical process flowsheets[J]. Engineering Applications of Artificial Intelligence, 2004, 17(5): 501–518.
[11] OUASSIR M, MELIN C. Causal graphs and rule generation:application to fault diagnosis of dynamic processes[C]//Proceedings of the 10th International Conference on Industrial and Engineering Applications of Artificial Intelligence and Expert Systems, Goose Pond Press, October 28, 1997: 367–373.
[12] ALI Y, NARASIMHAN S. Sensor network design for maximizing reliability of linear processes[J]. AIChE Journal, 1993, 39(5):820–828.
[13] BHUSHAN M, NARASIMHAN S, RENGAWAMY R. Robust sensor network design for fault diagnosis[J]. Computers and Chemical Engineering, 2008, 32(4–5): 1067–1084.
[14] LOZIN V V. On maximum induced matchings in bipartite graphs[J].Information Processing Letters, 2002, 81(1): 7–11.
[15] KODAGANALLUR V, SEN A K. Greedy by chance – stochastic greedy algorithms[C]//Sixth International Conference on Autonomic and Autonomous Systems (ICAS), Cancun, Mexico, IEEE, March 7–13, 2010: 182–187.
[16] YU Z, CHEN D. Modeling and system identification of the braking system of urban rail vehicles[J]. Journal of the China Railway Society, 2011, 33(10): 37–40.
[17] WANG X, WU M, CHEN Z. Application with theory of vibration equivalence on reliability test bed of train brake system[J]. Applied Mechanics and Materials, 2010, 34(35): 1978–1982.
[18] DALEY S, NEWTON D A, BENNETT S M, et al. Methods for fault diagnosis in rail vehicle traction and braking systems[C]//IEE Colloquium on Qualitative and Quantitative Modelling Methods for Fault Diagnosis, London, England, April 24,1995: 501–513.
 Chinese Journal of Mechanical Engineering2014年3期
- Chinese Journal of Mechanical Engineering的其它文章
- Theoretical Analysis and Experimental Verification on Valve-less Piezoelectric Pump with Hemisphere-segment Bluff-body
- Carbody Structural Lightweighting Based on Implicit Parameterized Model
- Prediction-based Manufacturing Center Self-adaptive Demand Side Energy Optimization in Cyber Physical Systems
- Effectiveness of a Passive-active Vibration Isolation System with Actuator Constraints
- Numerical Simulation and Analysis of Power Consumption and Metzner-Otto Constant for Impeller of 6PBT
- Proceeding of Human Exoskeleton Technology and Discussions on Future Research