隔离应激加速SAMP8小鼠记忆功能减退
2014-08-09 01:29董红心曾俊伟SusanFarrWilliamBanksJohnMorley
遵义医科大学学报 2014年1期
董红心,曾俊伟,陈 倩,李 菲,Susan A. Farr,William A.Banks,John E.Morley
(1.西北大学芬伯格医学院 精神病学和行为科学教研室,芝加哥 美国;2.遵义医学院 生理和药理教研室, 贵州 遵义 563099,中国;3.圣路易斯大学 VA 医学中心,圣路易斯 美国;4.圣路易斯大学医学院 老年病研究部、内科教研室,圣路易斯 美国)
Growing evidence from clinical research to animal studies indicates that physical and psychosocial stressors may be involved in the onset and progression of Alzheimer’s Disease (AD)[1-5].For instance, elevation of plasma cortisol levels have been reported in patients diagnosed with AD[6].In addition, a correlation has been reported between the increase in 24 h cortisol levels and the severity of cognitive deficits in AD patients[7], and between elevated basal cortisol levels and increased rates of dexamethasone non-suppression in AD patients[8]. Furthermore, postmortem CSF cortisol levels in AD patients were 83% higher than in controls[9]. Increased plasma cortisol levels have been reported in patients with dementia of the Alzheimer’s type (DAT)[10-12]and in longitudinal studies of DAT patients; and increased plasma cortisol levels have been correlated with more rapid cognitive decline[13].However, relatively little is known about the mechanisms by which psychosocial stressors might impact the pathogenesis of AD.
Recent studies of transgenic mice that overproduced amyloid precursor protein (APP) suggested that behavioral stressors may accentuate the production of Aβ and its incorporation into Aβ plaques.For example, increases in Aβ plaque deposition has been observed in the hippocampus and cortex of stressed Tg2576 and APPV717I-CT100 mice[1,4,14-15].Further, administration of dexamethasone to triple transgenic APP/PS1/MAPT mice increased brain levels of APP, Aβ, as well as β-APP cleaving enzyme (BACE) and the β-C-terminal fragment (β-CTF) of APP[16]. Our group showed that behavioral stressors can acutely increase basal levels of Aβ via corticotropin-releasing factor recptori(CRFR) and elevate neuronal activity[17-18]. Also,CRFRs have been implicated in stress-induced hippocampal tau phosphorylation (tau-P) in rodents[19-20]. These studies suggest an interaction between stress-induced changes in elements of the HPA axis and the pathogenesis of AD.
Currently, research studying the relationship between stress and neuropathological changes are mostly limited on transgenic animal models.Whether stress also influences non-transgenic mouse model of AD have not been addressed. Senescence-accelerated prone mice (SAMP) are serial models of accelerated senescence established through phenotypic selection from a common genetic pool of the AKR/J strain of mice. SAMP8, one of the SAMP sub-strains, has been proposed as a model for AD, as these animals exhibit premature memory loss and increased APP expression[21-24]and is well characterized in genetic and behavioral traits[25-26]. In the current study, we chronically isolated SAMP8 mice from weaning for 6 months, and then conducted memory function tests, measured plasma corticosterone, mouse amyloid, hippocampus volume, and discussed the potential mechanism.
1 Material and methods
1.1 Animals SAMP8 mouse line was from our colonies originally developed by Takeda group[27]. A total of 48 mice of both genders were used for this study.Newborn pups were weaned at 3 weeks of age and randomly divided into four groups:isolated SAMP8(n=12); group-housed SAMP8 (n=12);isolated SAMP8;control (SAMR1 mice, n=12);and group-housed SAMP8 control (SAMR1 mice, n=12). Male and female animals were equally distributed in each group.All experimental procedures involving animals were performed in accordance with guidelines established by the Animal Studies Committee at St Louis University and Washington University and in accordance with the National Institutes of Health and Institutional Guidelines.
1.2 Isolation stress Isolated SAMP8 and control mice were individually housed in cages 1/3 smaller (10 cm×14 cm×9.5 cm) than standard-sized mouse cages (27 cm×14 cm×11 cm), placed on separate shelves, and blocked with a board to prevent visual contact, from weaning until 6 months of age[1]. Non-isolated animals were housed in 3 animals per standard-sized cage of the same gender, and housed next to each other on standard racks for the same time period.Both groups of animals were maintained at 25 ± 1° C under a L12:D12 light-dark (light on 6 AM) cycle, and food and water were made availableadlibitum.
1.3 Behavioral tests
1.3.1 Fear conditioning task[1,4]Animals were trained and tested in two Plexiglas conditioning chambers (Coulbourn Instruments) each measuring 26 cm long, 18 cm high, and 18 cm wide and containing a metal grid floor. Each chamber was housed within a larger sound-attenuating chamber containing a fan that provides 70 dB background noises, a 24 W white light, and a peep hole for viewing the animals. Each chamber was different in terms of odor, visual and somatosensory cues. Chamber A contained piece of absorbent cotton soaked in mint extract and placed in a cup outside of the conditioning chamber, during training and contextual testing, the chamber light was off.The walls of chamber A were smooth stainless steel and the floor was stainless steel grid. Chamber B contained a piece of cotton soaked in coconut extract and placed in a cup just outside the chamber. The walls of chamber B were covered with black and white stripes with a solid plexiglas floor. During testing for cued conditioning, the chamber light was kept on.
Animals were habituated to the testing room for 30 minutes on the day prior to training. On the training day, animals were placed in Chamber A for five minutes. Freezing behavior, as defined as no movement other than normal respiratory movements, was monitored by a video tracking program (Actimetrics Inc), and visually by the experimenter through a camera inside the larger chamber.After three minutes, an 80 dB, 2800 Hz tone will be presented for 20 sec. During the last two seconds of the tone, animals received a 1.0 mA continuous foot shock. This pairing was repeated for a total of 3 tone-shock pairings. Animals were removed from the testing cage 40 seconds after the third shock and returned to their home cage. Then 24 hours later, the animals were returned to Chamber A to evaluate freezing behavior in response to the context. Freezing behavior was recorded by the tracking program for a period of 8 minutes in which no tone or shock were presented (Context Test). Twenty-four hours later, animals were placed in chamber B to be evaluated in cued conditioning. The animals were observed for 10 minutes in this chamber and freezing behavior was recorded. After two minutes of baseline, the auditory cue was presented for the remaining eight minutes Cue Test.
Since baseline differences in sensitivity to shock could confound the analysis of the fear conditioning experiments, all animals were tested for their reactivity to shock. These tests were performed 24 hours following the cued conditioning evaluation in Chamber A. Mice were exposed to 1 sec shocks every 10 sec in an order of increasing intensity (0.075, 0.1, 0.25, 0.35, 0.45, 0.55, 0.65, and 0.75 mA). The level of shock required to induce flinching, running, vocalization and jumping were determined. Once the threshold for each of these responses had been determined, the exposures stopped, or if the threshold reaches 1.0mA. For example, if all behavioral responses were observed at a level of 0.25mA, that was determined to be the threshold for that animal and no further shocks were administered. This measure was used to determine if perception of the shock stimulus was consistent across experimental groups.
1.3.2 Spatial reversal learning[28]A Water T-maze was filled with water colored with non-toxic white Crayola paint. The water was maintained at approximately 28 ℃±1 ℃ during testing. A platform measuring 11 cm2was submerged 0.5 cm below the water’s surface. Prior to training, animals were handled for five minutes a day for three days. They were moved to the testing room on the first two days of handling. On the final day of handling, they were alternately placed in the water and on the platform to acclimate them to the water maze. For the first 3 days, the mice were trained to find the platform by being placed near the hidden platform so that they may learn to climb onto it, with the distance between the platform and the drop-in location increased with each progressive day, so that the animal was the farthest point possible (the stem) from the arm on the third day.If the animal did not find platform after 60s, we guided him to it by putting a finger on top of the platform. The acquisition task began on day 4, mice were trained to find the escape platform in one choice arm of the maze until 6 of 8 correct choices were been made on consecutive trials. The reversal learning phase was conducted on day 5. During the reversal learning phase, mice were trained to find the escape platform in the choice arm opposite from the location of the escape platform on day 4. The same performance criterion and inter-trial interval was used as during the acquisition task. The animals were allowed to rest and dry under warming lamps between sessions as during habituation. Since there was a degree of individual differences in the ability of animals to swim, any animal, displaying drowning behavior, e.g., sinking or much labored swimming was immediately removed from the maze and allowed to rest. If an animal repeatedly swam poorly, it was excluded from the experiment.
1.4 Corticosterone assay Blood was collected by rapid retro-orbital phlebotomy (less than 1 min) at 6:00 pm, after 6 months of isolation stress. Plasma concentration of corticosterone was measured using EIA kit (Cayman Chemical Company, Ann Arbor, MI) according to the introduction manual and published methods[29]. The serum corticosterone content was calculated in picogram per milliliter according to the manufacturer’s recommendations.
1.5 Brain tissue Aβ measurement Immediately following blood collection, animals were killed by decapitation, the hippocampus and overlying cortex of the half brain were snap-frozen on dry ice, and then stored at -80o C.Later, tissue levels of Aβ were measured using Enzyme-Linked ImmunoSorbent Assay (ELISA).
Half brain cortex and hippocampus were homogenized in cold phosphate buffer at pH 6.7 containing 1mM EDTA and complete protease inhibitor. The saturated guanidium HCl solution was added into tissue homogenous to final concentration 5M, and incubated for 1.5hr at room temperature. The extracting samples were diluted 10 times with ELISA standard buffer and centrifuge at 13.000 g for 20 min at 4 ℃. The supernatants used for detecting tissue Amyloid-β-42(Aβ1-42). The ELISA reactions were performed according to Wako Aβ1-42ELISA kit. 100 μl standard dilutions and 100 ul sample solutions were dispensed into antibody pre-coated 96 plate wells and incubated at 4° C overnight. After HRP-conjugated antibody incubation and HRP reaction, the absorbance of each well was read at 450 nm against a TMB solution blank. The Aβ1-42concentrations for unknown samples were calculated from the standard curve.
The absorbance in each well was read with Microplate Reader (SpectraMax Plus Molecular Devices Sunnyvale, CA).The intra-assay coefficient of variation was 2.9%.
1.6 Protein carbonyl measurement Half brain cortex and hippocampus were homogenized in cold phosphate buffer, pH 6.7 containing 1mM EDTA and complete protease inhibitor. After centrifuge at 10,000 g for 15 min at 4 ℃,the supernatants were removed and incubated with streptomycin sulfate at a final concentration of 1% in the samples to get rid of nucleic acid contamination. The supernatants were used for determining protein carbonyl content following the kit protocol(Cayman chemical company,Ann Arbon,MI). In brief, 200 μl supernatant of sample was transferred to two tubes, sample tube was added with 800 μl 2,4-dinitrophenylhydrazine solution and control tube was added with 800 ul 2.5M HCl. The reactions were incubated in the dark at room temperature for 1 hr. Then 1 ml of 20% TCA was added in each sample and incubated on ice for 5 min to form the precipitation.The pellets were washed with 10% TCA one time and Ethyl Acetate solution three times. After the final wash, the protein pellets were re-suspended in 500 μl of guanidine hydrochloride and the absorbance for each sample was measured at a wavelength between 360-385 nm using a plate reader.
1.7 Tissue preparation and Nissl staining Another half brain tissue of the animals were fixed in 4% paraformaldehyde for 7 days, and then fixed at 4oC using the same fixative with 30% sucrose for 48 hr. The brains were dissected and embedded in Tissue-Tek embedding medium (Electron Microscopy Sciences, Hatfield, PA), and cut into 35 μm thick sections in the coronal plane using a cryostat (Leica CM 1850 UV, Nussloch, Germany).The cortex was nicked in the left hemisphere prior to sectioning to serve as a marker of orientation and the sections were mounted onto slides with a consistent orientation.Of the 6 sets of serial sections (24-26 sections each), we took one series for Nissl (cresyl violet) staining to measure hippocampus volume. Every sixth section throughout the hippocampus was mounted on a gelatin-coated slide and allowed to air-dry overnight. The slides were then rehydrated in double distilled water, submerged in a standard thionin solution for 15 to 45 s until the desired depth of staining was achieved, and then gradually dehydrated for 5 min in successive baths of ethanol (i.e. 50%, 75%, 90%, 95% and 100%). Each slide was then given two 15-min baths in 100% xylenes and covered for light microscopy.
1.8 Hippocampal volume Nissl-stained coronal sections were used to estimate the whole volume of the hippocampal formation. All sections containing the hippocampus were photographed. The final resolution of the images was one pixel2= 0.00056787 mm2. Using the Analyze 8.0 stereology module, the area of hippocampus on each photograph was measured in each coronal section using Cavalieri’s principle.The contours of the hippocampus were identified using landmarks derived from a mouse brain atlas. A grid was randomly placed over each photograph. The points on the grid were spaced 8 pixels apart on the X and Y axes. Thus, the total number of grid points over the target area was multiplied by 64 to obtain an estimate of the total pixels encompassing the hippocampal formation in each brain. This total pixels were then multiplied by 0.00056787 mm2and 0.28 mm (the distance between sections) to obtain hippocampal volume.
1.9 Data analysis All variables were compared across groups using two-way ANOVA. When genotype effects (i.e., SAMP8 versus control), housing condition effects (i.e., isolated versus group-housed), or genotype × housing condition interactions were found, post-hoc analyses were performed using Bonferroni-Dunn multiple comparisons post hoc test. For ANOVA, statistical significance was accepted forP-values less than 0.05.
2 Results
2.1 Behavioral tests
2.1.1 Conditioned Fear There was no significant effect of genotype [F(1,44)=1.056,P=0.312],but effect of housing [F(1,44)=6.135,P=0.019], no genotype×housing interaction [F(1,44)=0.132,P=0.719]on context test after 6 months isolation stress (Fig 1A). There was significant genotype [F(1,42) =9.015,P=0.005)] and housing [F(1,42)=18.041,P=0.002)], but no genotype and housing interaction ([F(1,42) =0.452,P=0.5)] on cue test after 3 months isolation stress. This data suggested that isolation stress impaired SAMP8 mice memory behavior(*P<0.05;**P<0.01).

Fig 1 Fear conditioning test
2.1.2 Spatial reversal learning To test whether longer isolation stress showed strain differences on memory tests.we continued isolation on these animals for another 3 months, then conducted the behavior test again. Since the shock during fear conduction test may have influenced the results, we used T-water maze instead. We found there was a significant effect of strain [F(1,27)=4.57,P=0.042] and housing condition [F(1,27)=7.81,P=0.009] (Fig 2 A).There was significant strain [F(1,27) =17.7,P=0.0003] and housing condition [F(1,27)=4.403;P=0.045)], but no strain and housing interaction ([F(1,27) =1.693,P=0.2)]on reversal learning after 6 months of isolation stress (Fig 2 B). Post-hoc test indicated that isolation stress significantly increased the trials to reach the criterion (P=0.002). But there was no significant difference between SAMP8 and control groups in acquisition test; in contrast, there was a significant difference between SAMP8 and control groups in reversal learning test. (*P<0.05;**P<0.01).
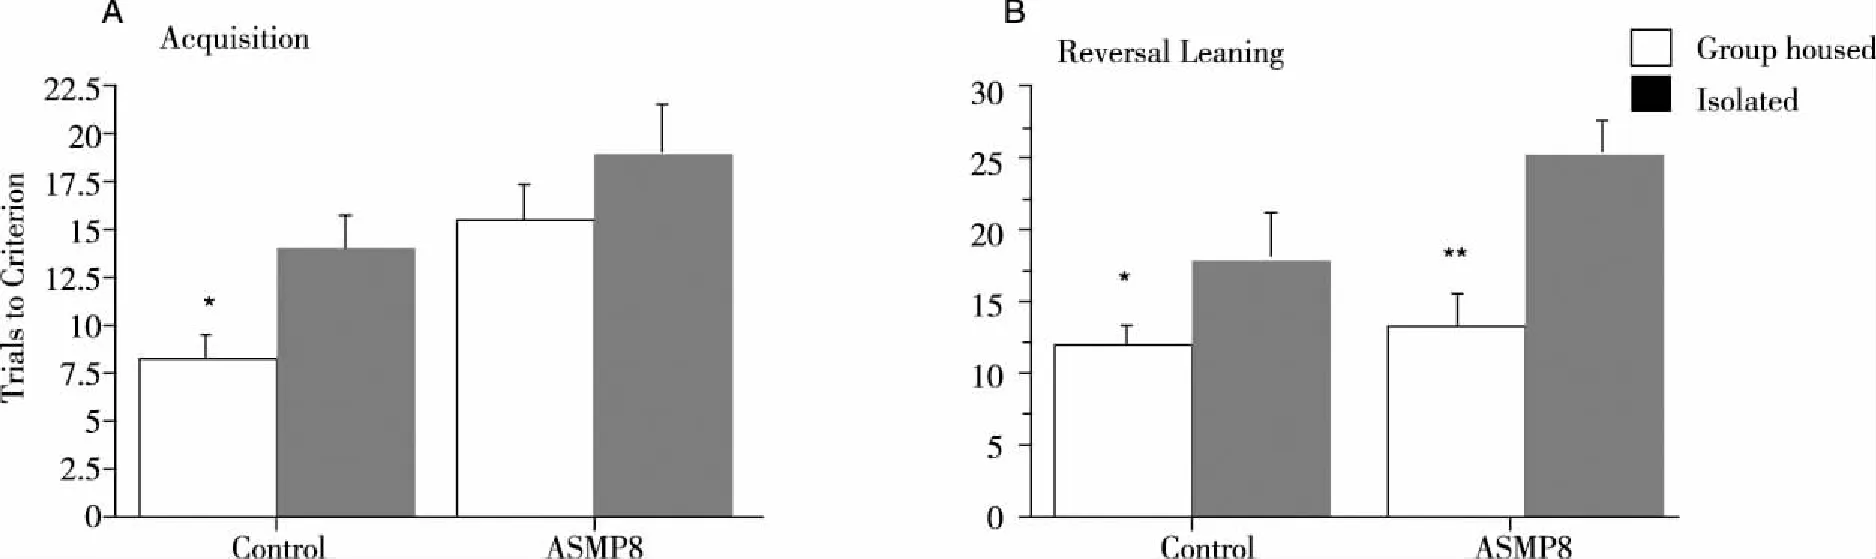
Fig 2 Spatial reversal learning test
2.2 Plasma corticosterone levels There was an overall effect of housing condition [F(1,28)=8.5,P=0.007] but no strain and strain by housing interaction on plasma corticosterone levels in SAMP8 mice. Post hoc analyses showed that isolation stress was associated with significant increases in plasma corticosterone levels in SAMP8 mice. (*P<0.05,Fig 3).
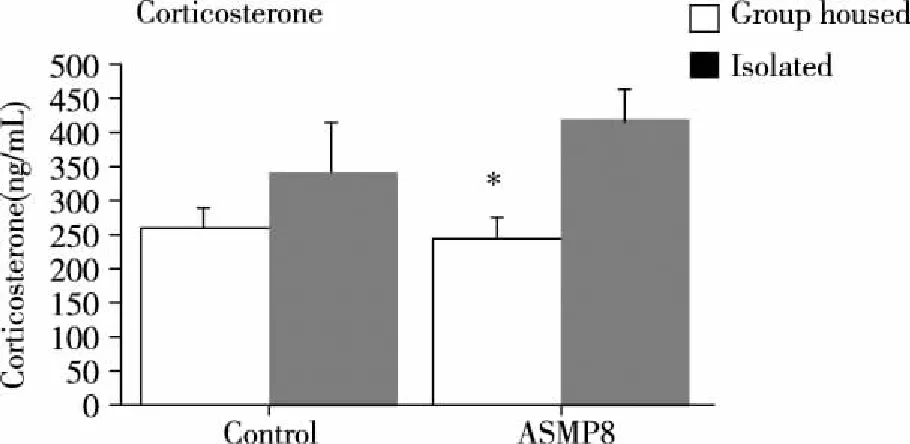
Fig 3 The plasma corticosterone levels
2.3 Tissue Aβ1-42levels There were very low levels of Aβ1-42in the brains of SAMP8 mice and control mice at 7 months of age.Statistical analysis indicates that there were no genotype and housing effects on Aβ1-42levels[F(1,20)=0.273,P=0.605] on acquisition after 6 months of isolation stress. Isolation housing was not correlated with increases in brain tissue Aβ1-42levels(P>0.05,Fig 4). We did not find any plaques in the brain slides in both stressed control and SAMP8 mice.
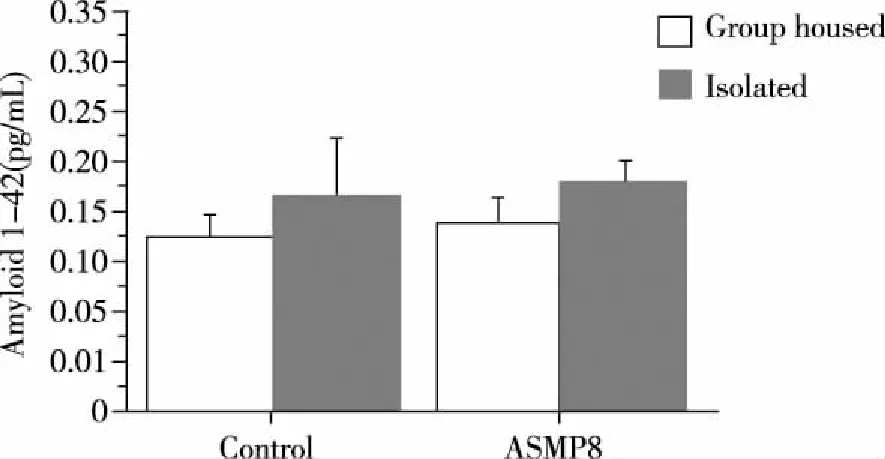
Fig 4 The level of Aβ
2.4 Hippocampal Volume There was a significant effect of housing condition [F(1,20)=96.33,P<0.0001], but no effect of genotype [F(1,20)=0.453,P=0.508]. However, there was an interaction between genotype and housing condition [F(1,20)=7.181P=0.0144] on hippocampal volume (Fig 5).Post-hoc test showed that isolation housing significantly decreased the volume of the hippocampus in both SAMP8 and Control mice (bothP’s=0.03), although the magnitude of volume decrease was somewhat larger in SAMP8 than control mice. (*P<0.05;**P<0.01).
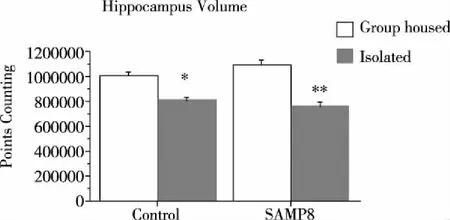
Fig 5 The hippocampal volume
2.5 Protein carbonyl There was a significant effect of housing condition [F(1,31)=9.752,P=0.0039], but no effect of strain [F(1,31)=0.091,P=0.77], nor strain x housing condition interaction on protein carbonyl levels. Post-hoc test showed that isolation housing significantly increased the protein carbonyl in brain tissue in both SAMP8 and control as compared with un-stressed groups (bothP’s=0.045,Fig 6). (*P<0.05).
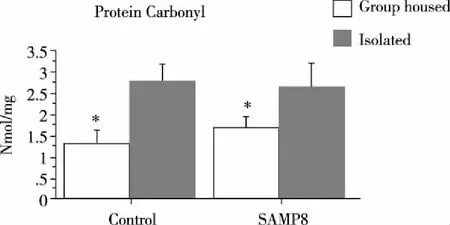
Fig 6 The level of protein carbonyl
3 Discussions
In this study, we evaluated the effect of chronic stress on amyloid level and memory function in SAMP8 mice, a non-transgenic mouse model of AD. We found that colonic isolation stress significantly exacerbated the memory deficits in SAMP8 mice at 6 months of age. Colonic isolation stress also significantly decreased hippocampus volume and increased protein carbonyl in brain, but the degrees of the change was similar to the control groups.Although in this study, we did not find changes of mouse soluble Aβ levels and no amyloid plaques were detected after 6 months of isolation stress, we can not conclude that stress has no effect on Aβ level or APP on SAMP8 mice. A possible explanation for the negative results was because of the lower level of Aβ1-42at 7 months of age, which may not be sensitive enough for detection of variation.Since studies indicate that APP and Aβ level did not increase until 12 months old or later in SAMP8 mice, future studies to investigate the stress effect on Aβ levels or APP in the prolonged stress time point or aging SAMP8 mice are necessary.
Stress has been associated with reductions in hippocampal volume in both humans and animals[30-31], and previously we observed decreased hippocampal volumes in association with isolation stress in Tg2576 mice[32]. Therefore it was not surprising to see SAMP8 mice showing decreased hippocamal volumes. However, similar patterns of results observed in both control and SAMP8 mice suggests stress induced memory deficits in SAMP8 was not because of the hippocampal volumes.
Giving SAMP8 mice are characteristic of premature memory loss[33-34], it was not surprising that SAMP8 mice were more vulnerable to chronic behavioral stress on memory function. There are multiple mechanisms that may cause the memory deficits in SAMP8 mice[35-36]. The mechanisms causing this vulnerability were not clear. Based on the significantly decreased hippocampus volume and increased protein carbonyl levels in isolated mice, we believe that oxidative stress and memory function related anatomic structure atrophy might be involved.
[References]
[1] Dong H, Goico B, Martin M, et al. Modulation of hippocampal cell proliferation, memory, and amyloid plaque deposition in APPsw (Tg2576) mutant mice by isolation stress[J]. Neuroscience, 2004,127(3):601-609.
[2] Wilson R S,Arnold S E,Schneider J A, et al. Chronic psychological distress and risk of Alzheimer’s disease in old age[J].Neuroepidemiology, 2006,27(3):143-153.
[3] Wilson R S, Arnold S E, Schneider J A, et al. Chronic distress, age-related neuropathology, and late-life dementia[J]. Psychosom Med, 2007,69(1):47-53.
[4] Dong H, Yuede C M, Yoo H S, et al. Corticosterone and related receptor expression are associated with increased beta-amyloid plaques in isolated Tg2576 mice[J]. Neuroscience,2008,155(1):154-163.
[5] Carroll J C, Iba M, Bangasser D A, et al. Chronic stress exacerbates tau pathology, neurodegeneration, and cognitive performance through a corticotropin-releasing factor receptor-dependent mechanism in a transgenic mouse model of tauopathy[J].J Neurosci, 2011,31(40):14436-14449.
[6] Umegaki H, Ikari H, Nakahata H, et al. Plasma cortisol levels in elderly female subjects with Alzheimer’s disease: a cross-sectional and longitudinal study[J]. Brain Res, 2000,881(2):241-243.
[7] Pedersen W A, Wan R, Mattson M P. Impact of aging on stress-responsive neuroendocrine systems[J]. Mech Ageing Dev,2001,122(9):963-983.
[8] Näsman B, Olsson T, Viitanen M, et al. A subtle disturbance in the feedback regulation of the hypothalamic-pituitary-adrenal axis in the early phase of Alzheimer’s disease[J].Psychoneuroendocrinology,1995,20(2):211-220.
[9] Swaab D F, Bao A M, Lucassen P J. The stress system in the human brain in depression and neurodegeneration[J].Ageing Res Rev,2005,4(2):141-194.
[10] Davis K L,Davis B M,Greenwald B S, et al. Cortisol and Alzheimer’s disease, I: Basal studies[J]. Am J Psychiatry, 1986,143(3):300-305.
[11] Weiner M F,Vobach S, Olsson K,et al. Cortisol secretion and Alzheimer’s disease progression[J].Biol Psychiatry,1997,42(11):1030-1038.
[12] Peskind E R, Wilkinson C W, Petrie E C, et al. Increased CSF cortisol in AD is a function of APOE genotype[J]. Neurology, 2001,56(8):1094-1098.
[13] Csernansky J G, Dong H, Fagan A M, et al. Plasma cortisol and progression of dementia in subjects with Alzheimer-type dementia[J]. Am J Psychiatry, 2006,163(12):2164-2169.
[14] Jeong Y H, Park C H, Yoo J, et al. Chronic stress accelerates learning and memory impairments and increases amyloid deposition in APPV717I-CT100 transgenic mice, an Alzheimer's disease model[J]. Faseb J, 2006,20(6):729-731.
[15] Lee K W, Kim J B, Seo J S, et al. Behavioral stress accelerates plaque pathogenesis in the brain of Tg2576 mice via generation of metabolic oxidative stress[J]. J Neurochem, 2009,108(1):165-175.
[16] Green K N, Billings L M, Roozendaal B, et al. Glucocorticoids increase amyloid-beta and tau pathology in a mouse model of Alzheimer’s disease[J]. J Neurosci, 2006,26(35):9047-9056.
[17] Kang J E, Cirrito J R, Dong H, et al. Acute stress increases interstitial fluid amyloid-beta via corticotropin-releasing factor and neuronal activity[J]. Proc Natl Acad Sci U S A, 2007,104(25):10673-10678.
[18] Dong H, Murphy K M, Meng L, et al. Corticotrophin releasing factor accelerates neuropathology and cognitive decline in a mouse model of Alzheimer’s disease[J]. J Alzheimers Dis, 2012,28(3):579-592.
[19] Rissman R A, Lee K F, Vale W, et al. Corticotropin-releasing factor receptors differentially regulate stress-induced tau phosphorylation[J]. J Neurosci, 2007,27(24):6552-6562.
[20] Rissman R A, Staup M A, Lee A R, et al. Corticotropin-releasing factor receptor-dependent effects of repeated stress on tau phosphorylation, solubility, and aggregation[J]. Proc Natl Acad Sci U S A, 2012,109(16):6277-6282.
[21] Yagi H, Katoh S, Akiguchi I, et al. Age-related deterioration of ability of acquisition in memory and learning in senescence accelerated mouse: SAM-P/8 as an animal model of disturbances in recent memory[J]. Brain Res,1988,474(1):86-93.
[22] Poon H F, Castegna A, Farr S A, et al. Quantitative proteomics analysis of specific protein expression and oxidative modification in aged senescence-accelerated-prone 8 mice brain[J]. Neuroscience, 2004,126(4):915-926.
[23] Kumar V B,Franko M, Banks W A, et al. Increase in presenilin 1 (PS1) levels in senescence-accelerated mice (SAMP8) may indirectly impair memory by affecting amyloid precursor protein (APP) processing[J]. J Exp Biol, 2009,212(Pt 4):494-498.
[24] Erickson M A, Niehoff M L, Farr S A, et al. Peripheral administration of antisense oligonucleotides t argeting the amyloid-β protein precursor reverses AβPP and LRP-1 overexpression in the aged SAMP8 mouse brain[J]. J Alzheimers Dis, 2012,28(4):951-960.
[25] Butterfield D A, Poon H F. The senescence-accelerated prone mouse (SAMP8): a model of age-related cognitive decline with relevance to alterations of the gene expression and protein abnormalities in Alzheimer’s disease[J]. Exp Gerontol,2005,40(10):774-783.
[26] Chiba Y, Shimada A, Kumagai N, et al. The senescence-accelerated mouse (SAM): a higher oxidative stress and age-dependent degenerative diseases model[J]. Neurochem Res, 2009,34(4):679-687.
[27] Takeda T, Hosokawa M, Takeshita S, et al. A new murine model of accelerated senescence[J]. Mech Ageing Dev,1981,17(2):183-194.
[28] Dong H, Csernansky C A, Martin M V,et al. Acetylcholinesterase inhibitors ameliorate behavioral deficits in the Tg2576 mouse model of Alzheimer’s disease[J]. Psychopharmacology (Berl),2005,181(1):145-152.
[29] Zamora B M, Jiang M, Wang Y, et al. Decreased blastocyst production in mice exposed to increased rack noise[J]. J Am Assoc Lab Anim Sci, 2009,48(5):486-491.
[30] Sapolsky R M. Glucocorticoid toxicity in the hippocampus: temporal aspects of neuronal vulnerability[J]. Brain Res, 1985,359(1-2):300-305.
[31] Bremner J D. Does stress damage the brain[J].Biol Psychiatry,1999,45:797-805.
[32] Dong H, Yuede CM, Coughlan C, et al. Effects of memantine on neuronal structure and conditioned fear in the Tg2576 mouse model of Alzheimer’s disease[J].Neuropsychopharmacology,2008,33(13):3226-3236.
[33] Cheng X R, Cui X L, Zheng Y, et al. Nodes and biological processes identified on the basis of network analysis in the brain of the senescence accelerated mice as an Alzheimer’s disease animal model[J]. Front Aging Neurosci, 2013,5(29):65.
[34] Cheng X R, Zhou W X, Zhang Y X. The behavioral, pathological and therapeutic features of the senescence-accelerated mouse prone 8 strain as an Alzheimer’s disease animal model[J]. Ageing Res Rev, 2013,21(13):13-37.
[35] Akbor M M, Tomobe K, Yamada T, et al. Possible involvement of Hcn1 ion channel in learning and memory dysfunction in SAMP8 mice[J]. Biochem Biophys Res Commun, 2013,441(1):25-30.
[36] Armbrecht H J, Siddiqui A M, Green M, et al. SAMP8 mice have altered hippocampal gene expression in long term potentiation, phosphatidylinositol signaling, and endocytosis pathways[J]. Neurobiol Aging,2014,35(1):159-168.
猜你喜欢
声屏世界(2022年13期)2022-10-08
小小说月刊(2022年14期)2022-07-18
学苑创造·A版(2022年8期)2022-06-21
校园英语·下旬(2019年11期)2019-11-28
唐都学刊(2018年5期)2018-09-25
医学信息(2017年24期)2017-12-05
科技创新导报(2016年27期)2017-03-14
足球俱乐部(2016年19期)2016-11-26
海外星云 (2014年24期)2015-01-19
环球时报(2009-04-13)2009-04-13