
Diversity characterization and association analysis of agronomic traits in a Chinese peanut(Arachis hypogaea L.)mini-core collection
2014-11-22 03:37HuifangJiangLiHuangXiaopingRenYuningChenXiaojingZhouYoulinXiaJiaquanHuangYongLeiLiyingYanLiyunWanandBoshouLiao
Huifang Jiang,Li Huang,Xiaoping Ren,Yuning Chen,Xiaojing Zhou,Youlin Xia,Jiaquan Huang,Yong Lei,Liying Yan,Liyun Wan and Boshou Liao*
1Key Laboratory of Biology and Genetic Improvement of Oil Crops,Ministry of Agriculture,Oil Crops Research Institute of the Chinese Academy of Agricultural Sciences,Wuhan 430062,China,2Nanchong Academy of Agricultural Sciences,Nanchong 637000,China.†These authors contributed equally to this work.*Correspondence:lboshou@hotmail.com
INTRODUCTION
Peanut(Arachis hypogaea L.)is one of the most important oilseed crops in the world and is cultivated in more than 100 countries,with the annual production of 38.6 million tons(http://faostat.fao.org/faostat/collections?subset=agriculture 2011).The largest producers of peanut are China and India,followed by the United States.Peanut is mainly used to produce food and edible oil for human consumption,and also used as a source for protein feed in the animal industry.The major breeding aim for peanut breeders is to increase grain yield,which is directly and indirectly influenced by agronomic traits(Gomes and Lopes 2005).Thus,understanding the genetic underpinnings of agronomic traits is likely to contribute to enhanced target traits and even the peanut grain yield.
Most agronomic traits in plants are quantitative traits and linkage mapping based on segregating populations from parent crossing was extensively used to dissect the genetic base of target traits.Large amounts of quantitative trait loci(QTLs)have been identified by linkage mapping,and several genes have been cloned in model crop species,indicating the effectiveness of linkage mapping.In peanut,a simple sequence repeat(SSR)-based genetic map has been developed recently and some linkage-mapping studies have been undertaken to identify the QTLs for targeting economically important traits such as drought tolerance(Ravi et al.2011),resistance to late leaf spot and rust(Khedikar et al.2010)and quality traits(Sarvamangala et al.2011).In addition,bulked segregant analysis was used to identify QTLs for pod-and seed-related traits(Gomez Selvaraj et al.2009).However,the main bottlenecks for further progress of linkage mapping in peanut are(i)low level of polymorphism between two parent lines of segregation population in cultivated peanut;and(ii)a long time to develop the segregating population.
Association analysis,utilizing linkage disequilibrium(LD)and historical recombination in natural population,is an alternative powerful tool for high-solution mapping of agriculturally important quantitative traits in crop species(Zhao et al.2009;Huang et al.2010;Ali and Yan 2012;Li et al.2013;Wei et al.2013).Compared with the linkage analysis,association analysis has advantages in terms of resolution,speed,and allelic range(Flint-Garcia et al.2003).Linkage disequilibrium plays a central role in association analysis,the level of which will determine the number and density of markers,and experimental design needed to perform an association analysis(Flint-Garcia et al.2003).Moreover,owing to the existence of population structure of large germplasm collections,the probability of spurious association between markers and traits may be enhanced.In plant species,two major statistical methods,structure association(Pritchard et al.2000;Falush et al.2003)and mixed-linear model(MLM)(Yu et al.2006;Zhang et al.2010b),were popularly used to overcome this problem in recent genome wide association studies(GWAS).Both statistical methods have been successful to control the false positives of association analysis in previous studies(Breseghello and Sorrells 2006;Zhao et al.2007;Murray et al.2009).
The core collection of germplasm resources are valuable for association mapping,and have been established in most crop species,such as rice(Zhang et al.2010a),wheat(Hao et al.2006),maize(Yang et al.2010),and Brassica napus(Xiao et al.2012).In previous studies,a core collection comprising 576 A.hypogaea genotypes and a mini-core collection comprising 298 accessions were established in the Oil Crops Research Institute of the Chinese Academy of Agricultural Sciences in China,which represented most of the genetic diversity of Chinese cultivated peanut(Jiang et al.2008a,2008b).
In the present study,the mini-core collection of 298 peanut accessions was used as an association mapping panel,which was genotyped by 109 genome-wide SSR markers and phenotyped by 15 agronomic traits across two climate locations in two consecutive years.The objectives of this study were to(i)assess genetic diversity and population structure of this mini-core collection,(ii)evaluate the performances of different statistics’methods on the association analysis,and(iii)identify SSR markers associated with the evaluated agronomic traits.

Figure 1.Population structure of 298 accessions in the Chinese peanut mini-core collectionEach bar represents each peanut accession and the red and blue colors represented the membership from the groups P1 and P2.All the accessions were assigned into P1,P2,and mixed group,respectively,according to their membership possibility.
RESULTS
Population structure and relative kinship
The population structure of the peanut mini-core collection containing 298 accessions was calculated using 109 SSR markers and a model-based software STRUCTURE.The structure analysis was performed by setting the possible number of groups(k),ranging from 1 to 10,with five replications for each k.The LnP(D)value for each given k increased with the increase of k and the most significant change was observed when k was increased from 1 to 2,which suggested the number of clusters was set to 2(Figure S1).The first group,called P1,comprised 104 accessions,of which 88.5%accessions were ssp.fastigiata,10.6%accessions were spp.hypogaea,and 0.9%accessions were intermediate type.The second group,named P2,included 115 accessions,of which 76.5%accessions were confirmed as spp.hypogaea,16.5%accessions were spp.fastigiata,and 7.0%accessions were intermediate type.The remaining 79 accessions had membership probabilities lower than 0.75 in any given group and were thus classified as“Mixed” (Table S1,Figure 1).In spite of the discrepancies,the population structure is obviously associated with the botanical varieties.In the principal component analysis(PCA)of the panel,the first two principal components explained 17.99%and 3.33%of the total variation(Figure 2).Principal component analysis plots of the top two principal components of 298 accessions based on STRUCTURE result indicated that the top two principal components clearly separated these groups.
Based on the SSR data,the average relative kinship between any two accessions was 0.0806.About 52.5%of the pairwise kinship estimates were equal to 0,and remaining kinship estimates ranged from 0 to 0.5,with a continuously decreasing number of pairs falling in higher estimate categories(Figure 3).These results indicated that most accessions have no or weak kinship with the other accessions in the panel,which might be attributed to the broad range collection of genotypes and the exclusion of similar genotypes before analysis.

Figure 2.Plot of principal component analysis of 298 accessions based on structure resultsThe red triangles,blue rectangles,and gray dots represented the accessions from the P1,P2,and mixed groups,respectively.
Population differentiation
Analysis of molecular variance(AMOVA)was performed and pairwise F statistics(FST)were estimated to investigate population differentiation.Analysis of molecular variance results indicated that 25.02%(P<0.01)of the total molecular variation in the mini-core collection was attributed to genetic differentiation among groups,and 74.98%(P<0.01)within groups(Table 1).Pairwise FSTshowed a high level of differentiation between P1 and P2(FST=0.3804,P<0.01),but relatively low level of differentiation between Mixed and P1(FST=0.1468,P<0.01),Mixed and P2(FST=0.1496,P<0.01).A similar pattern of differentiation among groups was also revealed using the Nei’s(1973)minimum distance,which ranged from 0.0435(Mixed with P2)to 0.1705(P1 with P2)(Table S3).
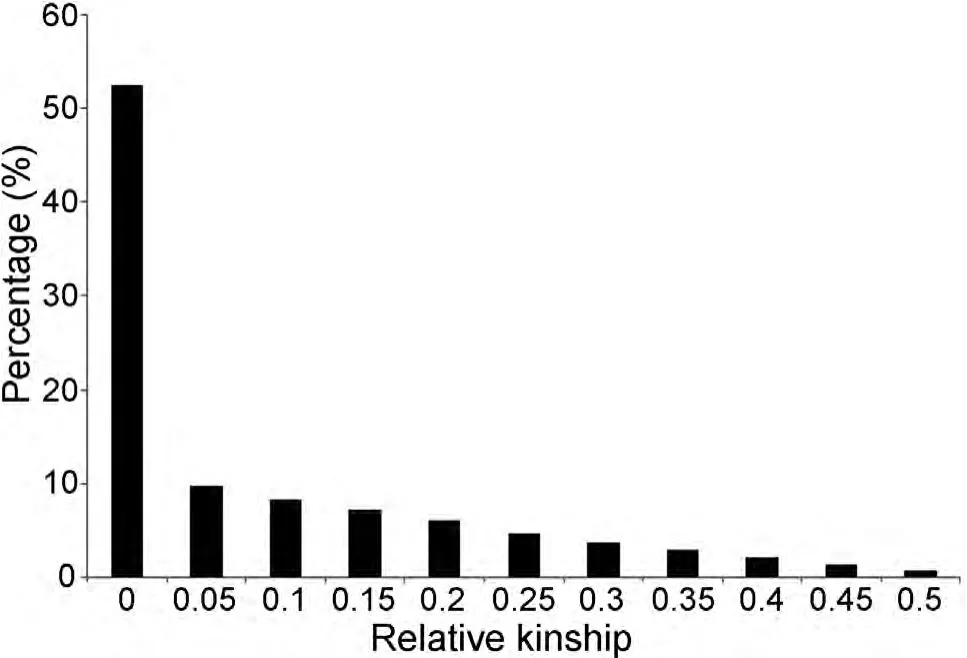
Figure 3.Distribution of pairwise relative kinship estimates between 298 peanut accessions of the peanut mini-core collectionFor simplicity,only percentages of relative kinship estimates ranging from 0 to 0.5 were shown.
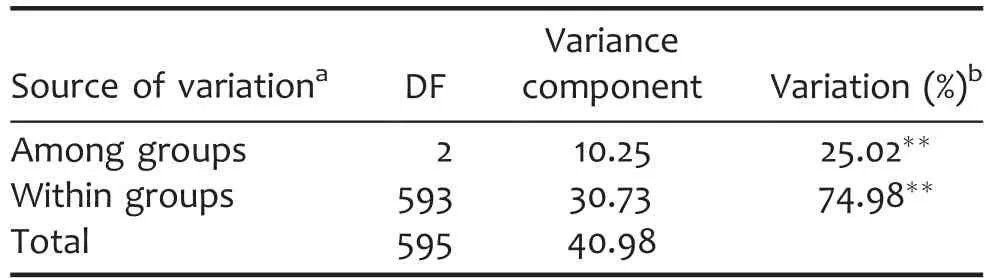
Table 1.Analysis of molecular variance(AMOVA)among groups based on structure analysis
Allelic diversity within groups
Genetic diversity of the peanut mini-core collection of 298 accessions was estimated using 109 SSR markers.A total of 554 SSR alleles were identified in the mini-core collection(5.1 alleles per marker)(Table 2).Of these,only nine alleles(1.62%)were detected in a single accession.Within the whole mini-core collection,major allele frequency,gene diversity and polymorphic information content(PIC)were 0.801,0.265,and 0.213,respectively(Table 2).The Mixed group contained the least number of accessions among three groups,but had the most numbers of alleles and alleles per markers.In addition,Mixed had the lowest major allele frequency(0.807),the highest gene diversity(0.265),and PIC(0.215),respectively,which demonstrated that Mixed had the highest genetic diversity among all groups and had a similar level of genetic diversity compared with the total panel.P2 containing the most accessions had the lowest genetic diversity.In P2,the number of alleles,the number of alleles per marker,major allele frequency,gene diversity,and PIC were 477,4.4,0.885,0.172,and 0.145,respectively.Moreover,the genetic diversity of P1 was between P2 and Mixed(Table 2).
Phenotypic diversity
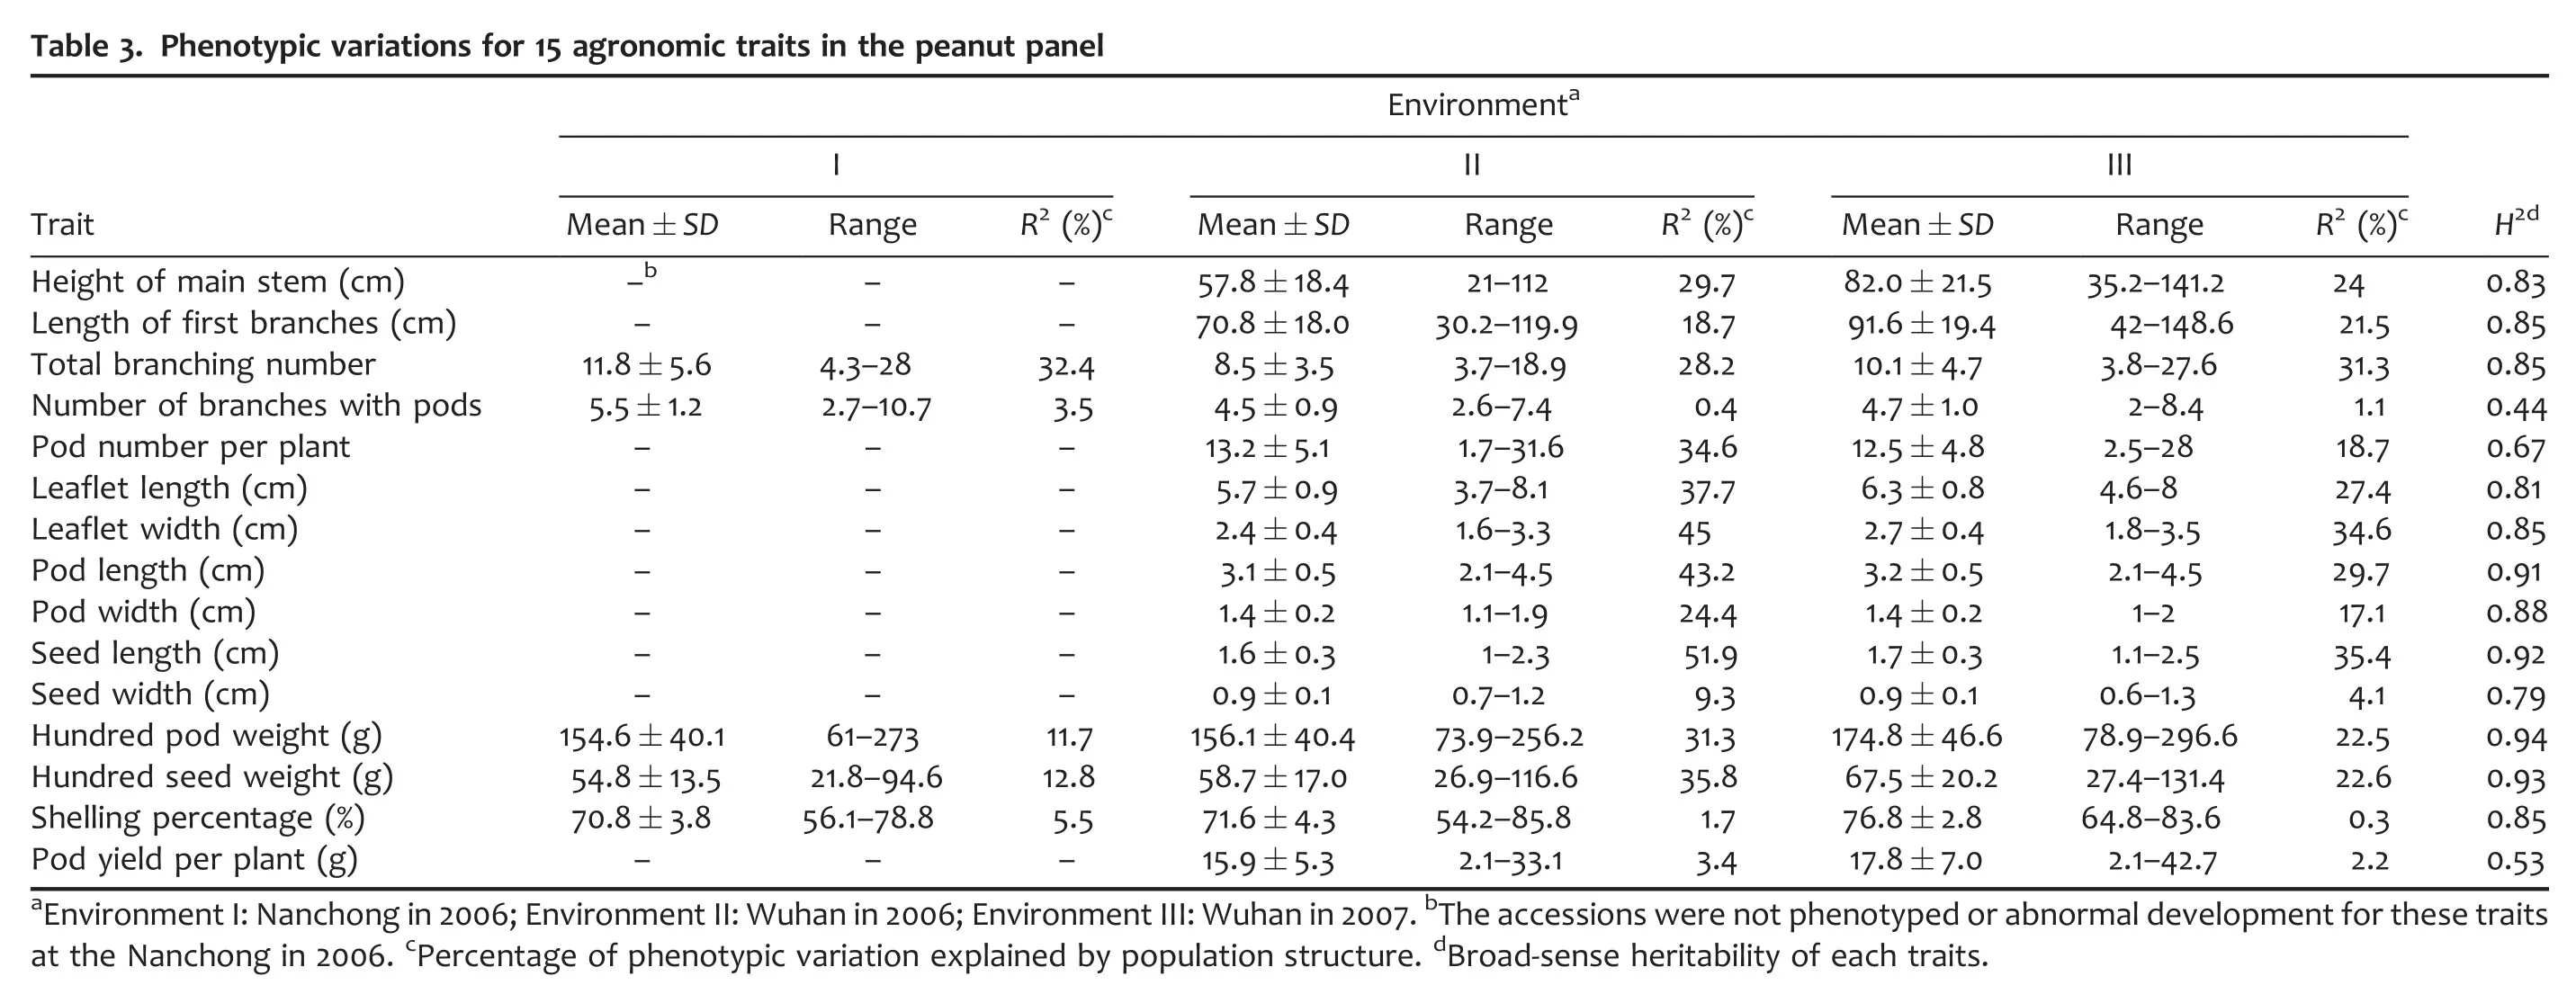
Fifteen agronomic traits for accessions in the mini-core collection were collected in different environments.Each agronomic trait was measured in two or three environments.Some agronomic traits,such as height of main stem,length of first branches,total branching number,hundred seed weight,and pod yield per plant,were influenced strongly by the environment(Figure S2).While,the leaflet width changed stably in different environments,as did pod length,pod width,seed length,seed width,and hundred pod weight(Figure S2).After eliminating the outlier,a broad range of variation was observed for each trait measured in the panel(Table 3).The pod yield per plant in Environment III,which varied from 2.1 to 42.7 with an average of 17.8,had the highest maximum change of 20.4-fold,while shelling percentage in Environment III,which varied from 64.8%to 83.6%with an average of 76.8%,had the lowest change(1.3-fold).
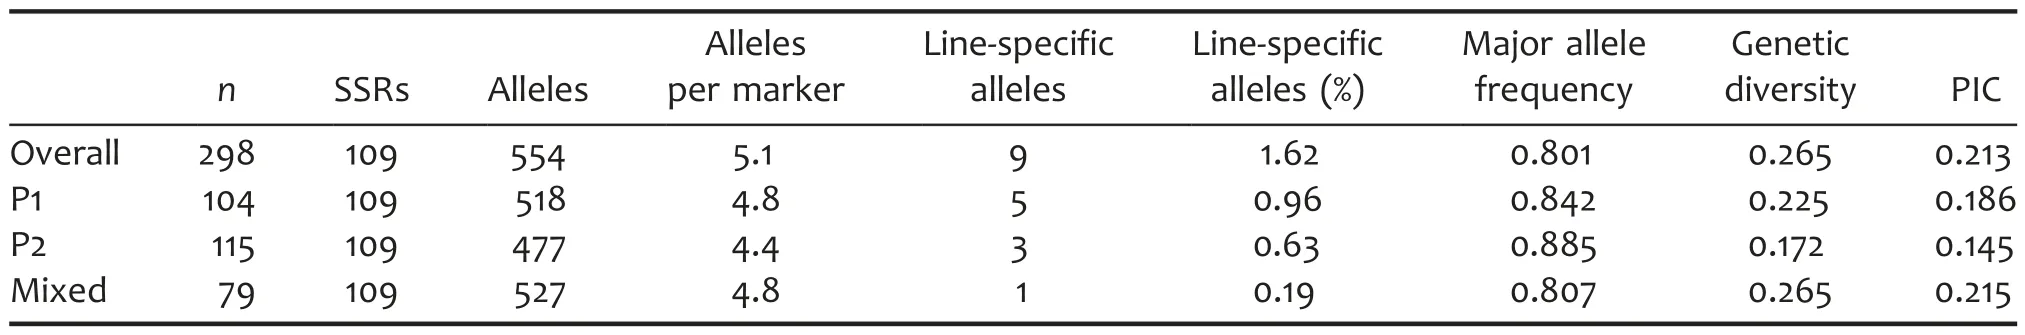
Table 2.Diversity-related summary statistics for all groups defined by STRUCTURE analysis
The broad-sense heritability of almost measured traits was relatively high,ranging from 67%for pod number per plant to 94%for 100-pod weight(Table 3),except for the median level of heritability of number of branches with pods(44%)and pod yield per plant(53%),which indicated that the majority of studied traits were dominated by genetic factors rather than the environmental variation.In addition,the phenotypic variation for each trait was also contributed by the presence of groups within the panel,explaining the phenotypic variation from 0.3%for shelling percentage(Environment III)to 51.9%for seed width(Environment II).Totally,four measured traits in each environment were relatively loosely correlated with population structure,which explained less than 10%of phenotypic variations.
安:当然了,我们刚才所讨论的一切,并不意味着一个功底不足、技术疏漏的普通人可以迅速通过这样的方法来演奏如此之难的作品。而是说,有相当技术的专业学生,在面对这样极具挑战的作品时,可通过这样的方法,达到事半功倍的效果。而且,这样的方法本身也需要极大的智慧!这不仅事关句法的选择、旋律的修饰,更是需要我们时刻思考发力的方法,以及对声音的考量。
Significant correlations were revealed to exist among most of the 15 traits at different levels(Table 4).Absolute values of phenotypic correlations among the 15 traits were at a minimum(r=0.004,P>0.05)between pod number per plant and seed width,and at a maximum(r=0.904,P<0.01)between 100-pod weight and 100-seed weight.For the height of main stem,length of first branches,leaflet length,and leaflet width,positive correlations were revealed between each pair of the four traits.Similarly,positive correlations were revealed between each pair of the eight traits,including number of branches with pods,pod length,pod width,seed length,seed width,100-pod weight,100-seed weight,and pod yield per plant.However,the former four traits were negatively correlated with the latter eight traits.The result indicated that reducing the height of main stem and length of first branches could increase production.
Association analysis
A total of 413 SSR loci with minor allelic frequencies≥0.05 were used for association mapping.For all 15 agronomic traits in the peanut panel,associations were performed to evaluate the performance of three statistical models(Q-simple,Q and Q+K model)for controlling false positives(Figure S3).Generally,the P-value from general linear model(GLM)-simple model greatly deviated from the expected P-value,followed by the Q model,while the P-value from the Q+K model was close to the expected P-value(Figure S3).For some traits,however,the Q model almost had no effect for controlling false positives,such as the number of branches with pods in Environments II and III(Figure S3).
Both number of significant loci and explained phenotypic variance(PVE)had obvious decreases using the Q+K model relative to other models(Table 5).For example,for shelling percentage in Environment I,the total number of significant SSR loci decreased from 62(GLM-simple)to 5(Q+K),and the range of explained PVE decreased from 3.68%to 16.10%(GLM-simple)to 1.43%to 1.87%(Q+K),indicating that the Q+K model could effectively reduce spurious associations.
Based on the Q+K model,association analysis totally detected 89 SSR alleles significantly associated with 15 agronomic traits(Table S4).For height of main stem,eight alleles were detected significant in Environment III,with the PVE from 1.33%to 2.17%.For length of first branches,two and five associated alleles were identified in Environments II and III,respectively,with the PVE from 1.19%to 2.06%.For total branching number,two,five,and two associated alleles were identified in three environments,respectively,with the PVE from 1.59%to 4.81%.For number of branches with pods,one,two,and one significant associated alleles were identified in three environments,respectively,with the PVE from 2.35%to 3.51%.For pod number per plant,two and one significant associated alleles were identified in Environments II and III,respectively,with the PVE from 1.73%to 3.11%.For leaflet length,two and three significant associated alleles were detected in Environments II and III,respectively,with the PVE from 1.52%to 2.65%.For leaflet width,five and two significant associated alleles were identified in Environments II and III,respectively,with the PVE from 1.27%to 2.48%.For pod length,one and three significant associated alleles were identified in Environments II and III,respectively,with the PVE from 1.24%to 2.19%.For pod width,one and three significant associated alleles were detected in Environments II and III,respectively,with the PVE from 1.13%to 1.99%.For seed length,one and three significant associated alleles were detected in Environments II and III,respectively,with the PVE from 1.14%to 1.32%.For seed width,one and one significant associated alleles were identified in Environments II and III,respectively,with the PVE from 1.45%to 2.20%.For 100-pod weight,two,two and four significant associated alleles were identified in three environments,respectively,with the PVE from 1.22%to 2.26%.For 100-seed weight,five,one,and two significant associated alleles were identified in three environments,respectively,with the PVE from 1.20%to 1.50%.For shelling percentage,five,two,and two significant associated alleles were detected in three environments,respectively,with the PVE from 1.43%to 2.98%.For pod yield per plant,two and five significant associated alleles were identified in Environments II and III,respectively,with the PVE from 1.94%to 3.29%.
Among these associated alleles,eight alleles were repeatedly detected in two or three environments(Table 6).The allele 17E1-440 associated with length of first branches was detected both in Environments II and III.The allele 15D3-390 was associated with total branching number in all environments.The allele AC2C5-650 was associated with leaflet length in both Environments II and III.The allele 13A7-400 was associated with leaflet width in both Environments II and III.The allele PM436-400 was associated with seed length in both Environments II and III.The allele 2G3-260 was associated with 100-pod weight in both Environments I and II.The allele PM436-400 was associated with 100-seed weight in all environments.The allele 9B4-260 was associated with shelling percentage in all environments.In addition,among these associated alleles,15 alleles were commonly associated with multiple agronomic traits(Table S4).The allele PM436-400 was associated with most of the agronomic traits,including pod length,pod width,seed length,100-pod weight,and 100-seed weight.The result was consistent with the result of positive correlation among these traits.
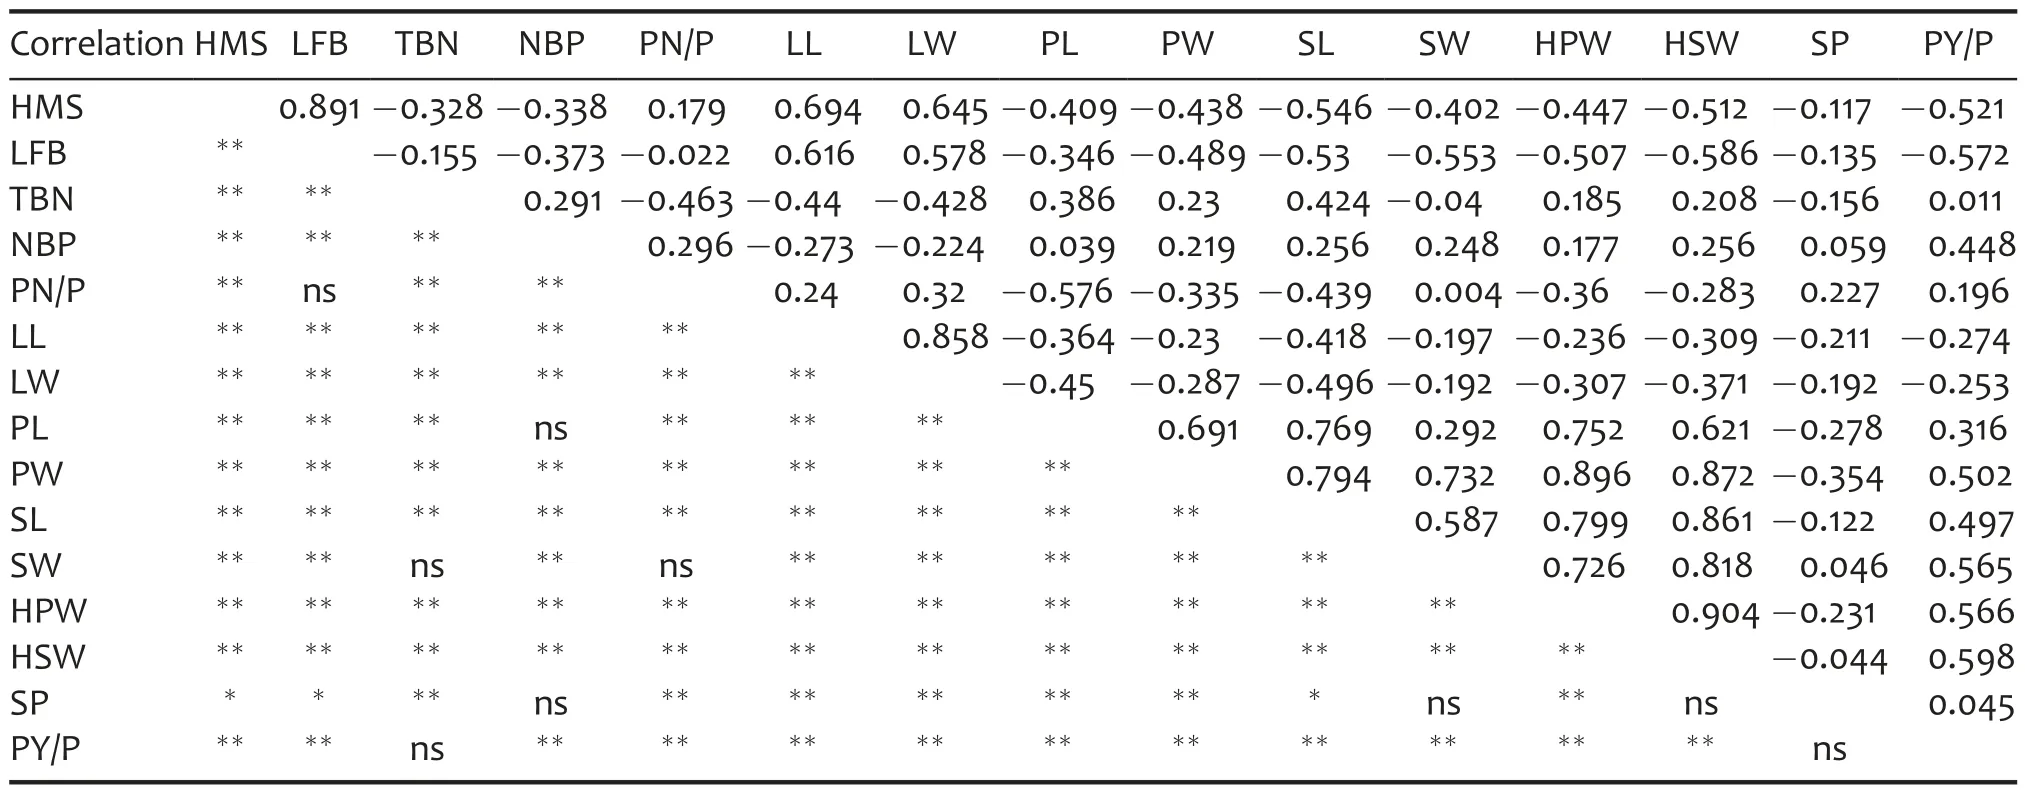
Table 4.Correlation analysis for the 15 agronomic traits
DISCUSSION
Chinese peanut mini-core collection
Based on the morphological and biochemical characters of around 6,390 accessions of cultivated peanut collected in China,we constructed a core collection consisting of 576 accessions and a mini-core collection consisting of 298 accessions,which were 9.01%and 4.66%of the entire collection,respectively(Jiang et al.2008a,2008b).In addition,another two separate peanut core collections were established in the United States and India.The US peanut core collection containing 831 accessions and the corresponding mini-core collection containing 112 accessions were established from 7,432 accessions(Holbrook et al.1993;Holbrook and Dong 2005).The International Crop Research Institute for the Semi-Arid Tropics(ICRISAT)peanut core collection containing 1,704 accessions and the corresponding mini-core collection containing 184 accessions were established from 14,310 accessions(Upadhyaya et al.2002,2003).In the peanut germplasm resources all over the world,there are six botanical varieties(var.hypogaea,var.hirsuta,var.aequatoriana,var.peruviana,and var.vulgaris)that are classified based on morphological traits collected from the field(Krapovickas and Gregory 1994).With the development of peanut breeding improvement in China,some accessions that were generated from the hybridization between different varieties,but did not belong to any of six varieties were called intermediate type.Compared the US and ICRISAT peanut mini-core collection,there is no var.aequatoriana and var.peruviana in the Chinese peanut mini-core collection.It is,however,abundant in var.hirsuta and intermediate type that are not included in the US and ICRISAT peanut mini-core collection.The analysis of agronomic traits genetic diversity showed that there were significant differences in the proportion of botanical varieites and main botanical traits between the Chinese peanut core collection and ICRISAT peanut mini-core collection(Jiang et al.2008b).Therefore,Chinese peanut core collection and ICRISAT mini-core collection could complement each other.To date,there have been no reports comparing these three minicore collections using molecular marker technology.Although the present study indicated that the Chinese peanut mini-core collection is suitable for association analysis,it should be necessary to combine the Chinese peanut mini-core collection with other mini-core collections in order to cover all the peanut botanical varieties in future study.
Genetic diversity in the peanut panel
A suitable association mapping panel should encompass as much molecular diversity as can be reliably measured(Flint-Garcia et al.2005).An average of 5.1 alleles per marker over 109 SSRs,the mean PIC of 0.213,and the mean genetic diversity of 0.265 were observed in Chinese mini-core collection containing 298 accessions.The values were lower than those in the US mini-core collection containing 94 accessions(an average of 8.1 alleles per marker over 81 SSRs,the mean PIC of 0.53,and the mean genetic diversity of 0.59)(Wang et al.2011).The mean major allele frequency in the Chinese and US mini-core collections was 0.801 and 0.52,respectively.Thus it can be seen that the Chinese peanut minicore collection has less genetic diversity than the US peanut mini-core collection.The difference in SSR allelic richness can be explained by the number of accessions analyzed,the choice of germplasm,the number of SSRs,and the SSR repeat type.In addition,we found nine line-specific alleles in the Chinese peanut panel,which were not observed in the US peanut panel.These line-specific alleles offer a source of genetic variation for further crop improvement and for dissecting the genetic basis of quantitative traits in peanut.
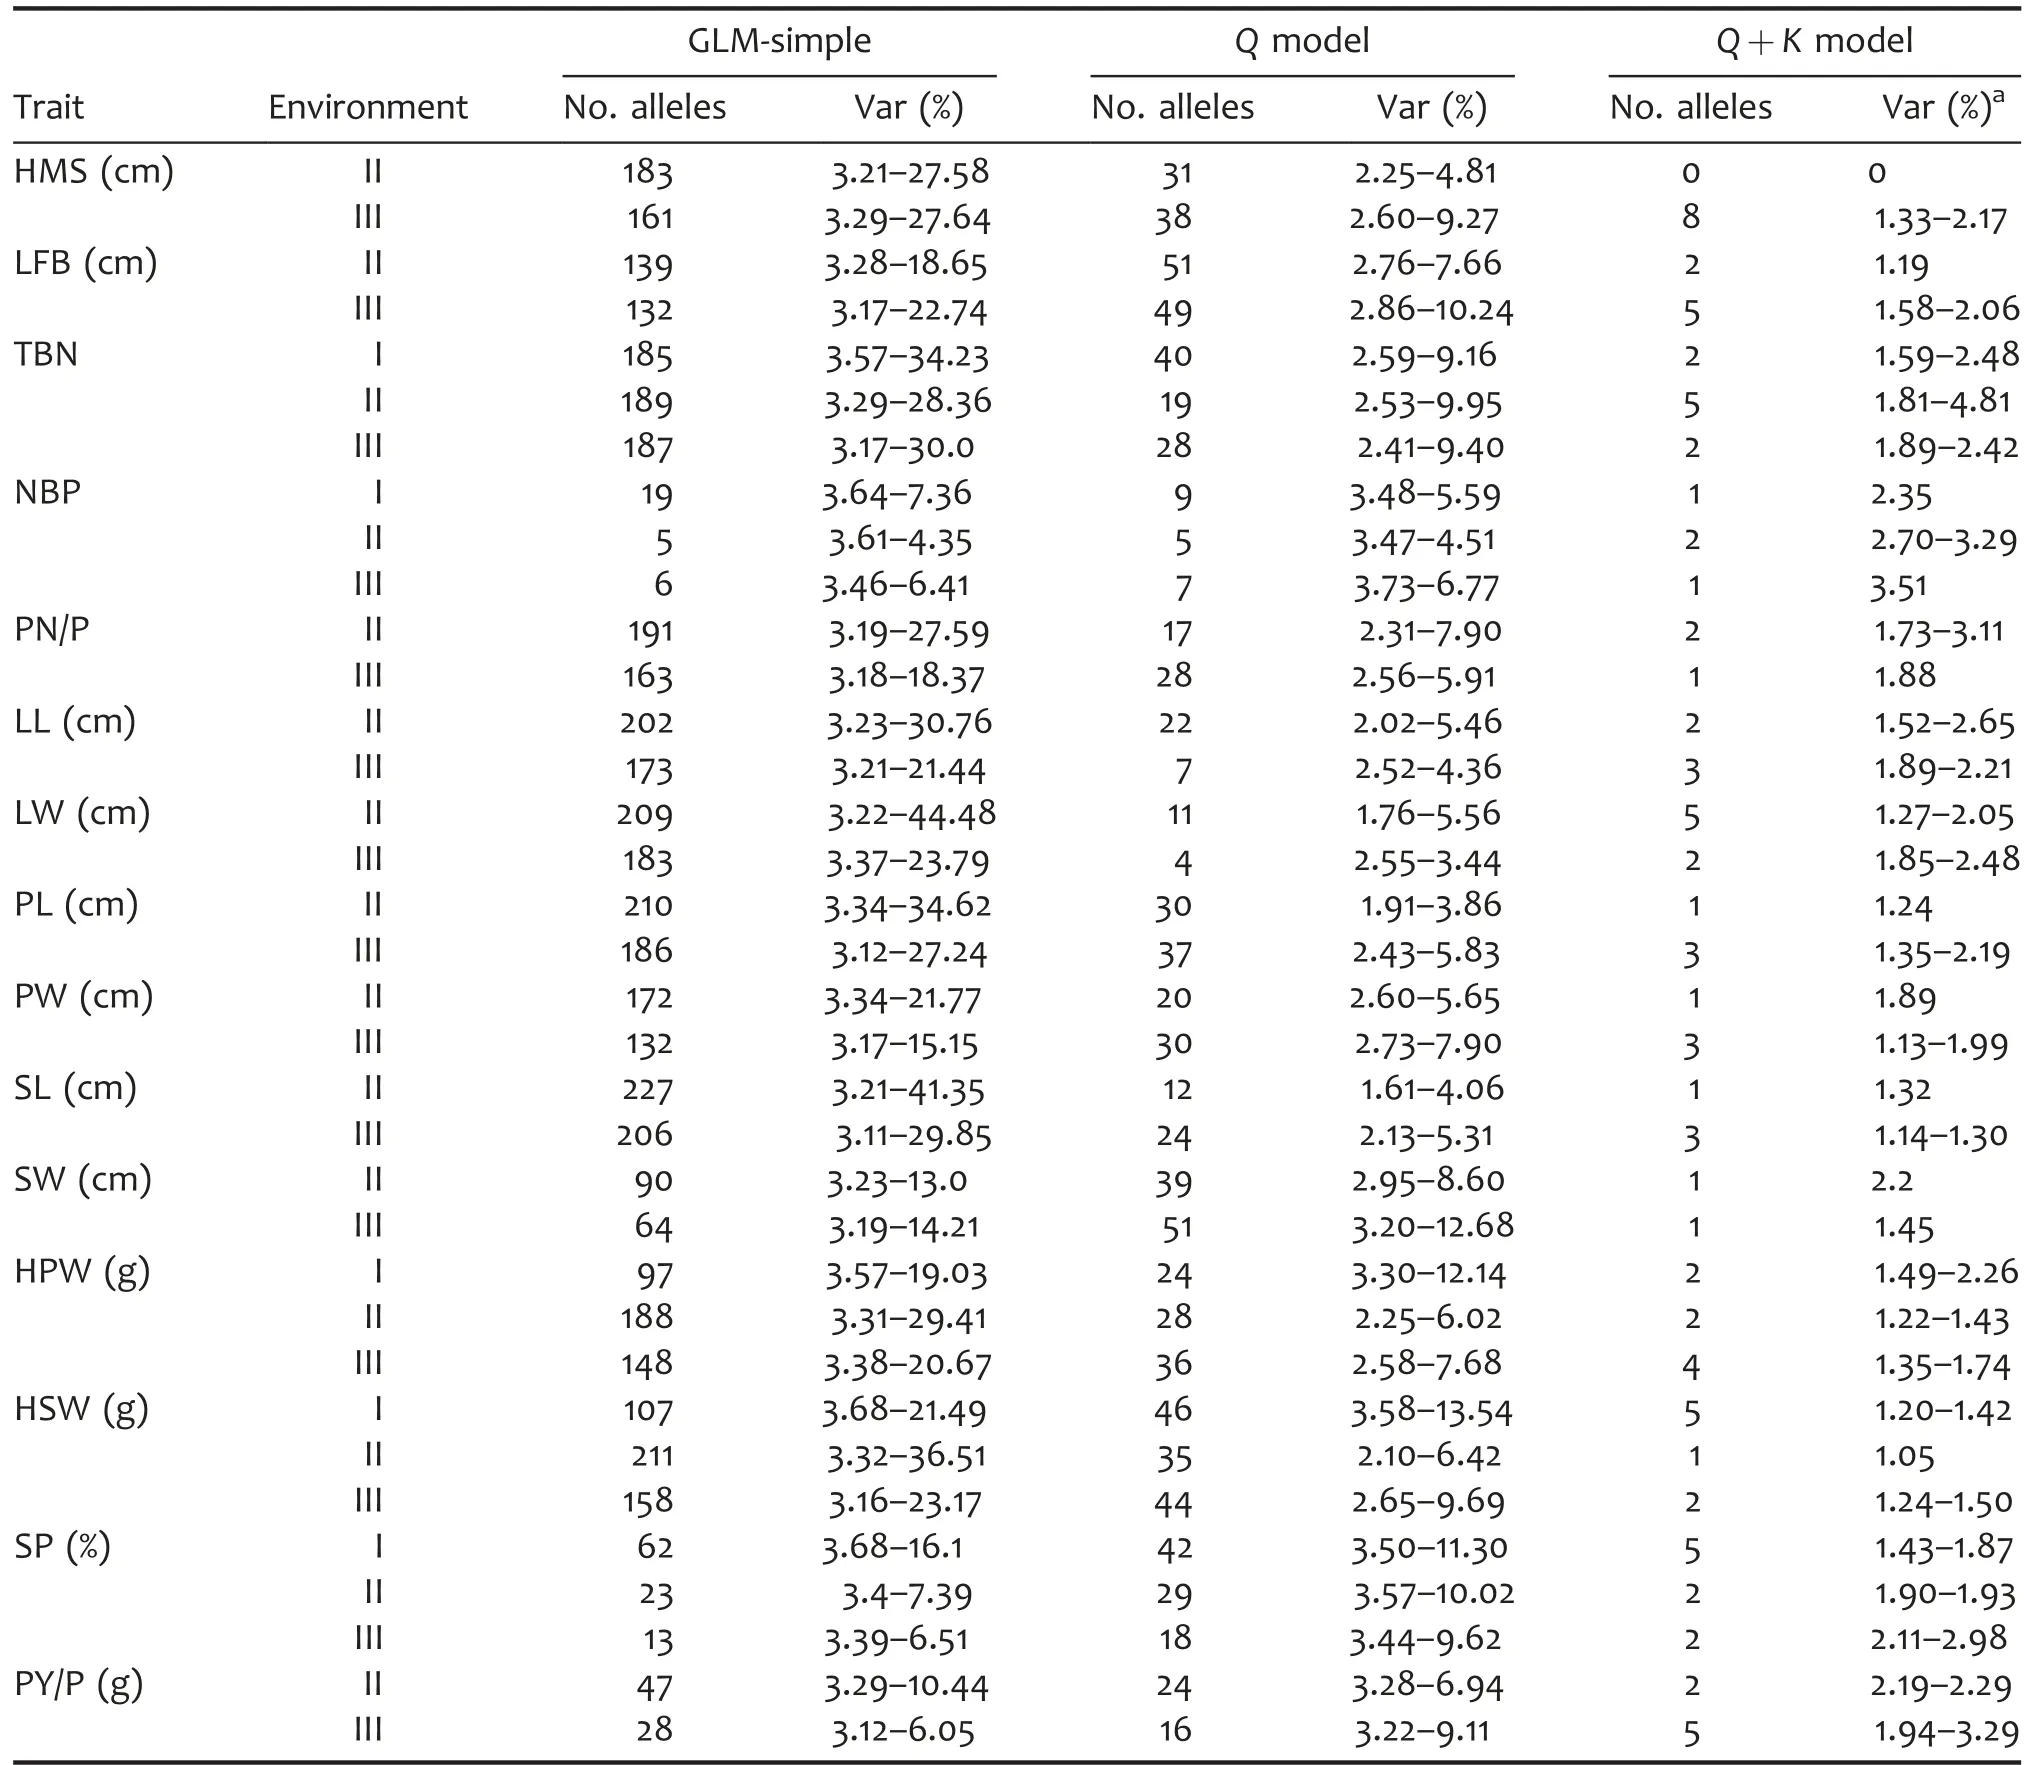
Table 5.Association summary for 15 agronomic traits in different environments
Influence of population structure and relative kinship on association study
Association mapping,which was developed as a necessity for large-scale human studies,is commonly used in conjunction with linkage mapping in plant genetic studies.The strengths of association mapping lie in its resolution and allelic richness,but spurious associations arising from historical relationships and selection patterns need to be accounted for in statistical analyses.In the present study,the Chinese peanut mini-core collection was assigned to three groups by STRUCTURE analysis named P1,P2,and Mixed,which contained 104,115,and 79 accessions,respectively(Table S2).88.5%of the accessions in the P1 group were ssp.fastigiata,and 76.5%of the accessions in the P2 group were ssp.hypogaea.STRUCTURE results and PCA plots indicated that the population structure was associated with the botanical varieties,which was consistent with the result of US peanut mini-core collections(Wang et al.2011)and that of the ICRISAT peanut mini-core collections(Huang et al.2012b).It indicated that the population structure existed in the peanut mini-core collection,and reflected the taxonomic relationship between the accessions.The kinship result revealed that the relative kinship between the accessions was relatively far,which may arise from the heterogeneity and was representative of the mini-core collection.In this panel,association analysis was performed for 15 agronomic traits of three environments using the GLM-simple model,the Q model,and the Q+K model.The quantile–quantile plots indicated that the Q+K model performed best for all agronomic traits in each environment,and the Q model performed similarly to the GLM-simple model for some agronomic traits in some environments,which revealed that population structure had no effect on some agronomic traits in some environments.For the number of branches with pods,population structure had no effect in Environments II and III,which was consistent with the result of the percentage of phenotypic variation explained by population structure.It seems that the Q+K model was sufficient to minimize false–positive associations,especially for some traits not influenced by population structure,which was consistent with other model simulations and comparisons(Yu et al.2006;Zhu and Yu 2009;Larsson et al.2013).

Table 6.Summary of simple sequence repeat(SSR)alleles associated with agronomic traits in at least two environments
Association analysis of 15 agronomic traits
However,in recent years,due to the availability of advanced mapping populations such as recombinant inbred lines and the relatively large number of molecular markers,linkage-mappingbased marker analysis has been undertaken to identify the QTLs for agronomic traits(Gomez Selvaraj et al.2009;Ravi et al.2011).Compared to linkage mapping,association mapping has an ability to detect multiple alleles simultaneously.Therefore,in the present study,we performed association mapping for agronomic traits by using multi-environment phenotypic data.A total of 89 alleles accounted for phenotypic variation with 1.05–4.81%were identified as associated with 15 agronomic traits based on association analysis using the Q+K model(P<0.0024,Table S4),of these,eight alleles were repeatedly detected in two or three environments,and 15 alleles were commonly associated with multiple agronomic traits.These associated alleles were not consistent with the previous studies of Gomez Selvaraj et al.(2009)and Ravi et al.(2011),which can be explained by the different accessions and the different SSRs analyzed.However,comparing the associated analysis result of ICRISAT peanut mini-core collection for agronomic traits(Huang et al.2012b),one allele,the 390 bp allele amplified from SSR marker 15D3,was detected to be associated with shelling percentage in the two germplasm collections.In addition,the 180 bp allele amplified from SSR marker 8D9 and the 275 bp allele amplified from SSR marker PM443 were detected to be associated with height of main stem and leaflet width,respectively,in the present study,while the 155 bp allele amplified from SSR marker 8D9 and the 265 bp allele amplified from SSR marker PM443 were detected to be associated with height of main stem and leaflet width,respectively,in the ICRISAT mini-core collection.These same markers could amplify multiple associated alleles with different effects(Table S4)(Huang et al.2012b),which may be due to the functional differentiation of orthologous genomic regions among evolutionarily related species(Wang et al.2009).Our results demonstrated that this peanut mini-core panel is suitable for association mapping analysis targeting complex quantitative traits with optimal association models.Through association mapping,we were able to identify the accessions harboring the associated alleles with the largest effect for the following molecular breeding program.For example,the variety zh.h1452 harboring the associated alleles 2C11-280,PM436-400,1B9-290,and 19A5-500,which was associated with,and had the potential to enhance the pod width,seed length,100-pod weight,and 100-seed weight by 0.12cm,0.26cm,35.55 g,and 24.16 g,respectively.
MATERIALS AND METHODS
Plant materials and phenotyping
A mini-core collection of 298 A.hypogaea accessions was assembled.These accessions included 125 var.vulgaris,111 var.hypogaea,25 var.fastigiata,21 var.hirsute,and 16 intermediate genotypes with diverse variation.Detailed information of the 298 accessions is listed in Table S1.
The 298 accessions were planted in the farm of the Oil Crops Research Institute of the Chinese Academy of Agricultural Sciences in Wuhan,China,from 2006 to 2007 and on the farm of the Institute of Nanchong Agricultural Science and Technology in Nanchong,China,in 2006,with a randomly complete block design.Each accession was planted in a single row,with 10 plants in each row and 10 cm between plants within each row and 30 cm between rows.Ten plants were selected randomly in each genotype to investigate the height of the main stem,length of first branches,total branching number,number of branches with pods,pod number per plant,leaflet length,leaflet width,pod length,pod width,seed length,seed width,hundred pod weight,hundred seed weight,shelling percentage,and pod yield per plant according to the standard procedures described previously(Jiang et al.2006).
Genotyping
Genomic DNA was extracted from young leaves collected from four to five plants of each accession using a modified cetyltrimethyl ammonium bromide method.The integrity and quality of the DNA was evaluated on a 1%agarose gel by comparison with known concentrations of uncut lambda DNA standard.
A total of 109 SSR markers from different resources were used to genotype the 298 accessions.Simple sequence repeat markers with the prefixes pPGPseq,pPGSseq,TC,IPAHM,Ah,RM,RN,EM,GA,AC,AHBGS,PMc,and PM were obtained from the literature(He et al.2003,2005;Ferguson et al.2004;Moretzsohn et al.2005;Gimenes et al.2007;Proite et al.2007;Cuc et al.2008;Liang et al.2009;Moretzsohn et al.2009).Simple sequence repeat markers with prefixes XY were developed by our laboratory(Tang et al.2012).Polymerize chain reactions(PCR)followed the protocol described by Chen et al.(2008).PCR products were visualized on a 6%polyacrylamide gel followed by silver staining.The fragment sizes of the PCR products were estimated by comparison with a 50-bp DNA ladder.Peanut is an allotetraploid crop,and there is a substantial risk of errors in allele calling where multiple bands may be amplified from homoeologous chromosomes.Thus,each polymorphic fragment was scored as “1” or “0”according to the presence or absence of the amplification.The allele was named as the fragment size prefixed with the primer name,for example,17E1-420,whether it represented 420 bp allele of the 17E1 marker.
Statistical analyses
The number of subpopulations was determined using 109 SSR markers and the software STRUCTURE 2.2(Pritchard et al.2000).Five independent simulations were performed for values of k(the number of groups)ranging from 1 to 10.For each simulation,10 000 iterations before a burn-in length of 10 000 MCMC(Markov Chain Monte Carlo)replications were conducted with the admixture and related frequency models.The optimal k value was determined by the posterior probability[LnP(D)](Pritchard et al.2000)and delta k(Evanno et al.2005).Accessions with membership probabilities≥0.75 were assigned to corresponding clusters;accessions with membership probabilities<0.75 were assigned to a mixed group.Principal component analysis based on STRUCTURE results was performed using R package(R Core Team 2012).
Powermarker version 3.25(Liu and Muse 2005)was used to calculate allele number,line-specific alleles,major allele frequency,gene diversity,PIC,and Nei’s(1973)minimum distance among populations defined by STRUCTURE.
To investigate the genetic differentiation among the 298 accessions,AMOVA was performed and pairwise FSTamong inferred populations was calculated using the software package Arlequin 3.1(Excoffier et al.2005)with 1,000 permutations and the sum of squared size differences as the molecular distance.Finally,the relative kinship coefficients were calculated using the SPAGeDi software package(Hardy and Vekemans 2002),all negative values between individuals were set to 0(Yu et al.2006).
Statistical analyses for all traits were carried out using the R package(R Core Team 2012).Nanchong in 2006,Wuhan in 2006,and Wuhan in 2007 were treated as Environments I,II,and III,respectively.Broad-sense heritability based on familymean was calculated as H2=/(+/n),whereis the genetic variance,is the residual error,n is the number of environments.The estimates of and were obtained by R package lme4 with both genotype and environment as random effects.Phenotypic correlations(r)between all traits were calculated using R package ltm.The effect of population structure on each trait was evaluated from an analysis of variance(ANOVA)by using R package stats.
Association analysis
Among 533 SSR loci derived from 109 SSR primers,only the minor allele frequencies more than 0.05 were used for association analysis.Three models were used to evaluate the effects of population structure(Q)and relative kinship(K)on marker-trait associations for all 15 traits in each environment:(i)the GLM-simple model,similar to simple ANOVA analysis without considering Q and K;(ii)the Q model,considering Q;and(iii)the Q+K model,considering both Q and K.The GLM-simple model and the Q model were performed using GLM in TASSEL V2.1;the Q+K model was performed using MLM in TASSEL V2.1(Yu et al.2006;Bradbury et al.2007).As the Exact Bonferroni method is too conservative to correct the multiple tests of GWAS,we used a modified Bonferroni method to determine the whole genome P-value threshold that is equal to 1/n,where n means the marker number for GWAS.The quantile–quantile plots of estimated-log10(P)were displayed using the observed P-values from marker-trait associations,and deviations from the expectation demonstrated that the statistical analysis may cause spurious associations.Allele effects on agronomic traits were estimated based on the difference in the target trait of accessions with the allele compared to accessions without the allele.A positive value indicates that the associated allele increases the phenotypic value for the target trait,whereas a negative value indicates that the associated allele decreases the phenotypic value for the target trait.
ACKNOWLEDGEMENTS
We are grateful to Dr Yingjie Xiao at Huazhong Agricultural University for his critical reading and review of this manuscript.The research was supported by the National Basic Research Program of China(2011CB109300)and Crop Germplasm Program(NB09-2130135-4)and the National Science Fund of China(31271764).
Ali F,Yan J(2012)Disease resistance in maize and the role of molecular breeding in defending against global threat.J Integr Plant Biol 54:134–151
Belamkar V,Selvaraj MG,Ayers JL,Payton PR,Puppala N,Burow MD(2011)A first insight into population structure and linkage disequilibrium in the US peanut minicore collection.Genetica 139:411–429
Bradbury PJ,Zhang Z,Kroon DE,Casstevens TM,Ramdoss Y,Buckler ES(2007)TASSEL:Software for association mapping of complex traits in diverse samples.Bioinformatics 23:2633–2635
Breseghello F,Sorrells ME(2006)Association mapping of kernel size and milling quality in Wheat(Triticum aestivum L.)cultivars.Genetics 172:1165–1177
Chen B,Jiang H,Liao B,Ren X,Huang J,Lei Y,Wang S(2008)Genetic diversity analysis of Arachis gerplasm by SSR.J Trop Subtrop Bot 16:296–303
Cuc L,Mace E,Crouch J,Quang V,Long T,Varshney R(2008)Isolation and characterization of novel microsatellite markers and their application for diversity assessment in cultivated groundnut(Arachis hypogaea).BMC Plant Biol 8:55
Evanno G,Regnaut S,Goudet J(2005)Detecting the number of clusters of individuals using the software structure:A simulation study.Mol Ecol 14:2611–2620
Excoffier L,Laval G,Schneider S(2005)Arlequin version 3.0:An integrated software package for population genetics data analysis.Evol Bioinfo 1:47–50
Falush D,Stephens M,Pritchard JK(2003)Inference of population structure using multilocus genotype data:Linked loci and correlated allele frequencies.Genetics 164:1567–1587
Ferguson M,Burow M,Schulze S,Bramel P,Paterson A,Kresovich S,Mitchell S(2004)Microsatellite identification and characterization in peanut(A.hypogaea L.).Theor Appl Genet 108:1064–1070
Flint-Garcia SA,Thornsberry JM,Buckler ES(2003)Structure of linkage disequilibrium in plants.Ann Rev Plant Biol 54:357–374
Flint-Garcia SA,Thuillet AC,Yu J,Pressoir G,Romero SM,Mitchell SE,Doebley J,Kresovich S,Goodman MM,Buckler ES(2005)Maize association population:A high-resolution platform for quantitative trait locus dissection.Plant J 44:1054–1064
Gimenes M,Hoshino A,Barbosa A,Palmieri D,Lopes C(2007)Characterization and transferability of microsatellite markers of the cultivated peanut(Arachis hypogaea).BMC Plant Biol 7:9
Gomes RLF,Lopes ADA(2005)Correlations and path analysis in peanut.Crop Breed Appl Biotechnol 5:105–110
Gomez Selvaraj M,Narayana M,Schubert AM,Ayers JL,Baring MR,Burow MD(2009)Identification of QTLs for pod and kernel traits in cultivated peanut by bulked segregant analysis.Electron J Biotechnol 12:3–4
Hao C,Zhang X,Wang L,Dong Y,Shang X,Jia J(2006)Genetic diversity and core collection evaluations in common wheat germplasm from the northwestern spring wheat region in China.Mol Breed 17:69–77
Hardy OJ,Vekemans X(2002)SPAGeDi:A versatile computer program to analyse spatial genetic structure at the individual or population levels.Mol Ecol Notes 2:618–620
He G,Meng R,Gao H,Guo B,Gao G,Newman M,Pittman RN,Prakash C(2005)Simple sequence repeat markers for botanical varieties of cultivated peanut(Arachis hypogaea L.).Euphytica 142:131–136
He G,Meng R,Newman M,Gao G,Pittman R,Prakash CS(2003)Microsatellites as DNA markers in cultivated peanut(Arachis hypogaea L.).BMC Plant Biol 3:3
Holbrook CC,Anderson WF,Pittman RN(1993)Selection of a core collection from the US germplasm collection of peanut.Crop Sci 33:859–861
Holbrook CC,Dong W(2005)Development and evaluation of a mini core collection for the US peanut germplasm collection.Crop Sci 45:1540–1544
Huang L,Jiang H,Ren X,Chen Y,Xiao Y,Zhao X,Tang M,Huang J,Upadhyaya HD,Liao B(2012a)Abundant microsatellite diversity and oil content in wild Arachis species.PLoS ONE 7:e50002
Huang L,Ren X,Zhang X,Chen Y,Jiang H(2012b)Association analysis of agronomic traits and resistance to Aspergillus flavus in the ICRISAT peanut mini-core collection.Acta Agron Sin 38:935–946
Huang X,Wei X,Sang T,Zhao Q,Feng Q,Zhao Y,Li C,Zhu C,Lu T,Zhang Z,Li M,Fan D,Guo Y,Wang A,Wang L,Deng L,Li W,Lu Y,Weng Q,Liu K,Huang T,Zhou T,Jing Y,Li W,Lin Z,Buckler ES,Qian Q,Zhang QF,Li J,Han B(2010)Genome-wide association studies of 14 agronomic traits in rice landraces.Nat Genet 42:961–967
Jiang H,Duan N,Ren X(2006)Descriptors and Data Standard for Peanut(Arachis spp.).China Agriculture Press,Beijing.
Jiang H,Ren X,Huang J,Liao B,Lei Y(2008a)Establishment of peanut mini core collection in China and exploration of new resource with high oleat.Chin J Oil Crop Sci 30:294–299
Jiang H,Ren X,Liao B,Huang J,Lei Y,Chen B,Guo B,Holbrook CC,Upadhyaya HD(2008b)Peanut core collection established in China and compared with ICRISAT mini core collection.Acta Agron Sin 34:25–30
Khedikar Y,Gowda MVC,Sarvamangala C,Patgar K,Upadhyaya H,Varshney R(2010)A QTL study on late leaf spot and rust revealed one major QTL for molecular breeding for rust resistance in groundnut(Arachis hypogaea L.).Theor Appl Genet 121:971–984
Kochert G,Stalker HT,Gimenes M,Galgaro L,Lopes CR,Moore K(1996)RFLP and cytogenetic evidence on the origin and evolution of allotetraploid domesticated peanut,Arachis hypogaea(Leguminosae).Am J Bot 83:1282–1291
Krapovickas A,Gregory WC(1994)Taxonomía del género Arachis(Leguminosae).Bonplandia 8:1–186
Larsson SJ,Lipka AE,Buckler ES(2013)Lessons from Dwarf8 on the strengths and weaknesses of structured association mapping.PLoS Genet 9:e1003246
Liang X,Chen X,Hong Y,Liu H,Zhou G,Li S,Guo B(2009)Utility of EST-derived SSR in cultivated peanut(Arachis hypogaea L.)and Arachis wild species.BMC Plant Biol 9:35
Li H,Peng Z,Yang X,Wang W,Fu J,Wang J,Han Y,Chai Y,Guo T,Yang N(2013)Genome-wide association study dissects the genetic architecture of oil biosynthesis in maize kernels.Nat Genet 45:43–50
Liu K,Muse SV(2005)PowerMarker:An integrated analysis environment for genetic marker analysis.Bioinformatics 21:2128–2129
Mace E,Phong D,Upadhyaya H,Chandra S,Crouch J(2006)SSR analysis of cultivated groundnut(Arachis hypogaea L.)germplasm resistant to rust and late leaf spot diseases.Euphytica 152:317–330
Moretzsohn MC,Barbosa AVG,Alves-Freitas DMT,Teixeira C,Leal-Bertioli S,Guimares PM,Pereira RW,Lopes CR,Cavallari MM,Valls JFM(2009)A linkage map for the B-genome of Arachis(Fabaceae)and its synteny to the A-genome.BMC Plant Biol 9:40
Moretzsohn M,Leoi L,Proite K,Guimaraes P,Leal-Bertioli SCM,Gimenes M,Martins W,Valls JFM,Grattapaglia D,Bertioli D(2005)A microsatellite-based,gene-rich linkage map for the AA genome of Arachis(Fabaceae).Theor Appl Genet 111:1060–1071
Murray SC,Rooney WL,Hamblin MT,Mitchell SE,Kresovich S(2009)Sweet sorghum genetic diversity and association mapping for brix and height.Plant Genome 2:48–62
Pritchard J,Stephens M,Donnelly P(2000)Inference of population structure using multilocus genotype data.Genetics 155:945–959
Proite K,Leal-Bertioli SCM,Bertioli DJ,Moretzsohn MC,Da Silva FR,Martins NF,Guimarães PM(2007)ESTs from a wild Arachis species for gene discovery and marker development.BMC Plant Biol 7:7
Ravi K,Vadez V,Isobe S,Mir R,Guo Y,Nigam S,Gowda M,Radhakrishnan T,Bertioli D,Knapp S(2011)Identification of several small main-effect QTLs and a large number of epistatic QTLs for drought tolerance related traits in groundnut(Arachis hypogaea L.).Theor Appl Genet 122:1119–1132
Sarvamangala C,Gowda M,Varshney R(2011)Identification of quantitative trait loci for protein content,oil content and oil quality for groundnut(Arachis hypogaea L.).Field Crop Res 122:49–59
Simpson C,Krapovickas A,Valls J(2001)History of Arachis including evidence of A.hypogaea L.progenitors.Peanut Sci 28:78–80
Tang M,Chen Y,Ren X,Huang L,Zhou X,Yan H,Jiang H(2012)Genetic diversity of Arachis accessions by EST-SSR from cultivated peanut(Arachis hypogaea L.).Acta Agron Sin 38:1221–1231
R Core Team.(2012)R:A Language and Environment for Statistical Computing.R Foundation for Statistical Computing,Vienna,Austria,ISBN 3-900051-07-0.Available on-line:http://www.R-project.org/
Upadhyaya HD,Bramel PJ,Ortiz R,Singh S(2002)Developing a mini core of peanut for utilization of genetic resources.Crop Sci 42:2150–2156
Upadhyaya HD,Ortiz R,Bramel PJ,Singh S(2003)Development of a groundnut core collection using taxonomical,geographical and morphological descriptors.Genet Resour Crop Evol 50:139–148
Wang J,Long Y,Wu B,Liu J,Jiang C,Shi L,Zhao J,King G,Meng J(2009)The evolution of Brassica napus FLOWERING LOCUST paralogues in the context of inverted chromosomal duplication blocks.BMC Evol Biol 9:271
Wang ML,Sukumaran S,Barkley NA,Chen Z,Chen CY,Guo B,Pittman RN,Stalker HT,Holbrook CC,Pederson GA(2011)Population structure and marker-trait association analysis of the US peanut(Arachis hypogaea L.)mini-core collection.Theor Appl Genet 123:1307–1317
Wei W,Zhang Y,Lv H,Li D,Wang L,Zhang X(2013)Association analysis for quality traits in a diverse panel of Chinese sesame(Sesamum indicum L.)germplasm.J Integr Plant Biol 55:745–758
Xiao Y,Cai D,Yang W,Ye W,Younas M,Wu J,Liu K(2012)Genetic structure and linkage disequilibrium pattern of a rapeseed(Brassica napus L.)association mapping panel revealed by microsatellites.Theor Appl Genet 125:437–447
Yang X,Gao S,Xu S,Zhang Z,Prasanna B,Li L,Li J,Yan J(2010)Characterization of a global germplasm collection and its potential utilization for analysis of complex quantitative traits in maize.Mol Breed 28:511–526
Yu J,Pressoir G,Briggs WH,Bi IV,Yamasaki M,Doebley JF,McMullen MD,Gaut BS,Nielsen DM,Holland JB(2006)A unified mixed-model method for association mapping that accounts for multiple levels of relatedness.Nat Genet 38:203–208
Zhang H,Zhang D,Wang M,Sun J,Qi Y,Li J,Wei X,Han L,Qiu Z,Tang S,Li Z(2010a)A core collection and mini core collection of Oryza sativa L.in China.Theor Appl Genet 122:49–61
Zhang Z,Ersoz E,Lai CQ,Todhunter RJ,Tiwari HK,Gore MA,Bradbury PJ,Yu J,Arnett DK,Ordovas JM,Buckler ES(2010b)Mixed linear model approach adapted for genome-wide association studies.Nat Genet 42:355–360
Zhao K,Aranzana MJ,Kim S,Lister C,Shindo C,Tang C,Toomajian C,Zheng H,Dean C,Marjoram P (2007)An Arabidopsis example of association mapping in structured samples.PLoS Genet 3:e4
Zhao W,Park EJ,Chung JW,Park YJ,Chung IM,Ahn JK,Kim GH(2009)Association analysis of the amino acid contents in rice.J Integr Plant Biol 51:1126–1137
Zhu C,Yu J(2009)Nonmetric multidimensional scaling corrects for population structure in association mapping with different sample types.Genetics 182:875–888
SUPPORTING INFORMATION
Additional supporting information can be found in the online version of this article:
Table S1.List of 298 accessions in Chinese peanut mini-core collection
Table S2.Model-based and botanical clusters in the peanut mini-core collection
Table S3.Nei’s(1973)minimum distance(top diagonal)and pairwise FSTcomparisons(bottom diagonal)among groups inferred by structure analysis
Table S4.List of associated SSR alleles of 15 agronomic traits in different environments
Figure S1.Two different methods for determining the optimal value of K
(A)The ad hoc approach described by Pritchard et al.(2000);(B)a second-order statistic(i.e.,delta K)developed by Evanno et al.(2005).
Figure S2.Phenotypic distributions of 15 agronomic traits in different environments
Figure S3.Quantile-quantile plots of estimated-log10(P)from association analyses for 15 agronomic traits
The purple line represented the expected P-values with no association existed;the blue line represented observed P-values using the GLM-simple model;the red line represented observed P-values using the Q model;the ocherous line represented observed P-values using the Q+K model.HPW,100-pod weight;HSW,100-seed weight;LL,leaflet length;LW,leaflet width;NBP,number of branches with pods;PL,pod length;PN/P,pod number per plant;PW,pod width;PY/P,pod yield per plant;TBN,total branching number;SL,seed length;SP,shelling percentage;SW,seed width.
猜你喜欢
工业设计(2022年1期)2022-02-16
家居廊(2019年11期)2019-09-10
VOGUE服饰与美容(2019年6期)2019-07-17
支部建设(2019年36期)2019-02-20
家庭影院技术(2017年8期)2017-10-13
新闻传播(2015年3期)2015-07-12
学习月刊(2015年15期)2015-07-09
商事法论集(2015年1期)2015-06-27
科学家(2015年5期)2015-06-19
中国教育技术装备(2015年19期)2015-03-01
 Journal of Integrative Plant Biology2014年2期
- Journal of Integrative Plant Biology的其它文章
- Characterization of a novel DUF1618 gene family in rice
- Why mosaic?Gene expression profiling of African cassava mosaic virus-infected cassava reveals the effect of chlorophyll degradation on symptom development
- Two hydroxypyruvate reductases encoded by OsHPR1 and OsHPR2 are involved in photorespiratory metabolism in rice