
Numerical simulation of turbulent flow behind sluice gate under submerged discharge conditions*
2015-04-20 05:52LIUShihe刘士和LIAOTingting廖庭庭LUOQiushi罗秋实
水动力学研究与进展 B辑 2015年2期
LIU Shi-he (刘士和), LIAO Ting-ting (廖庭庭), LUO Qiu-shi (罗秋实)
1. State Key Laboratory of Water Resources and Hydropower Engineering Science, Wuhan University, Wuhan 430072, China, E-mail: shihe3086@163.com 2. Yellow River Engineering Consulting Co., Ltd, Zhengzhou 450003, China
Introduction
The sluice gate is a facility to control the discharge and the water level in hydraulic and hydroelectric engineering. The hydraulic characteristics of the turbulent flow discharging under a sluice gate are important for the optimal design and construction of sluice gates and the management of downstream river beds and banks. Fig.1 shows a schematic diagram of the flow behind a sluice gate under the submerged discharging condition. As can be seen from the figure, at the river bed, the scour hole and its subsequent accumulation body might be formed under continuous scouring,at the water-air interface, a hydraulic jump would be formed to connect the supercritical flow with the subcritical flow downstream, and in the longitudinal direction, the unsteady turbulent flow just under the sluice gate would be adjusted gradually to the steady uniform flow downstream. Therefore, the turbulent flow behind a sluice gate under the submerged discharge condition is very complicated and can be divided approximately into the rapidly varied flow region and the gradually varied flow region. The former is the region from the contraction section CS2 to CS4, which is behind the accumulation body, and the latter is the region from CS4 to CS5 as shown in Fig.1. The flow behind CS5 is a steady uniform flow. In Fig.1,t1,t2,…,t8represent the river bed topographies at the corresponding instants.
From the point of view of engineering hydraulics,more attentions should be paid to the discharge capacity and the local scour in studying this typical flow.There were many studies in this regard. Lozano etal.[1]measured the discharge capacity under a sluice gate with different water heads and sluice gate openings. Kim[2]studied the contraction coefficient, the discharge coefficient and the mean pressure on the wall by numerical simulations. For different bed gradation compositions and sluice gate openings, Dey and Westrich[3]and Chatterjee et al.[4]studied the local scour of the bed behind a sluice gate by experiments.On the other hand, the turbulent flow behind a sluice gate is also one kind of typical flows with complicated boundaries and was studied from the hydrodynamic perspectives. Among experimental studies, Dey et al.[5,6]measured the mean velocity and the turbulent kinetic energy by the acoustic Doppler velocimetry(ADV), Dey and Sarkar[7]measured the mean velocity and the Reynolds stress in the scour hole by the ADV.Cassan and Belaud[8]studied the turbulent flow near a sluice gate on smooth and rigid beds experimentally and numerically, and special attention was paid to large opening and submergence. Erdbrink et al.[9]investigated the mean pressure and the turbulent kinetic energy near the sluice gate by numerical simulations.Karim and Ali[10]studied the mean velocity in the scour hole by experiments and numerical simulations.

Fig.1 Schematic diagram of turbulent flow behind sluice gate
Although the turbulent flow behind a sluice gate was studied from various perspectives, the following two aspects were not adequately covered so far. (1) In the discharging process the river bed is scoured continuously, and the hydraulic jump at the water-air surface is adjusted accordingly. How do the mechanical energy and the flow discharge vary with time? (2) In the connection process between the flows in the rapidly varied region and thoser in the gradually varied region downstream, how do the turbulent kinetic energy and the mean wall shear stress vary in the longitudinal direction? and how does the mechanical energy change? The above issues will be addressed in this paper by theoretical analyses and numerical simulations.
1. Analyses of mechanical energy loss of turbulent flow behind sluice gate
The continuity equation, the momentum equation and the mechanical energy equation of the total flow are the basis of the 1-D flow description in Hydraulics and Engineering Fluid Mechanics[11-15]. The determination of the mechanical energy loss is essential for describing the flow by a 1-D mathematical model in hydraulics. Currently, the energy equation for the total flow in hydraulics is based on the Bernoulli’s equation in the streamline for incompressible steady flows of ideal fluid in the gravitational field, and is obtained by making some corrections and simplifications. As far as hydrodynamics is concerned in describing the viscous flow, the energy equation is not rigorous theoretically and cannot describe the variation of the turbulent kinetic energy. Meanwhile, it can not be used to obtain an expression for the mechanical energy loss directly. The author obtained a new energy equation for the open channel flow, which is derived from the Navier-Stokes equation directly[16], and this energy equation for the total flow can be used to analyze the transformation and the loss of the mechanical energy(hereinafter referred to as the mechanical energy loss)of the turbulent flow behind the sluice gate by simplifying the unsteady flow in the scouring process into a cascade steady flow in the sense of ensemble average.
1.1 Rapidly varied flow region
As can be seen from Ref.[16], the mechanical energy losshw0in the rapidly varied flow region per unit weight in unit time is
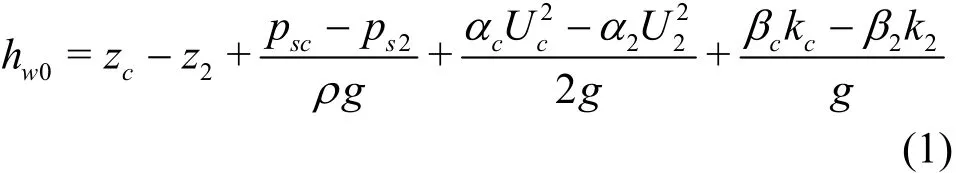
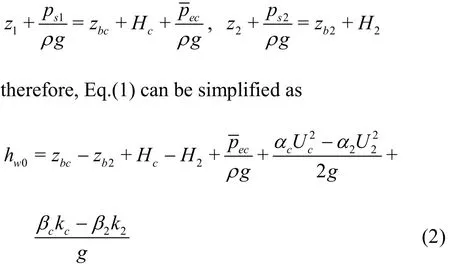
where the subscriptscand 2 are the corresponding numbers at the beginning (CS2) and the end (CS4) of the rapidly varied flow region,U,kare the mean velocity and the mean turbulent kinetic energy in the section, andzandpsare the vertical position and the corresponding mean hydrostatic pressure,αandβare the coefficients. Usingzbc,Hcandtorepresent the bed elevation, the effective water depth and the mean pressure at the separation stream line in CS2, and usingzb2andH2to represent the bed elevation and the water depth in CS4, we have
Due to the complexity of the flow boundaries and the flow fields in the rapidly varied flow region,hw0is expressed in the dimensionless form of the mean velocity head at the contraction section per unit weight in unit time, i.e.,

whereζis the coefficient of the mechanical energy loss, which is expressed as

1.2 Gradually varied flow region
The mechanical energy losshwbetween any two cross sections in the gradually varied flow region is
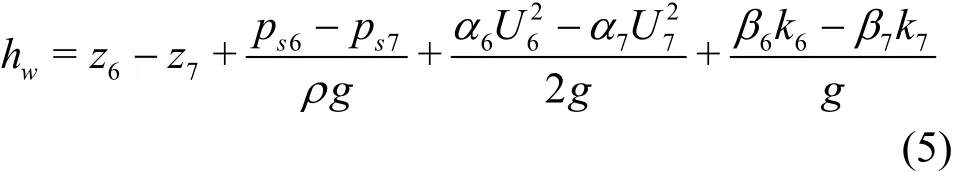
where the subscripts 6 and 7 are the corresponding numbers of any upstream and downstream sections with longitudinal distanceL. In the gradually varied flow region, the mean pressure at the water-air interface is just the atmospheric pressure, and similar to Eq.(2) we have

To describe the variation of the mechanical energy loss in the longitudinal direction and the process of the gradually varied flow approaching to the uniform flow,hwis divided further into the mechanical energy loss corresponding to the uniform flow and the deviation from it. In addition, the Darcy-Weisbach formula is used to calculate the coefficient of the mechanical energy lossλ, andτw=λ1/8ρ[(U6+U7)/2]2is used to calculateλ1, which is the coefficient of the mechanical energy loss corresponding to the uniform flow. Then we have


wherewτis the mean wall shear stress, and 2λis the coefficient of the mechanical energy loss deviating from that of the uniform flow.
2. Mathematical model for the flow behind sluice gate and numerical methods
2.1 Mathematical model
2.1.1 Governing equations
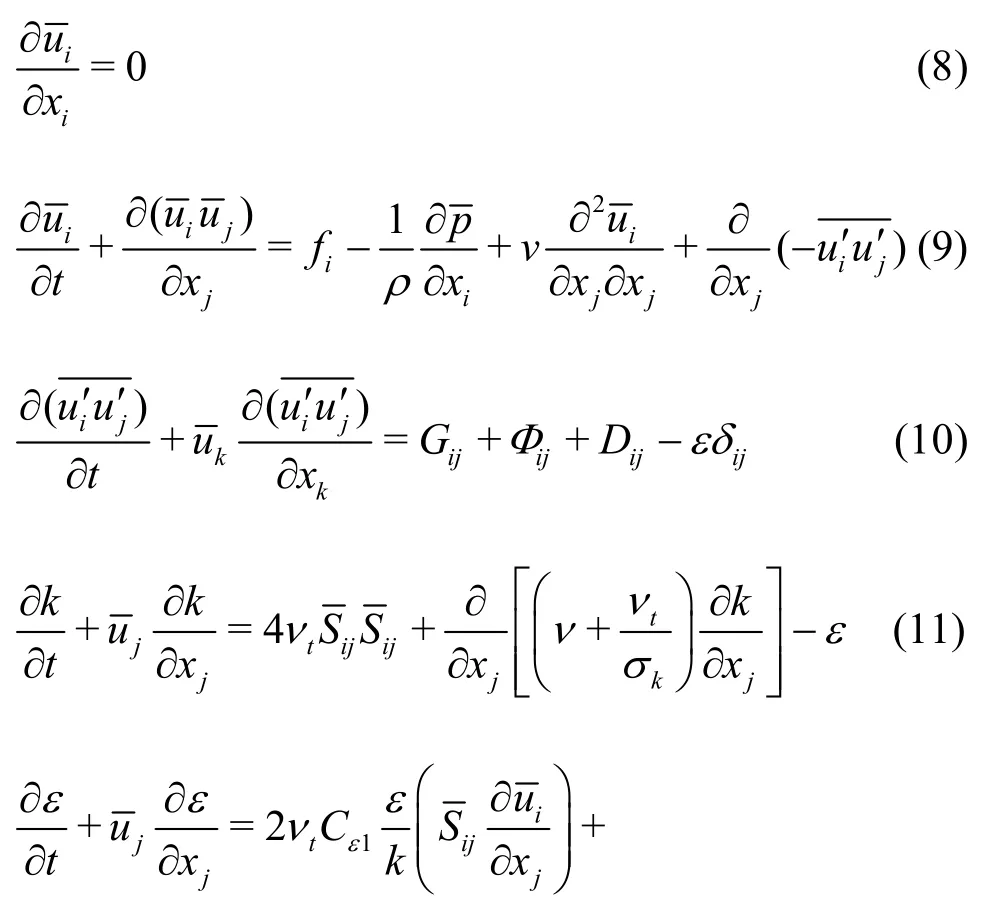
The vertically 2-D mathematical model of Reynolds averaged equations is adopted to study the turbulent flow behind a sluice gate as shown in Fig.1,and the governing equations are as follows:
2.1.2 Boundary conditions
(1) Water-sediment boundary
The boundary corresponding to the scour hole and its subsequent accumulation body behind the sluice gate is the water-sediment boundary. Similar to Ref.[17], the revised wall function is used to reflect the effect of the bed material with median diameterd50on the mean flow. Meanwhile, the zero location of the bed is taken as 0.75d50, and the mean velocityat distancex2pabove the wall is
(2) Rigid boundary
The interfaces between the water and the other river bed except the water-sediment boundary are rigid boundaries, and the corresponding boundary condition is the no-slip condition.
(3) Water-air interface
The boundary condition of the water-air interface is treated by using the VOF method.
2.2 Numerical method
In the numerical simulation, triangular grids are used and the near-wall grids are refined. The finite volume method (FVM) is used to discretize the governing equations over the control volume, and the PISO algorithm is used to handle the coupling between the mean pressure and the mean velocity in the numerical simulation.
The algebraic equations after discretization are
The algebraic equations are solved by the Gauss-Seidel iteration method. The result converges when the unit mass flow residual is less than 0.01% of the inflow and the overall mass flow residual is less than 0.5% of the inflow.
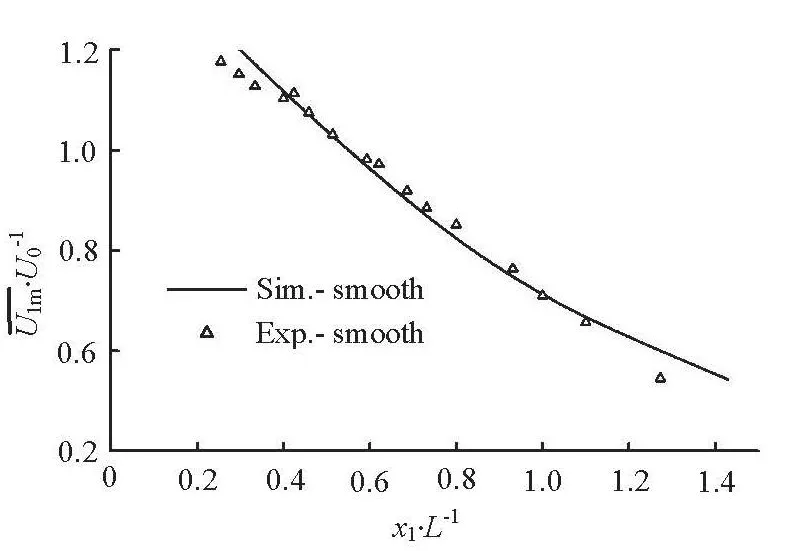
Fig.2 Comparison of the measured and simulated results(smooth bed)

Fig.3 Comparison of the measured and simulated results (rough bed)
2.3 Verification
Dey et al.[18]conducted experiments for the turbulent flow behind a sluice gate with fixed flat beds,and the mean velocity was measured with the ADV.The comparisons of the simulated results with the experimental ones for the longitudinal mean velocity are shown in Figs.2 and 3 for a smooth bed and a rough bed withd50=0.0041m , respectively, whereis the maximum mean velocity in the cross section at a distance ofx1from the sluice gate in the longitudinal direction,U0is the mean velocity at the sluice gate section,Lis a characteristic length, see Ref.[18]. As can be seen from these figures, the simulated results are in good agreement with the experimental ones.
3. Numerical simulation of water flow under sluice gate
3.1 Simulated conditions
Strictly speaking, the actual turbulent flow behind the sluice gate is unsteady even from the point ofview of ensemble average because of the bed local scour. Chatterjee et al.[4]conducted systematic experiments on this flow, and the bed topographies at eight instants were obtained as shown in Fig.1. The bed topographies in this paper are based on his experimental results and the actual unsteady flow is simplified into nine corresponding cascade steady flow states including the initial state, and the simulated conditions are the same as the experimental ones (the upstream water depth is 0.409 m, the downstream water depthHis 0.291 m, the opening of the sluice gate is 0.02 m). For the gradually varied flow region, the bed slope is taken as 1/100000, and the longitudinal length is 120H.
3.2 Analysis of the simulation results in rapidly varied flow region
3.2.1 Vertical distribution of mean pressure
Consider the contraction section CS2, the section CS3 which is at the crest of the accumulation body,and the initial section CS4 of the gradually varied flow region. For convenience, only the mean pressurecorresponding to the bed topography att2is discussed andis also non-dimensionalized by its maximum valuepmaxin the section. The simulation results are shown in Fig.4. It can be seen that: (1) the vertical distributions of the mean pressure at CS3 and CS4 are very close to the hydrostatic pressure distribution, (2) in the effective flow region of CS2, the vertical distribution of the mean pressure also obeys the hydrostatic pressure distribution except that the mean pressure at the separation lineis not equal to zero since there exists a hydraulic jump there.

Fig.4 Variation of /p max with x2/H
3.2.2 Variation of discharge with time
In the discharging process, the hydraulic jump at the water-air interface is adjusted with the river bed deformation, which makes the dischargequnder the sluice gate vary with time. The simulation results ofqat different instants are shown in Fig.5, in whichqis non-dimensionalized by its final stable valueq0,and the timetis also non-dimensionalized asU1t/H.As can be seen from Fig.5, the extent of the variation of the discharge is very small and is less than 4% in the discharging process.

Fig.5 Variation of q against U1t/H
3.2.3 Variation of the coefficient for mechanical energy loss with time
In the discharging process, the flow boundary is being adjusted continuously with the bed local scour,and the mechanical energy of the water flow in the rapidly varied flow region is varying correspondingly.The variation of the coefficientζfor the mechanical energy loss againstU1t/His given in Fig.6. As can be seen from this figure, the deformation of the river bed tends to decrease the total mechanical energy of the flow sinceζis larger than zero, and the mechanical energy loss also decreases with the increase of the time.

Fig.6 Variation of ζ against U1t/H
3.3 Analysis of the simulation results in gradually varied flow region
Due to the space limitation of the paper, only the mean wall shear stress, the turbulent kinetic energy and the mechanical energy loss corresponding to the bed topography att2are analyzed. In the simulation results shown below, the zero position ofx1is also the coordinate origin in Fig.1, and the initial section CS4 of the gradually varied flow region is selected at the location of 8.6Hdownstream from the origin.
3.3.1 Variation of mean wall shear stress
The variation of the mean wall shear stresswτin the longitudinal direction is given in Fig.7, in whichwτis non-dimensionalized by the mean wall shear stress0τof the uniform flow downstream. As can be seen from Fig.7 that (1) the mean wall shear stress in the gradually varied flow region is always larger than that in the uniform flow downstream, (2) the mean wall shear stress in the gradually varied flow region decreases in the longitudinal direction, and approaches the mean wall shear stress of the uniform flow at about 65Hdownstream.
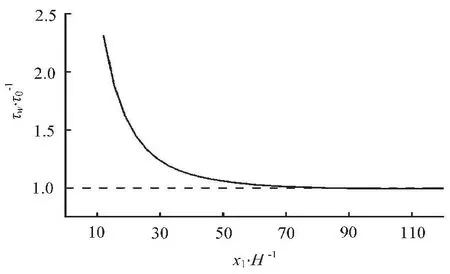
Fig.7 Variation of τw/τ0 against x1/H

Fig.8 Variation of k/km ax against x2/H
3.3.2 Variation of turbulent kinetic energy
(1) Variation of turbulent kinetic energy in vertical direction
The variations of the turbulent kinetic energy in the vertical direction at three different sections are given in Fig.8, from which we can see that (1) in the vertical direction, the position of the maximum turbulent kinetic energy is always near the bed, (2) the decay of the turbulent kinetic energy near the free surface is much more significant than that near the bed in the longitudinal direction.
(2) Variation of mean turbulent kinetic energy in section
The variation of the mean turbulent kinetic energy in section along the longitudinal direction is given in Fig. 9, in whichis non-dimensionalized by the mean turbulent kinetic energy in the section of the uniform flowk0. As can be seen from Fig.9 that (1)decreases in the longitudinal direction, and approaches the mean turbulent kinetic energy in the section of the uniform flow at about 75Hdownstream,(2) the decrease ofin the longitudinal direction is slower than that ofwτ.

Fig.9 Variation of /k0 against x1/H

Fig.10 Variations of λ, λ1/λ and λ2/λ against x1/H
3.3.3 Variation of the coefficient for mechanical energy loss
The variations of the mechanical energy loss coefficientsλ,1λand2λin the longitudinal direction are shown in Fig.10. It can be seen from these figures that (1)λapproaches the coefficient of the mechanical energy loss corresponding to the uniform flow at about 80Hdownstream, (2) the ratio of 2λtoλdecreases sharply in the longitudinal direction prior to 15Hdownstream, and the mechanical energy losscan be calculated approximately by the formula of the uniform flow after that.
4. Conclusions
Based on the theoretical analysis and the numerical simulation of the turbulent flow discharging behind a sluice gate under submerged conditions, the following conclusions are drawn:
(1) In the discharging process of the turbulent flow under a sluice gate, the river bed is scoured continuously and the water–air interface is adjusted accordingly, which leads to the decrease of the mechanical energy of the total flow in the rapidly varied flow region, and the mechanical energy loss also decreases with the increase of the time, yet the variation of the flow discharge under the sluice gate is very small.
(2) In the connection between the rapidly varied flow and the uniform flow downstream, the mean wall shear stress and the coefficient for the mechanical energy loss decrease in the longitudinal direction; the decay of the turbulent kinetic energy near the free surface is much more significant than that near the bed in the longitudinal direction, and the mean turbulent kinetic energy in section decreases in the longitudinal direction and the decreasing rate is slower than that of the mean wall shear stress.
[1] LOZANO D., MATEOS L. and MERKLEY G. P. et al.Field calibration of submerged sluice gates in irrigation canals[J]. Journal of Irrigation and Drainage Engi- neering, 2009,135(6): 763-772.
[2] KIM D. G. Numerical analysis of free flow past a sluice gate[J]. KSCE Journal of Civil Engineering, 2007, 11(2): 127-132.
[3] DEY S., WESTRICH B. Hydraulics of submerged Jet subject to change in cohesive bed geometry[J]. Journal of Hydraulic Engineering, ASCE, 2003, 129(1): 44-53.
[4] CHATTERJEE S. S., GHOSH S. N. and CHATTERJEE M. Local scour due to submerged horizontal jet[J].Journal of Hydraulic Engineering, ASCE, 1994,120(8): 973-992.
[5] DEY S., SARKAR A. Response of velocity and turbulence in submerged wall jets to abrupt changes from smooth to rough beds and its application to scour downstream of an apron[J]. Journal of Fluid Mechanics, 2006, 556: 387-419.
[6] DEY S., NATH T. K. and BOSE S. K. Submerged wall jets subjected to injection and suction from the wall[J].Journal of Mathematical Fluid Mechanics, 2010, 653: 57-97.
[7] DEY S., SARKAR A. Characteristics of submerged jets in evolving scour hole downstream of an apron[J].Journal of Engineering Mechanics, ASCE, 2008, 134(11): 927-936.
[8] CASSAN L., BELAUD G. Experimental and numerical investigation of flow under sluice gates[J]. Journal of Hydraulic Engineering, ASCE, 2012, 138(4): 367- 373.
[9] ERDBRINK C. D., KRZHIZHANOVSKAYA V. V.and SLOOT P. M. A. Free-surface flow simulations for discharge-based operation of hydraulic structure gates[J]. Journal of Hydroinformatics, 2014, 16(1): 189-206.
[10] KARIM O. A., ALI K. H. M. Prediction of flow patterns in local scour holes caused by turbulent water jets[J]. Journal of Hydraulic Research, 2010, 38(4): 279-287.
[11] ZHANG Zhao-shun, CUI Gui-xiang. Fluid mechanics[M]. Second Edition, Beijing, China: Tsinghua Uni- versity Press, 2006(in Chinese).
[12] CHEN Mao-zhang. Fundamentals of viscous fluid dynamics[M]. Beijing, China: Higher Education Press, 2002(in Chinese).
[13] LIU Shi-he. High speed flow[M]. Beijing, China: Science Press, 2005(in Chinese).
[14] POPE S. B. Turbulent flows[M]. London, UK: Cambridge University Press, 2000.
[15] GOTOH T., FUKAYAMA D. and NAKANO T. Velocity field statistics in homogeneous steady turbulence obtained using a high-resolution direct numerical simu- lation[J]. Physics of Fluids, 2002, 14(3): 1065-1081.
[16] LIU Shi-he, FAN Min and XUE Jiao. The mechanical energy equation for total flow in open channels[J]. Journal of Hydrodynamics, 2014, 26(3): 416-423.
[17] LIU Shi-he, LIU Jiang and LUO Qiu-shi et al. Engineering turbulence[M]. Beijing, China: Science Press, 2011(in Chinese).
[18] DEY S., NATH T. K. and BOSE S. K. Fully rough submerged plane wall-jets[J]. Journal of Hydro-Environment Research, 2010, 4(4): 301-316.

- 水动力学研究与进展 B辑的其它文章
- A general framework for verification and validation of large eddy simulations*
- Direct calculation method of roll damping based on three-dimensional CFD approach*
- Visualization study on fluid distribution and end effects in core flow experiments with low-field mri method*
- Large-eddy simulation of the flow past both finite and infinite circular cylinders at Re =3900*
- Safe operation of inverted siphon during ice period*
- Flow field simulation of supercritical carbon dioxide jet: Comparison and sensitivity analysis*