
Parameters analysis and application of the differential excitation detection technology
2015-04-22 07:24YUXia于霞ZHANGWeimin张卫民CHENGuolong陈国龙QIUZhongchao邱忠超ZENGWeiqin曾卫琴
关键词:卫民
YU Xia(于霞), ZHANG Wei-min(张卫民), CHEN Guo-long(陈国龙),QIU Zhong-chao(邱忠超), ZENG Wei-qin(曾卫琴)
(School of Mechanical Engineering, Beijing Institute of Technology, Beijing 100081, China)
Parameters analysis and application of the differential excitation detection technology
YU Xia(于霞), ZHANG Wei-min(张卫民), CHEN Guo-long(陈国龙),QIU Zhong-chao(邱忠超), ZENG Wei-qin(曾卫琴)
(School of Mechanical Engineering, Beijing Institute of Technology, Beijing 100081, China)
A differential excitation probe based on eddy current testing technology was designed. Sheet specimens of Q235 steel with prefabricated micro-cracks of different widths and of aluminum with prefabricated micro-cracks of different depths were detected through the designed detection system. The characteristics of micro-cracks can be clearly showed after signals processing through the short-time Fourier transform (STFT). By changing the parameter and its value in detecting process, the factors including the excitation frequency and amplitude, the lift-off effect and the scanning direction were discussed, respectively. The results showed that the differential excitation probe was insensitive to dimension and surface state of the tested specimen, while it had a high degree of recognition for micro-crack detection. Therefore, when the differential excitation detection technology was used for inspecting micro-crack of turbine blade in aero-engine, and smoothed pseudo Wigner-Ville distribution was used for signal processing, micro-cracks of 0.3 mm depth and 0.1 mm width could be identified. The experimental results might be useful for further research on engineering test of turbine blades of aero-engine.
differential excitation probe; eddy current testing; micro-crack defect; influence parameters analysis
The existing micro-defect detection methods of curved surfaces present more or less limitations. Among them, eddy current testing is one of the most important electromagnetic non-destructive testing method, which is capable of identifying surface defects of the specimen and consists of some advantages, such as low cost, contactless and achievement of rapid scale detection[1-3], compared to traditional differential measurement detection[4-5]. Traditional differential probe is composed by the excitation coil in the middle and the detection coils on both sides, while the differential excitation probe consists of the receiving coil in the middle and the excitation coils on both sides.
The eddy current testing based on the differential excitation probe has a higher sensitivity. Moreover, it can not only detect surface defects of ferromagnetic specimen, but also identify defects of non-ferromagnetic specimen. The method can be applied in a great range of excitation frequency and has a large range of the amplitude of the excitation signal. Similarly, the method can identify artificial micro-cracks when applied to inspect turbine blades of aero-engine. And the lift-off effect is small. Therefore, it is necessary to study on the detection system of the differential excitation probe for detecting micro-defects of curved surfaces. The eddy current testing technology based on the differential excitation probe can provide some reference for further practical applications of engineering.
1 Principle of the differential excitation probe
Fig.1 shows the detecting system of differential excitation probe, which is consist of two differential excitation coils and a detection coil. Coils areparallel with each other. When the sinusoidal alternating voltage is applied to the excitation coil, the specimen tested will produce eddy current through the alternating magnetic field generated by the excitation coils. The effect of the differential excitation offset each other and no signal is output in the detection coil when the probe is in equilibrium and there is no defect in the specimen. While the specimen has defects and the equilibrium state is destroyed, the magnetic signal is picked up by the detection coils and then converted to a voltage signal. The signal is processed successively through the signal conditioning circuit and the A/D data acquisition card, then collected and saved by computer.
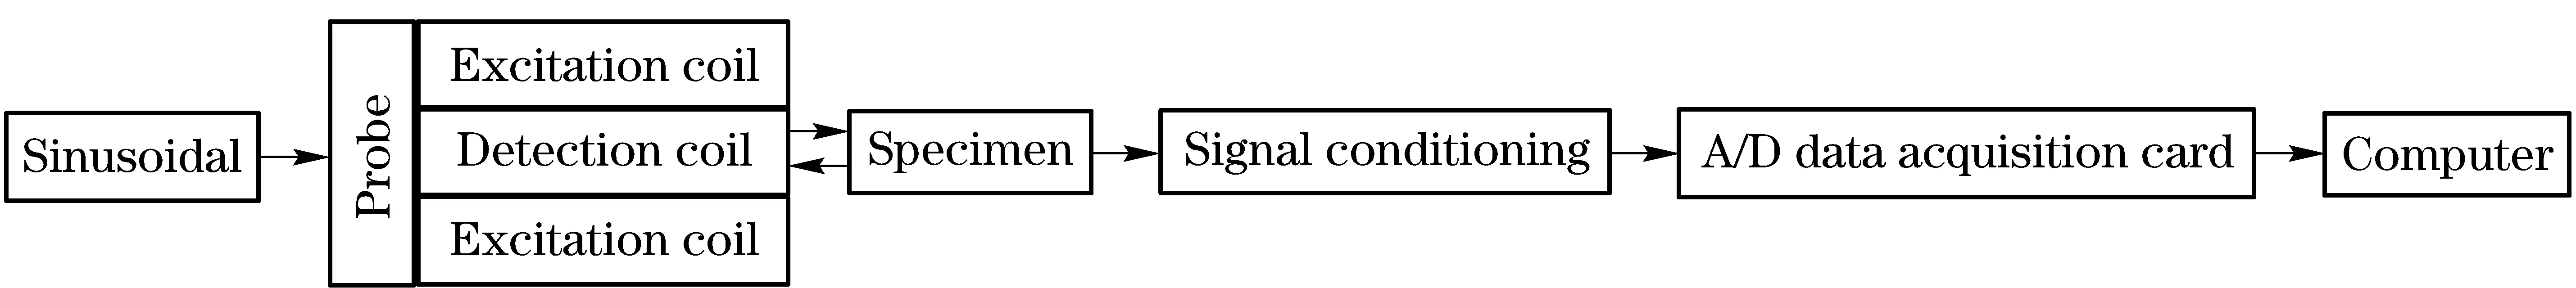
Fig.1 Diagram of the testing system
The excitation and detection coils are integrated into a probe foreasy engineering applications. A ferrite sheet is chosen as a core, on which the corresponding number of coil is rounded. Three coils are placed side by side and both sides of the coil are connected. The side coils are used as excitation coils while the intermediate coil is used as a detection coil, respectively.
2 Testing experiments
2.1 Ferromagnetic material specimen
Three cracks with different widths (0.10 mm, 0.15 mm and 0.22 mm) and same length and depth (10 mm×0.25 mm) were made in a rectangular specimen of Q235 steel in advance. When the specimen was excited by the alternating voltage of 15 kHz and the peak-to-peak voltage of 15 V, the probe scanned the three cracks in turn in the direction perpendicular to the cracks. Since the obtained crack signal is non-stationary,short-time Fourier transform(STFT)can be used for time-frequency analysis[6]. STFT of signalx(t) is defined as
(1)
whereωisangularfrequencyofthesignal, g*(t)istimewindowfunction, “*”iscomplexconjugate.Thediscretesignalx(n)iscracksignalcollectedintothecomputer,andnshortperiodofdataas
xn(k)=x(k)ω(n-k)
(2)
where ω(n)iswindowfunction.ThensignaldiscreteFouriertransformofx(n)is
S(n,ω)=∑x(k)ω(n-k)e-jkω
(3)
Due to the fact that STFT is more efficient than fast Fourier transformation (FFT), the signal is processed by STFT, and the results are shown in Fig.2. It can be concluded that the crack location can be identified by the changes of crack frequency.

Fig.2 STFT of Q235 specimen for cracks with different widths
The peak-peak value of the detected signal increases dramatically as the crack width becomes larger for the same material and in the same test condition, so it can be concluded that the differential excitation probe designed is sensitive to cracks of ferromagnetic material of Q235 steel. Therefore, the defect size can be identified qualitatively in terms of the peak-peak value of the defect signal. Of course, further research is needed for providing reference for qualitative and quantitative assessment in engineering applications.
2.2 Non-ferromagnetic material specimen
Since the crystal particles of aluminum are much bigger than those of carbon steel, the noise interference caused by aluminum grain boundary is much larger than that of carbon steel too. Therefore, it is difficult to detect cracks of aluminum specimen.
Owing to the fact that crack’s depth has a significant influence on eddy current effect, a few cracks with different depth (0.30 mm, 0.45 mm, 0.60 mm and 0.75 mm) and same length (10 mm) and width (0.15 mm) are machined on the surface of aluminum specimen. During the test, the probe scans along the length direction of speciment from one end to the other. The detection signal was filtered by the Barkhausen filtering, and then processed through STFT, as shown in Fig.3. It can be concluded that STFT time-frequency analysis method was also able to distinguish accurate position of micro-crack in the aluminum plate specimen.

Fig.3 STFT of aluminum specimen for cracks with different depths
The peak-peak value increases as the crack depth becomes larger, and the differential excitation probe can easily identify defect with width of 0.30 mm. Quantitative assessment of defect can be achieved by establishing relationship between the characteristic signal and crack size.
3 Analysis of three impact factors
The differential excitation probe scans the specimen of Q235 steel with a prefabricated crack with length of 12 mm, width of 0.15 mm and depth of 0.5 mm.
3.1 Effect of excitation frequency
When the amplitude of excitation voltage is fixed at 15 V, the coils are prone to become hot under long power, due to the coil’s small inductance if the excitation frequency is less than 5 kHz. The surface is scanned when the excitation frequency increases from 5 kHz to 50 kHz sequentially, and the results under different excitation frequencies are shown in Fig.4.

Fig.4 Signals under different excitation frequencies
The differential excitation probe can be applied in a wide range of excitation frequency (5-50 kHz). The inductive reactance of coil changes with the frequency of alternating current while the signal-to-noise ratio (SNR) of defect signals increases with the decreasing excitation frequency. The results show that the peak-peak value of crack signal increases with the decreasing excitation frequency when the excitation frequency is less than 10 kHz. As the excitation frequency is less than 35 kHz, the change between the detection signal and other interference signals can be distinguished easily. The defect signal is disturbed significantly if increasing the excitation frequency. When the excitation frequency is 50 kHz, the noise signal is significant compared with the signal caused by defects, thus it is feasible to identify presence of defect. As the excitation frequency increases at the same excitation voltage, the inductive reactance of coil increases linearly while the current decreases. Thus, the magnetic field disturbance caused by micro-crack is weakened due to the weakened magnetization. So it is difficult to identify defects accurately when the frequency is bigger than 50 kHz.
3.2 Effect of excitation amplitude
When the excitation frequency is fixed at 30 kHz, the voltage applying the excitation coils determine the current, thereby affecting the surface eddy current. As the amplitude of excitation signal increases sequentially from 2 V to 20 V, the results under different excitation amplitudes are shown in Fig.5.

Fig.5 Results with different excitation amplitudes
As can be seen, the differential excitation probe can be applied in a wide range of excitation amplitude. The mutation degree of cracks is more significant with increasing excitation amplitude. The method can detect surface cracks when the excitation voltage amplitude reaches 2 V. As the excitation voltage increases, the SNR increases significantly. The differential excitation probe which has low requirement for excitation signal has high sensitive to surface crack, and the detection effect is good when the excitation frequency is in the range of 5 kHz to 50 kHz and the amplitude is in the range of 2 V to 20 V.
3.3 Effect of lift-off value
The lift-off effect will interfere with the detection process and then affect directly precision and accuracy of detection[7]. When the lift-off value changes gradually from 0 to 2.4 mm away from the surface of specimen, the relationship between the lift-off value and the peak-peak value is shown in Fig.6.

Fig.6 Relationship between the lift-off value and the peak-peak value of signal
When the lift-off value is less than 0.4 mm, the effect of the external interference is negligible. However, while the lift-off value increases gradually to 2.0 mm, the detection result reduced significantly. However, when the lift-off value exceeds 2.4 mm, the addition of the lift-off value reduces the magnetic flux into the specimen tested. The effect isn’t satisfactory, but crack can still be identified. Therefore, the lift-off effect is more obvious as the probe is closer to the specimen. On the contrary, the effect of the lift-off effect is weak.
3.4 Effect of scanning direction
The scanning direction of the probe changes at intervals 15° counter-clockwise with the direction normal to the cracks is deed as 0°. The scanning directions and corresponding results are shown in Fig.7 and Fig.8.
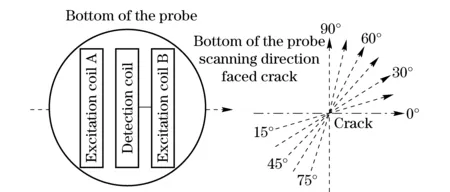
Fig.7 Probe and sketch of scanning directions

Fig.8 Curves under different scanning directions
When the probe scans the crack in the direction of 0°, the excitation coils and the detection coil go through the crack in sequence. The detection signal is perfect and a peak and a trough appears clearly. As the angle of scanning direction increases, the probe whose sensitivity is high at the moment can reflect completely the process of probe through the defects when the angle is less than 60°. However, while the angle is more than 60°, the distribution of magnetic field distorts significantly and the signal is asymmetry on the surface cracks. As the angle increases to 75°or 90°, the signals measured become messy and the characteristics of crack signal weaken rapidly. The test results aren’t identical with the information of cracks, but still show position of the cracks.
4 Application of the differential excitation probe in turbine blade of aero-engine
Cracks in turbine blades of an aero-engine are currently detected by nondestructive methods, such as ultrasonic testing, eddy current testing, X-ray testing and infrared thermography. The differential excitation probe can better detect cracks in different locations on turbine blades. Comparing to other nondestructive testing methods, it has advantages such as low cost, high sensitivity, small lift-off effect, and high SNR. Cracks with different sizes are designed for simulating the actual situation in terms of corresponding standards. The dimension and position of the prefabricated micro-crack in a turbine blade of an aero-engine is shown in Fig.9.
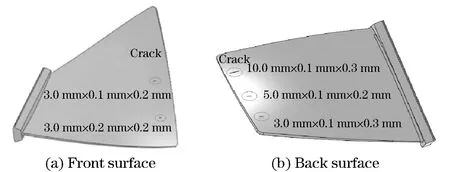
Fig.9 Size and position of a turbine blade with prefabricated crack
According to the results above, it can be concluded that the sensitivity of the probe can meet the requirement when used for micro-crack detection in curved blade[8]. When the probe is used for inspecting the position of micro-crack in the turbine blade, the micro-crack with depth of 0.30 mm, width of 0.10 mm and different lengths can be identified at the sampling frequency of 1 600 Hz and the sampling time of 2 s, as shown in Fig.10.
The time-frequency analytic method is applied to analyze the micro-crack signal with distortion signals and identify accurately the position of micro-crack. It is found that STFT and Wigner-Ville distribution(WVD)cannot distinguish the time-frequency characteristics of the micro-crack position. But smoothed pseudo Wigner-Ville distribution(SPWVD)can be expressed as
(4)
withW(t,ω)canbeexpressedas
(5)
whereφ(u,v)isatwo-dimensionallow-passfilter.
SPWVDhastheadaptivefunctionofwindowlengthadjustment[9],andthesignalisprocessedbywaveletde-noiseandthenWignerVilletime-frequencyanalysis.Thepositionofmicro-crackcanbeidentifiedintermsofthefrequencyandenergy,asshowninFig.11.Therefore,thedifferentialexcitationprobeiseffectiveondetectingartificialmicro-crack,andithaslaidafoundationforthearraydifferentialexcitationprobewhichiscapableofachievingquantitativetestinginturbinebladesofanaero-engine.

Fig.10 Testing curved turbine blades with cracks of different sizes

Fig.11 Results of SPWVD after wavelet denoising
5 Conclusions
Thedifferentialexcitationprobeisusedtoidentifymicro-defectsonsurfaceofferromagneticandnon-ferromagneticspecimens.Itcanbeconcludedthattheprobeiseffectivethroughstudyingthreeimpactfactors.Theprobecandetectamicro-crackwithwidthof0.1mmanddepthof0.3mm.Thefollowingconclusionscanbeobtainedasfollows.
①Comparedwiththeconventionaleddycurrentprobe,thedifferentialexcitationprobedevelopedhasahighersensitivityandresolution,andislessaffectedbyexternalinterference.
②Thedifferentialexcitationprobecannotonlydetectmicro-crackofplatespecimensofferromagneticandnon-ferromagneticmaterials,butalsoidentifymicro-crackincurvedsurfacespecimen,suchastheturbinebladesofanaero-engine.
③Theprobehavelaidfoundationforachievinganarraydifferentialexcitationprobewhichcandetectmicro-crackrapidlyandaccurately.
④Thedifferentialexcitationprobedevelopedisinsensitivetocrackwidthlessthan0.5mm,whilesensitivetocrackdepth.
[1] Shi Keren, Gao Zhiyang. Nondestructive testing new technologies[M]. Beijing: Tsinghua University Press, 2008. (in Chinese)
[2] He Min, Huang Zhifeng. Summary of eddy current testing and alternating current field measurement methods[J]. Chinese Journal of Scientific Instrument, 2011, 32(6): 109-112. (in Chinese)
[3] Li Yong, Chen Zhenmao, Mao Ying. Quantitative evaluation of thermal barrier coating based on eddy current technique[J]. NDT&E International, 2012, 50: 29-35.
[4] Kikuchi H, Murami H, Ara K. Feasibility study for nondestructive evaluation of magnetic properties and hardness of two-layered specimens by magnetic single-yoke probe[J]. NDT&E International, 2012, 46: 1-6.
[5] Lebrun B, Jayet Y, Balmux J C. Pulsed eddy current signal analysis: application to the experimental detection and characterization of deep flaws in highly conductive materials[J]. NDT&E International, 1997, 30(3):163-170.
[6] Zhou Zhenggan, Feng Zhanying, Gao Yifei, et al. Application of time-frequency analysis to ultrasonic-guided-wave signal interpretation[J]. Journal of Beijing University of Aeronautics and Astronautics, 2008, 34(7): 833-837. (in Chinese)
[7] Zhang Yu Hua, Luo Feilu, Sun Hui Xian. Lift off interference suppression in eddy current testing[J]. Measurement Technique, 2008(6): 23-27. (in Chinese)
[8] Qi Gongjin,Lei Hong,Fu Gangqiang, et al. In situ eddy-current testing on low-pressure turbine blades of aircraft engine[J]. Journal of Testing and Evaluation, 2012, 40(4): 553-556.
[9] Li Cong, Han Liguo, Li Jinquan, et al. Application of decomposition technique of smooth Wigner-Ville spectral in reservoir prediction[J]. Global Geology, 2012, 31(4): 813-818. (in Chinese)
(Edited by Cai Jianying)
10.15918/j.jbit1004-0579.201524.0310
TP 374.2 Document code: A Article ID: 1004- 0579(2015)03- 0348- 07
Received 2013- 12- 18
Supported by the Ministerial Level Advanced Research Foundation(051317030586); Ph.D. Programs Foundation of the Ministry of Education of China(20121101110018)
E-mail: tieyan2@163.com
猜你喜欢
保健与生活(2022年2期)2022-01-26
保健与生活(2021年24期)2021-12-12
保健与生活(2021年18期)2021-09-17
保健与生活(2021年18期)2021-09-17
快乐语文(2020年32期)2021-01-15
文学少年(有声彩绘)(2019年5期)2019-05-27
数位时尚(幼儿教育)(2017年10期)2017-10-18
音乐天地(音乐创作版)(2017年5期)2017-07-24
 Journal of Beijing Institute of Technology2015年3期
- Journal of Beijing Institute of Technology的其它文章
- High-rise building fire pre-warning model based on the support vector regression
- Dynamic modeling and simulation for the flexible spacecraft with dynamic stiffening
- Experimental study on the time-dependent dynamic mechanical behaviour of C60 concrete under high-temperatures
- Experimental study on compression stroke characteristics of free-piston engine generator
- Numerical simulation and optimization of the cylinder head water jacket based on the two-phase flow boiling heat transfer
- Multi-action-based approach for constructing knowledge map