
Novel method for operating characteristics test of a hydraulic pump
2015-04-24 05:30WANGXiangzhou王向周LUYe陆叶ZHENGShuhua郑戍华
WANG Xiang-zhou(王向周), LU Ye(陆叶), ZHENG Shu-hua(郑戍华)
(School of Automation, Beijing Institute of Technology, Beijing 100081, China)
Novel method for operating characteristics test of a hydraulic pump
WANG Xiang-zhou(王向周), LU Ye(陆叶), ZHENG Shu-hua(郑戍华)
(School of Automation, Beijing Institute of Technology, Beijing 100081, China)
The traditional testing method of a hydraulic pump requires a large amount of test data from a variety of pump working conditions. The test is usually time-consuming and energy-consuming. And the accurate characteristic curves of the pump were hardly obtained due to a limited amount and discreteness of the test data. In order to simplify the test procedure and improve the test accuracy, a novel method for measuring hydraulic pump operating characteristic based on multi-element nonlinear regression (NLMR) modeling is proposed in this paper. The main idea of this modeling method is establishing a mathematical model to predict the performance parameters of the hydraulic pump, only a small amount of test data is needed. Consequently, the pump operating characteristics in any working conditions are obtained. And the test results of the pump are easily characterized in the graphs, charts, tables and so on. The evaluations of the model are carried out and discussed in this paper. The result shows that the test error of the novel method can be controlled to be about 0.1%. Compared with the traditional test method, the proposed method reduces greatly the test time and the random error of the test data, and improves the efficiency and accuracy of the pump test.
hydraulic pump; test; model; work characteristics
The traditional testing method demands that the hydraulic pump should be tested under a variety of pump working conditions. A lot of time and energy were consumed during the test procedure, and the test data were mixed with the random error. In recent years, more and more emerging technologies have been introduced to the operating characteristics test of pumps. For example, H Yang measured the flow of a centrifugal pump with 3-D particle image velocimetry (PIV), the maximum test error was about 3.14%[1]. ProMinent Dosiertechnik Gmbh adapted a computer to control and parameterize the individual components in a new pump test bench, all the input parameters were monitored, analyzed, and documented by an operating data collection system. The new pump test bench improved the test efficiency and the measured value has an accuracy of 0.1%[2]. Tao increased the measurement accuracy and automated the measurement operation in a nonlinear feedback with a proportional-integral (PI) controller[3]. Although these new technologies were helpful in the work characteristics test of pump to some extent, they can’t overcome the defects existing in the traditional testing method completely[4]. According to the traditional testing method, the test data was usually processed with simple numerical methods (such as an interpolation method) to present characteristic curves which could describe work characteristics of the pump. For example, Warren E Wilson proposed the method of calculating the performance curves with the test data, including the flow curve, the torque curve, the power curve, the efficiency curve, the equivalent efficiency curve and so on[5]. Shaharm Derekhshan developed the performance curves with an interpolation method and predicted the best efficiency point of a pump[6]. Kochevsky developed a method of computational fluid dynamics (CFD) to predict performance parameters of centrifugal pumps treating multiphase mixture[7]. The simple numerical methods couldn’t eliminate the random error mixed with the test data, sometimes the test error might be even amplified. So the accurate characteristic curves of the tested pump were hardly obtained with traditional testing methods. And due to a limited amount and discreteness of the test data, only a few characteristic curves could be acquired with the traditional testing method. Hence the work characteristics under various working conditions couldn’t be obtained by users. In addition, traditional testing method was difficult to meet the requirements of the performance test on hydraulic pumps. It required a large amount of experimental data under a variety of pump working conditions and complex experiments. In the test process, not only a lot of time and energy were consumed, but also test data was mixed with some measurement errors. Moreover, the representation of the test results was monotonous.
The goal of this paper is to discuss a novel method for performance test of pump based onthe multi-element nonlinear regression (NLMR) theory. The test points can be reduced significantly while the efficiency and accuracy of the test are both improved. And the accurate work characteristics in any working condition can be obtained with just a small amount of test data, and the work characteristics can be characterized as the graphs, charts and tables and so on.
1 Acquisition and analysis of the test data
The modeling object should be determined before the mathematical model is established. In this paper, a work characteristics test on the hydraulic pump was conducted and a small amount of test data is acquired. By analyzing the test data, the appropriate modeling object can be determined.
1.1 Test procedure and analysis of the test data
The pump is tested according to the National Standard GB/T 17491—2011[8]. And the complete test system diagram is shown in Fig.1.
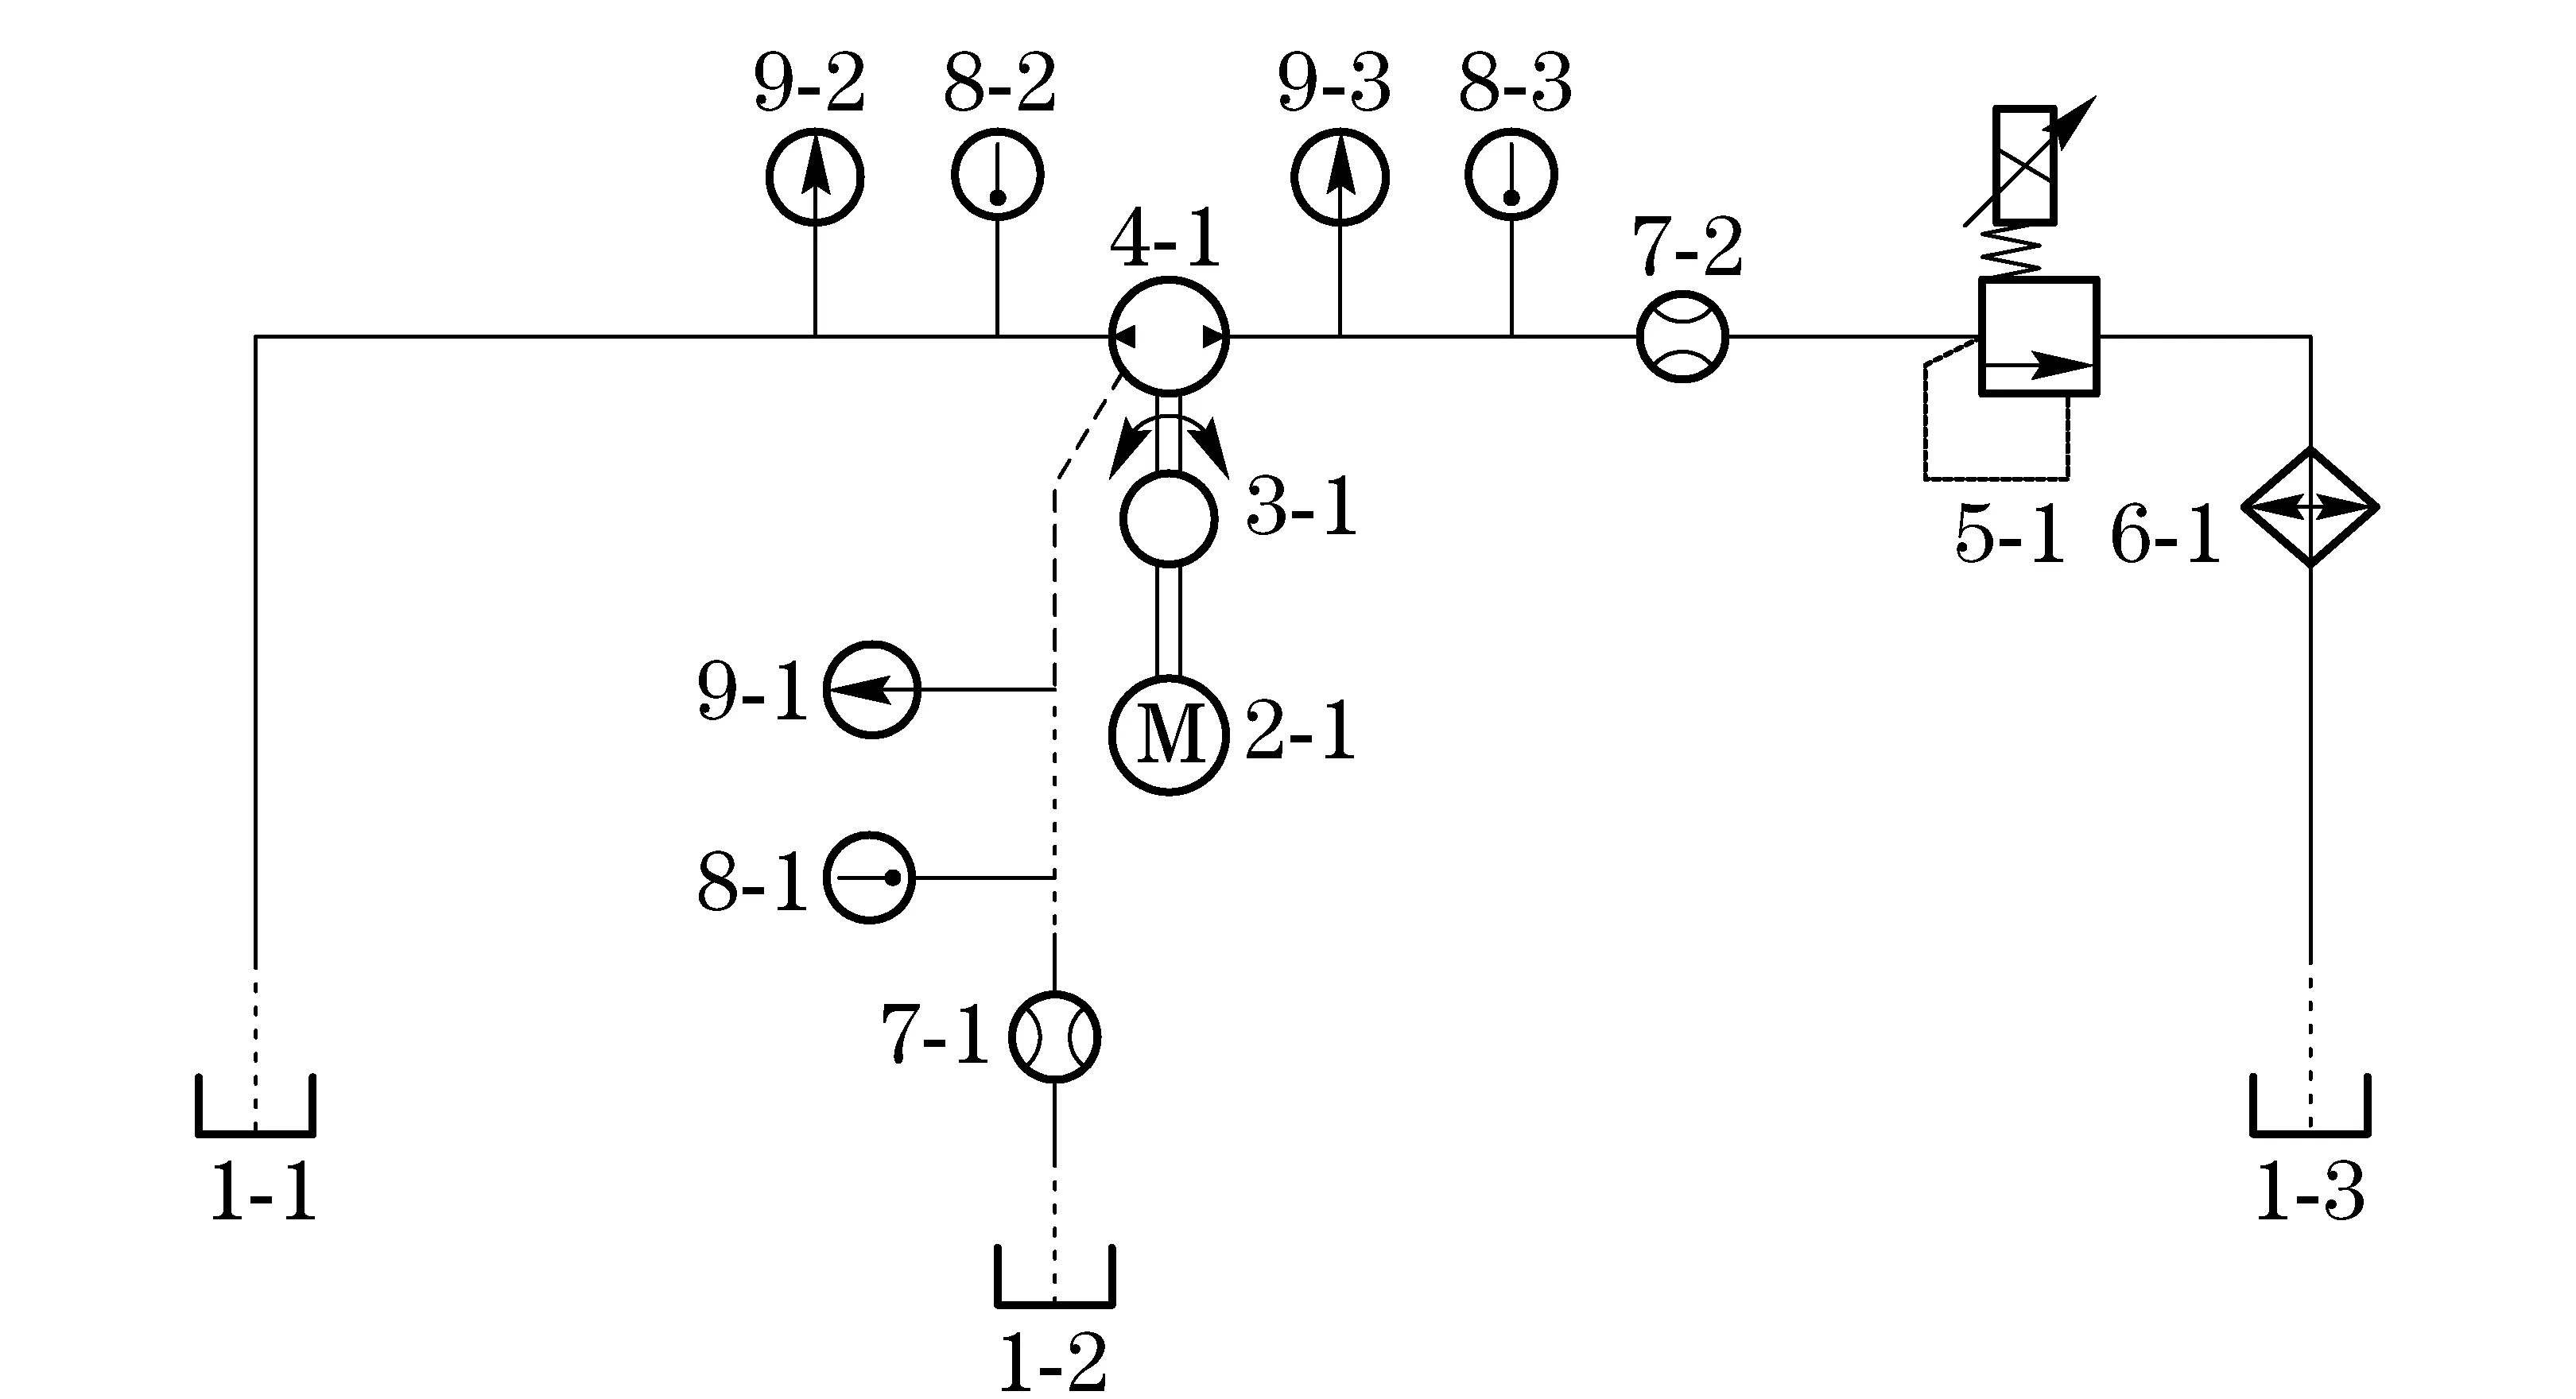
Fig.1 Experiment system
As shown in Fig.1, the pump is working in an open circuit and driven by an inverter motor. The relief valve is used to load for the pump. The torque and the rotational speed are measured by the torque gauge. The flows are measured by the volumetric flow sensor and the pressures are measured by the pressure sensors. The entire test data are collected in the computer through the DAQ device. The major components used to measure and collect data are shown in Tab.1.
In the test, the pump of axial piston A7V80DR manufactured by REXROTH is Used. The inlet pressure of the pump is set at 0 MPa and the oil temperature is controlled in the range from 42.0 ℃ to 44.9 ℃. The test procedure is listed as follows:
Keeping the pump rotational speed at 400 r/min and increasing the load of the pump gradually, the parameters are measured when the pressure is at 3.5, 7.0, 12.0, 16.0, 20.0, 25.0, 30.0 MPa, respectively.
Increasing the pump rotational speed gradually, the above test procedure is repeated when the pump rotational speed is fixed at 400, 600, 825, 1 050, 1 275, 1 500, 1 600 r/min.
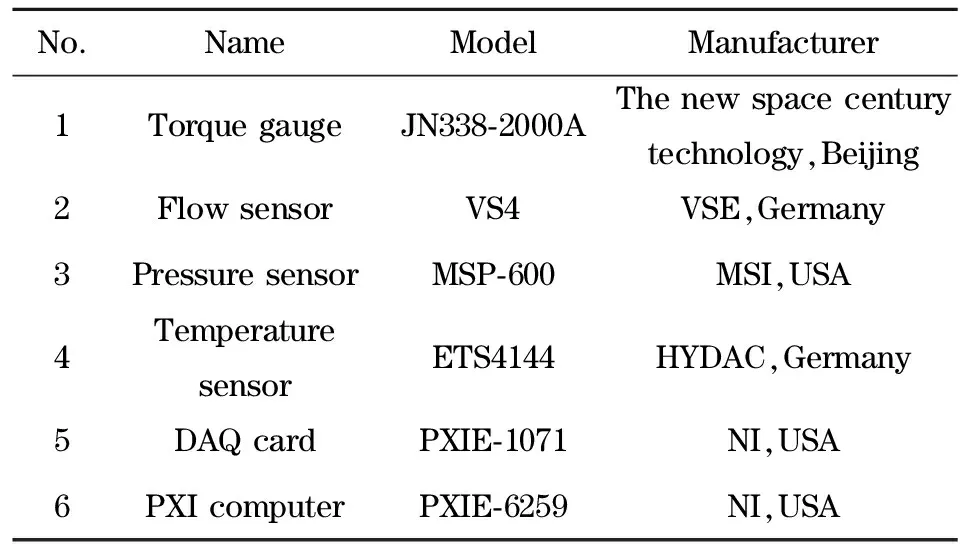
Tab.1 List of the major components of the experiment system
After measuring all the parameters which can be tested directly, other parameters such as the power and the efficiency can be calculated based on the test data. Finally 49 sets of test data are acquired in Tab.2.
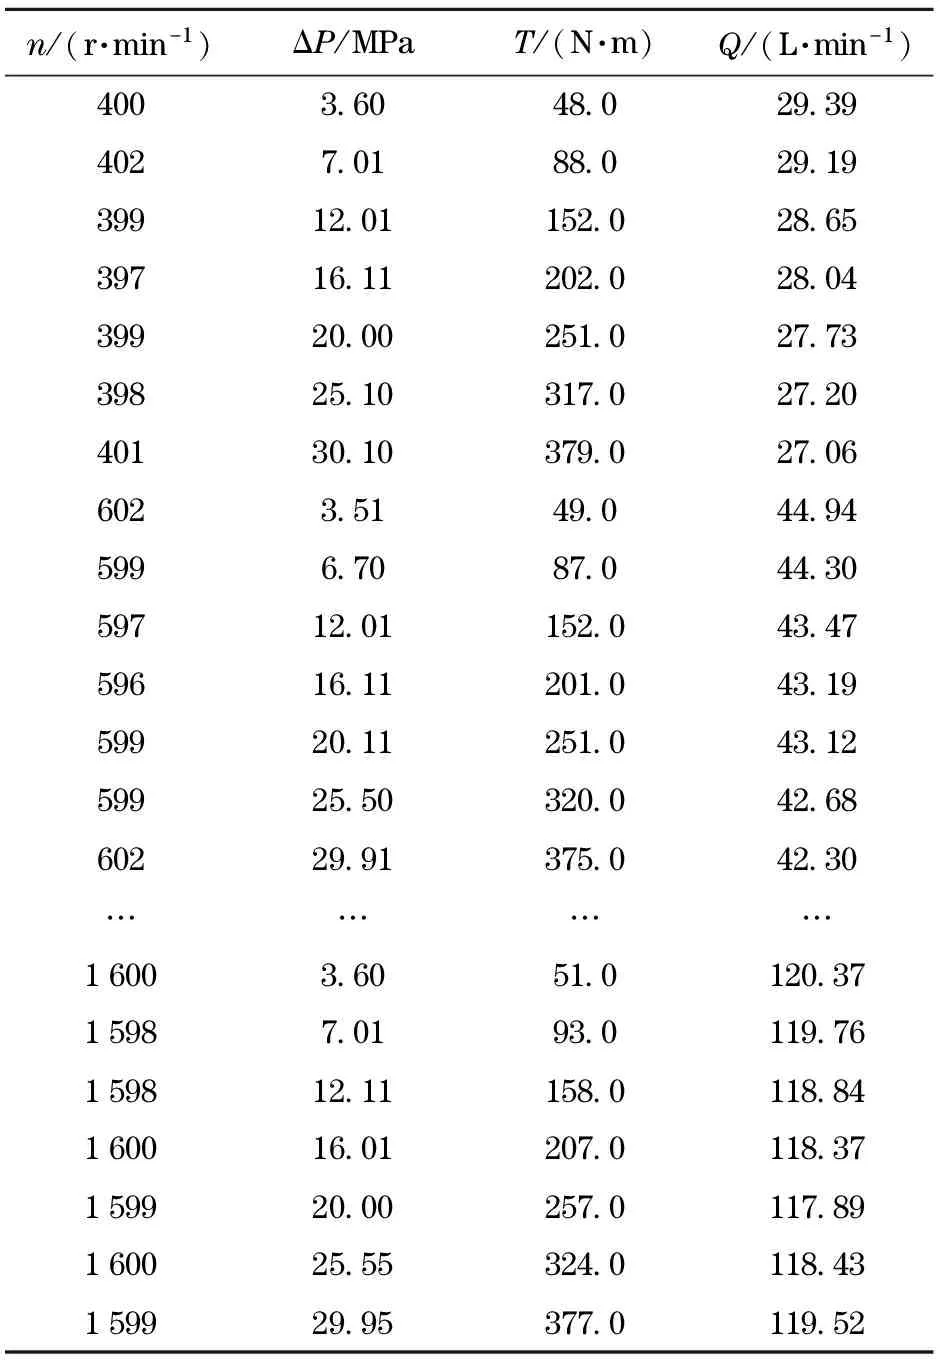
Tab.2 Experimental data from pump A7V80DR
The rotational speed and the torque are pump’s inputs while the flows and pressures are the outputs of the pump. By analyzing the test datain in Tab.1, it can be found that the pump driving torque is determined by the differential pressure between the inlet and outlet of the pump and influenced by the pump rotational speed. Similarly, the output flow of the pump is determined by the rotational speed and influenced by the differential pressure.
In theory, the input torque of the pump is proportional to the output pressure of the pump. But the actual values of input torque of the pump are greater than the ones in theory calculation due to the existence of coulomb friction between the bearings and other parts inside the pump. The difference between the theoretical torque and the actual torque is called the torque loss of the pump. The loss of torque is usually evaluated by mechanical efficiencyηt[9]
(1)
whereTtis the torque in theory;Tis the torque in actual.
The output flow of the pump is proportional to the input rotational speed of the pump. But the actual flow is less than the one in theory due to the leakage of oil. The flow loss of the pump is usually evaluated by volumetric efficiencyηvas follows
(2)
whereQtis the flow in theory;Qis the flow in actual.
In fact, the volumetric efficiency and the mechanical efficiency are the most important indicators in evaluating the performance of the pump[10]. Meanwhile, the experiments show that the volumetric efficiency and the mechanical efficiency are both evaluated by the loss characteristics of the pump. So the losing characteristics of the pump are selected for modeling the pump in this paper.
1.2 Losing characteristics analysis
The losing characteristics of the pump can fully reflect pump’s work characteristics under any working condition. And loss characteristics of the pump are more suitable for the modeling method than the actual torques and flows of the pump due to their smaller values. Therefore, the torque and flow loss characteristics of the pump are adopted to build the NLMR models.
According to the 49 sets of test data, the torque loss and flow loss in test points are acquired as shown in Fig.2 and Fig.3. The scatter points represent the torque loss and the flow loss calculated by test points. The figures show that the torque loss and flow loss are the nonlinear and multi-parameter coupling systems. Hence a nonlinear function which can describe the losing characteristics should be determined first.

Fig.2 The torque loss
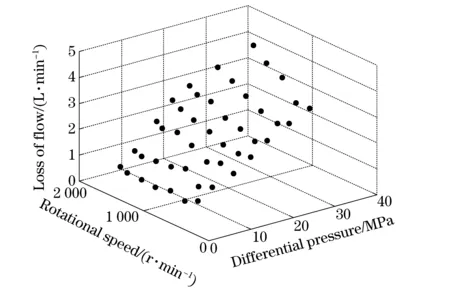
Fig.3 The flow loss
2 NLMR models description
2.1 NLMR theory
The multi-element nonlinear regression (NLMR) is a simple and effective method in data processing. Specifically, it is a kind of method to find a nonlinear model describing the relationship between the dependent variable and a set of independent variables[11]. The mathematical model based on NLMR can extract a valuable common law from great amounts of engineering on-site data and the results can rapidly provide suggestions back to engineering practice[12]. Therefore, it has been more and more widely used in complex engineering problems which are nonlinear and multi-parameter coupling. Li et al. employed the model to reasonably eliminate the transmission congestion and optimize the electric power system[13]. Zhang et al. developed a nonlinear regression model which could successfully predict the toxicity of alkyphenol compounds[14]. However, the multi-element nonlinear regression NLMR theory is still not introduced into the performance work characteristics test on hydraulic pump.
2.2 Establishment of NLMR models
It can be known from section 2 that a nonlinear function is suitable for building the loss models. First, a class of functions are defined as
φ=span{φ0,φ1,φ2,…,φn}
(3)
{φ0,φ1,φ2,…,φn} are the continuous and linear independent functions.
Weierstrass approximation theorem states: iffis a continuous real-valued function on a closed interval and if anyε>0 is given, then there exists a polynomialPon the closed interval such that
|f-P|<ε
(4)
In other words, every continuous function defined on a closed interval can be uniformly approximated by a polynomial function to any degree of accuracy. Consequently, polynomial functions can be selected from classφ, the structure is
(5)
whereaiis the undetermined coefficient.
Considering that the mathematical model must be able to describe the relationship between the loss and the rotational speed or the differential pressure, a mathematical model which can describe the torque loss and flow loss is acquired after comparative researches and repeated experiments.
The losing characteristics of pumps can be described in the NLMR models as follows:
(6)
where ΔPis the differential pressure;nis the rotational speed;mis the order of model;akis the undetermined coefficient;is the loss of torque or flow.
2.3 Calculation of model coefficient
The methods to calculate the model coefficients can be roughly categorized into two classes: the interpolation and the approximation. The interpolation method requires that the function curve must pass through all the original data points regardless of the random errors included in the test data. So the approximation method is preferred than the interpolation method. The least square method is a typical case of the approximation method.
The third-order model is selected as an example to show how to calculate the coefficientakwith the least square method. The structure of the third-order model is as follows:
Δ=a1+a2ΔP+a3n+a4ΔP2+a5ΔPn+a6n2+a7ΔP3+a8ΔP2n+a9ΔPn2+a10n3
(7)
Define
(8)
the third-order model can be linearized as follows:
Δ=a1+a2x2+a3x3+a4x4+a5x5+a6x6+a7x7+a8x8+a9x9+a10x10
(9)
the sum of error squaresvis defined as:
(10)
where Δyiis the torque loss or the flow loss calculated by test data and Δiis the one calculated by the loss models.
According to the least square theory,akis calculated based on the principle:
v=[v]min
(11)
or
(12)
Therefore we have
(13)
Then the equations are simplified as follows:
(14)
The matrix representation is
XTXA=XTΔy
(15)
Ais the coefficient matrix:
A=[a1,a2,a3…a10]T
(16)
Δyis observation vector:
与其他脏腑的关系:中医又有“心开窍于耳”之说,所以耳属心肾二脏之窍,但以肾为主,以心为客。耳与肝胆相连,肝气通于耳,肝气调达,则听力聪敏。肝胆主升发,喜条达,若肝胆失调,胆经有热,易上逆于耳而为病。脾主运化而升清,脾气健旺,气血充沛,清阳之气上奉耳,则耳的功能正常;若脾失健运,气血不足,则耳失所养而失聪;若湿邪困脾,清阳不升,浊阴不降,则蒙蔽耳窍而为病。耳与肺亦有一定关系,在临床上,耳病初起,往往出现邪气在表的肺经症状。耳通过经脉与脏腑和全身广泛地联系,因此有人将耳窍分区,分别隶属于人体各部,并以此作为耳穴诊断疾病和治疗疾病的依据。
Δy=[Δy1,Δy2,Δy3…Δy10]T
(17)
Xis observation matrix:
(18)
thenAis calculated by
A=(XTX)-1XTΔy
(19)
In the above equations, the observation matrixXcan be calculated with the rotational speed and the differential pressure. The observation vector Δywhich represents the torque loss or the flow loss can also be calculated with the test data. Consequently the coefficient matrixAcan be obtained and the complete loss models are established.
3 Evaluation of the loss models
3.1 The evaluation criterion
In this section, the further research is conducted by combining with the test data to discuss the accuracy of the models with different orders. The mean-square-root error (RMSE,Rfor short), the average relative error (ARE,Efor short) and the maximum relative error (MRE,Mfor short) are introduced for evaluation purpose.
Denotedias the absolute error andεias the relative error between the parameters calculated by test data and model respectively.nrepresents the number of test points.
RMSE is an important parameter for evaluating the accuracy of regression models. It’s a meaningful measure of dispersion of data.
(20)
ARE is the arithmetic average of the relative errors calculated above. It’s defined as
(21)
M={εi}max
(22)
3.2 Evaluation of the loss models with different orders
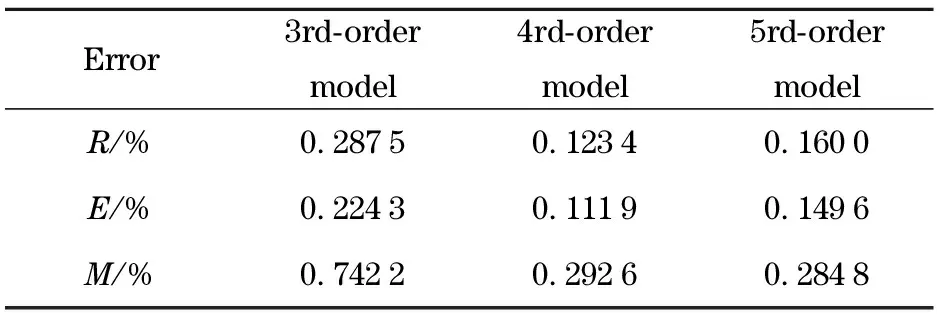
Combined with the test data, RMSE, ARE and MRE are calculated to evaluate the accuracy of the loss models with different orders. The results are shown in Tab.3.
Tab.3 gives evaluation results of the loss models with different orders. It can be seen that the variation of MRE is much larger than the variation of RMSE and ARE. It demonstrates that the modeling method is able to eliminate the random errors included in the test data and improve the test accuracy.
Tab.3 Results of evaluation
Based on Tab.3, a histogram is acquired as shown in Fig.4.

Fig.4 Results of evaluation
It can be seen from Tab.3 and Fig.4 that the outputs of the fourth-order and the fifth-order models are close to the original data. Both of their average relative errors are controlled at about 0.1%, less than the third-order model. The mean-square-root error of the fourth-order model is about 0.12% and the maximum relative error is controlled under 0.3%. It demonstrates that the fourth-order model has a good fitting effect in all the test points and meets the requirements of engineering test.
The volumetric efficiency, the mechanical efficiency and the overall efficiency in any working condition can be predicted with the loss models. To evaluate the loss models with different orders more intuitively, 10 sets of test data are randomly selected. And the relative errors between the predicted efficiency and the true one calculated with the test data are gained as follows.
It can be seen from Figs.5-7 that the fourth-order and fifth-order models are more accurate than the third-order model. The largest relative errors of the fourth-order and fifth-order models are both controlled under 0.3% while the largest relative error of third-order model is over 0.7%. Considering that the fifth-order model needs more test data to calculate the coefficients, the fourth-order polynomial function is selected for modeling the torque loss and the flow loss of pump. The loss model can be represented by
y=a1+a2Δp+a3n+a4Δp2+a5Δpn+a6n2+a7Δp3+a8Δp2n+a9Δpn2+a10n3+a11Δp4+a12Δp3n+a13Δp2n2+a14Δpn3+a15n4
(22)

Fig.5 Relative error of volumetric efficiency calculated by loss models with different orders

Fig.6 Relative error of mechanical efficiency calculated by loss models with different orders
The complete loss models are established and can be used to predict the work characteristics of the pump. The fitting effects of the loss models are shown in Figs.8-9.
The scatter pointsin Figs.8-9 are original data. The surfaces are drawn according to the loss models. It can be seen that about 98% of the scatter points are located near the surface. Therefore, the fourth-order polynomial function is suitable for modeling the loss of torque and flow in the performance test on pump.
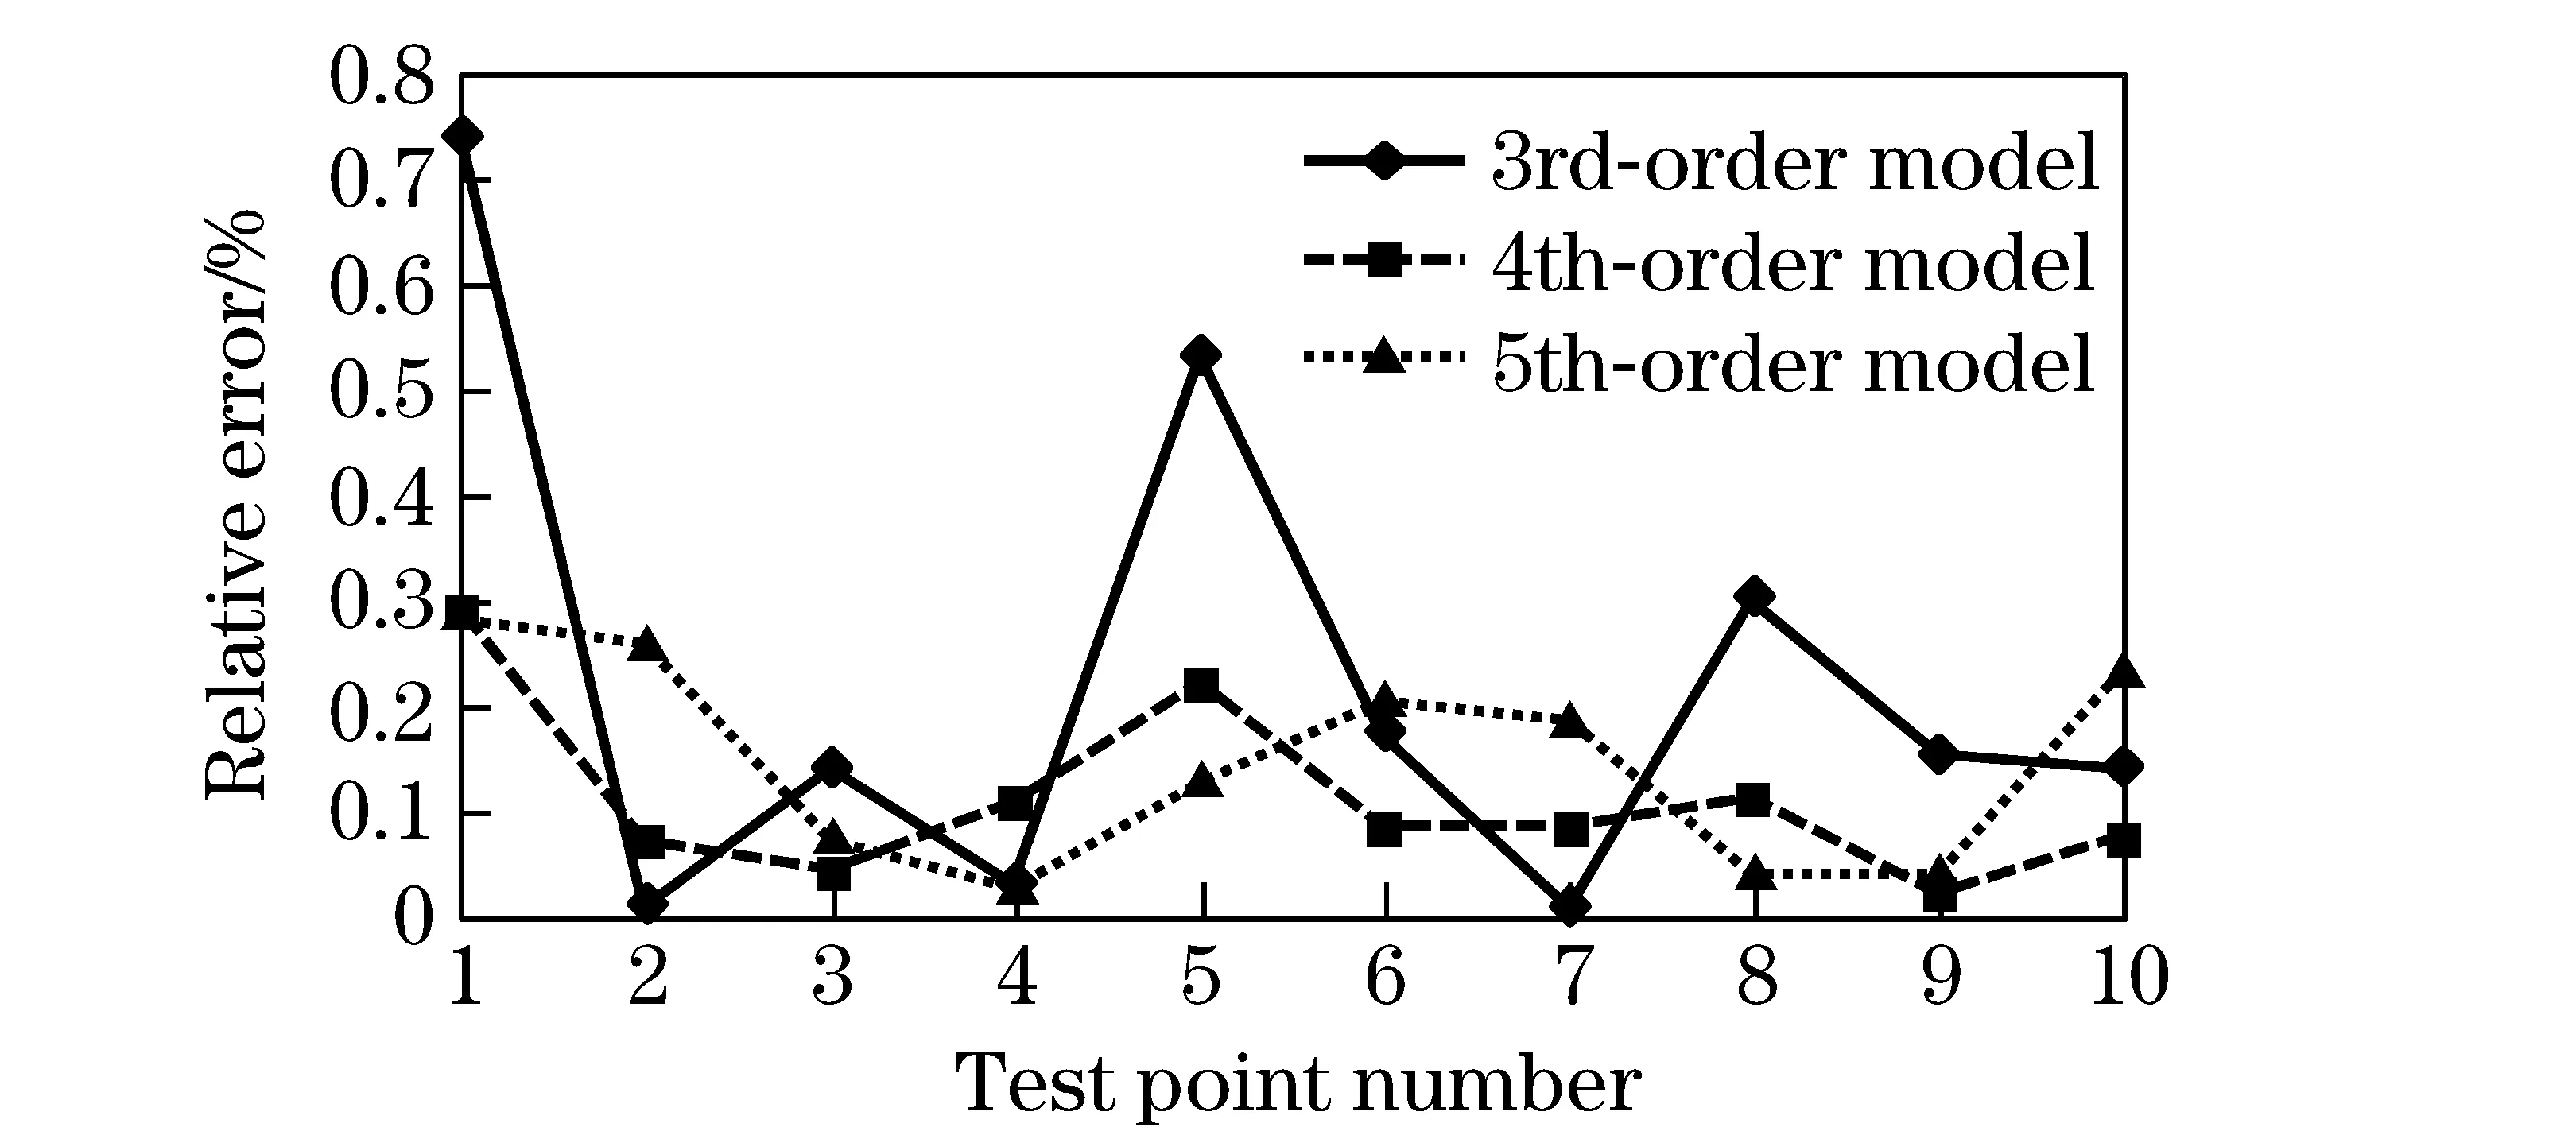
Fig.7 Relative error of overall efficiency calculated by loss models with different orders

Fig.8 The loss of torque
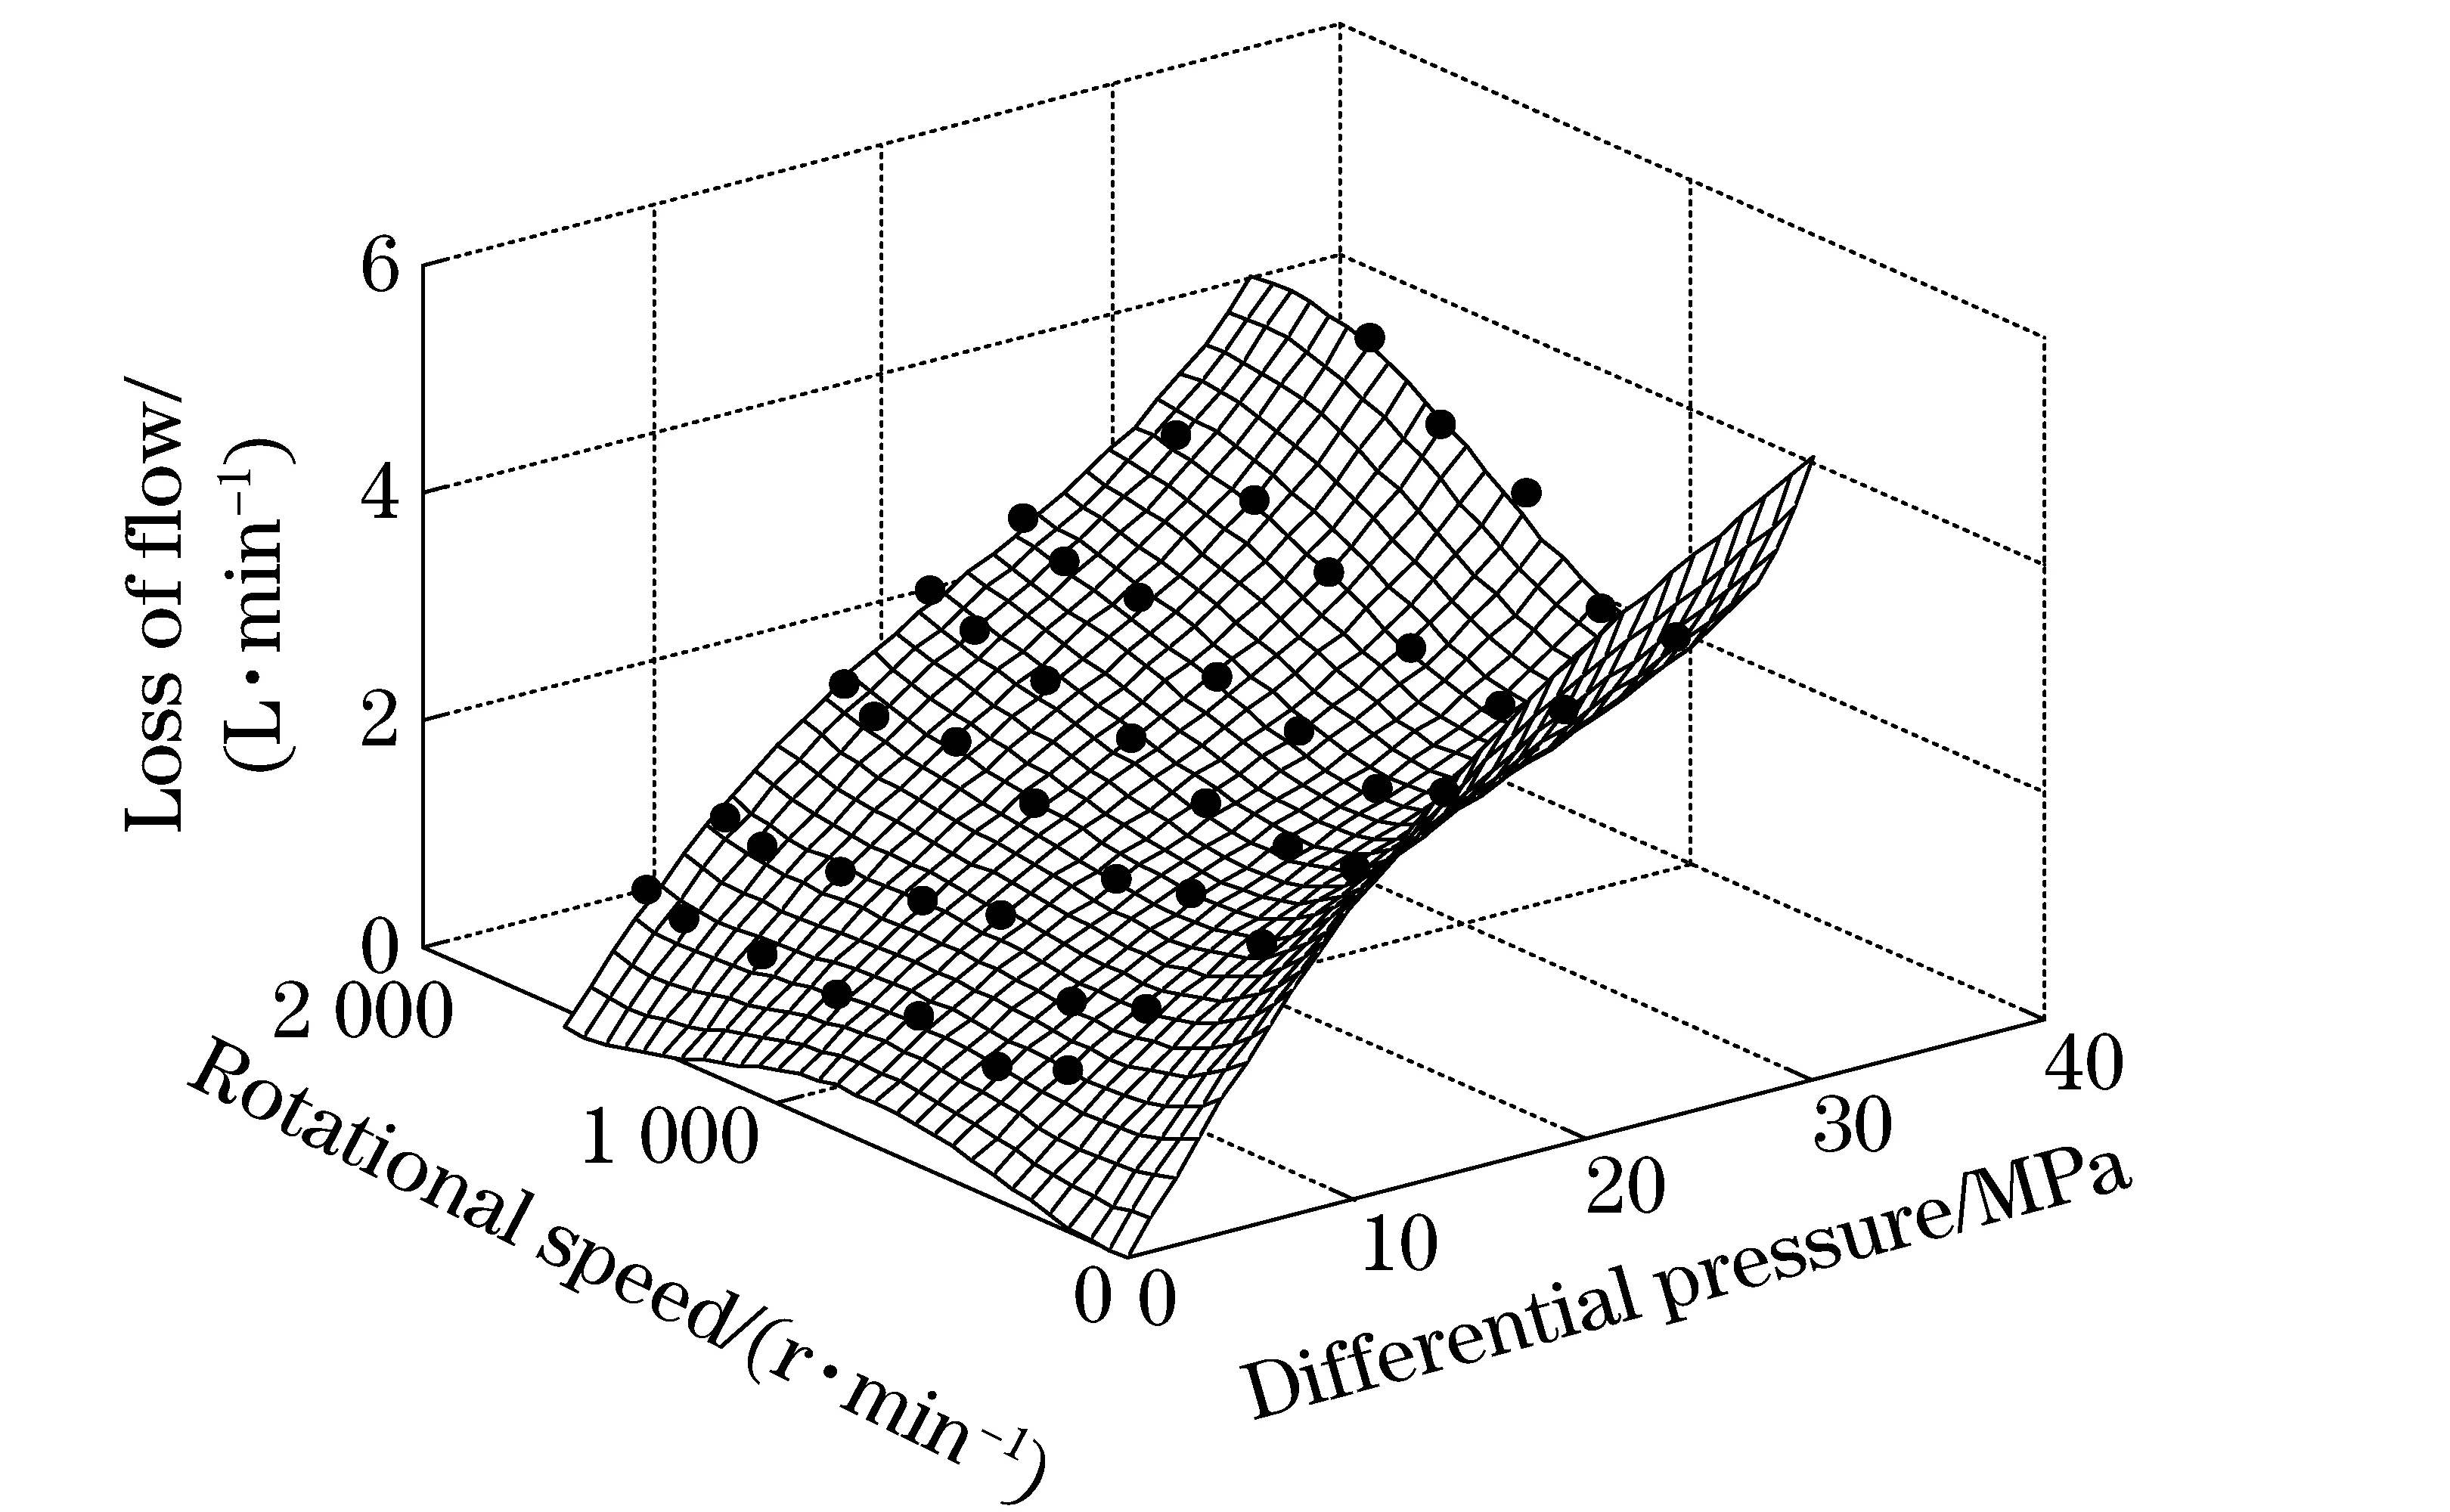
Fig.9 The loss of flow
4 Application of the modeling method in pump test
The test results can only be represented with the incomplete performance curves or the characteristic curves with the traditional testing method of pump. Thanks to the modeling method, all the performance parameters in any working condition can be obtained by the loss models. And test results can be easily characterized as the graphs, charts, tables, even 3D graphs.
As shown in Figs.10-12, the test results are characterized as the 3D graphs on LabVIEW. The graphs contain the torque surface, the input power surface and the overall efficiency surface which can reflect the pump’s work characteristics at various rotational speeds and pressures. And the pump work characteristics in any working condition could be easily obtained by users.

Fig.10 The torque surface

Fig.11 The input power surface

Fig.12 The overall efficiency surface
Figs.13-15 are the contour charts reflecting pump’s performance, including the equivalent torque curves, the equivalent power curves and the equivalent efficiency curves. With the contour charts, pumps’ work characteristics can be acquired quite easily. The traditional test method only gave several inaccurate curves. Thanks to the modeling method proposed in this paper, the contour charts can be derived from the 3D graphs directly and users can obtain the contour curves at different values as many as they want. Besides that, the modeling method can eliminate the random errors mixed with the test data by surface-fitting. Consequently, the contour curves drawn with the modeling method are much more accurate than ones by the traditional method.
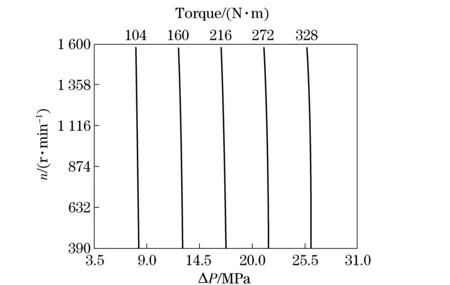
Fig.13 Equivalent torque curve
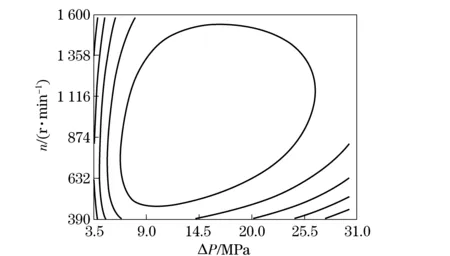
Fig.15 Equivalent efficiency curve
5 Conclusions
The modeling method for operating performance test of pump is presented. The loss models for predicting the torque loss and the flow loss are discussed and evaluated. Compared with the traditional test method, the modeling method has some advantages listed in the following.
First, the number of test points has been reduced to half of the conventional method. A lot of time and energy are saved. The testing efficiency is improved greatly.
Second, the modeling method can suppress the random errors of the raw test data by surface-fitting with the least square method. And the test accuracy is improved greatly.
Finally, the work characteristics of the pump in any working condition can be obtained easily. The test results of pump can be characterized as the graphs, charts, tables, even 3D graphs.
[1] Yang H, Xu H R, Liu C. Flow measurements in a model centrifugal pump by 3-D PIV[J]. IOP Conference Series: Earth and Environmental Science, 2012, 15(6): 562-570.
[2] ProMinent. API 675 test bed for ProMInent process pumps[J]. World Pumps, 2011, 9: 10.
[3] Tao Jianfeng, Liu Chengliang, Gu Jianjiang. Improvements to the measurement of electrically controlled hydraulic pumps’ flow /pressure characteristics[J]. Measurement Science and Technology, 2011, 22(6): 354-364.
[4] Li Zhongshan, Zhang Jintao, Zhang Yaojuan, et al. The development of intelligent measurement and control system about the test and experimental platform of hydraulic pump performance[C]∥ MEC, 2011:576-579.
[5] Warren Wilson. Positive-displacement pumps and fluid motors[M]. New York: Pitman Publishing Corporation Press, 1950:152-180.
[6] Shahram Derekhshan, Ahmad Nourbakhsh. Experimental study of characteristic curves of centrifugal pumps working as turbines in different specific speeds[J]. Experimental Thermal and Fluid Science, 2008, 32: 800-807.
[7] Alexey N Kochevsky. Capabilities of numerical simulation of multiphase flows in centrifugal pumps using modern CFD software[EB/OL]. [2005-09-22].http:∥arxiv:physics/0509193.
[8] GB/T 17491—2011, Hydraulic fluid power-positive displacement pumps, motors and integral transmissions—Methods of testing and presenting basic steady state performance[S]. Beijing: Chinese Standards Press, 2011.
[9] Choi S B, Yoo J K, Cho M S, et al. Position control of a cylinder system using a piezoactuator-driven pump[J]. Mechatronics, 2005, 15: 239-249.
[10] Wu H W, Lee C B. Influence of a relief valve on the performance of a pump/inverter controlled hydraulic motor system[J]. Mechatronics, 1996, 6:1-19.
[11] Yagiz S. Utilizing rock mass properties for predicting TBM performance in hard rock condition[J]. Tunnelling and Underground Space Technology, 2008, 23: 326-39.
[12] Zhang Qian, Kang Yilan, Cai Zongxi, et al. A nonlinear multiple regression model for load identification of shield machine combined with mechanical analysis[C]∥FSKD, 2011:1212-1216.
[13] Li Chunyan, Yu Jihui, Xie Kaigui, et al. Optimal model of congestion management based on non-linear regression[J]. Transactions of China University of Mining & Technology, 2008, 2: 861-863.
[14] Zhang Hui, Kong Fanxiang, Yu Yang, et al. Combined estrogenic effects of alkyphenolic compounds[J]. Environmental Chemistry, 2009,3:329-33.
(Edited by Wang Yuxia)
10.15918/j.jbit1004-0579.201524.0111
TG 806 Document code: A Article ID: 1004- 0579(2015)01- 0074- 09
Received 2013- 05- 15
Supported by the National Science & Technology Pillar Program During the 12th Five-Year Plan Period (2014BAF08B06); the Research Foundation of Beijing Institute of Technology (20110601061)
E-mail: zhengshuhua@bit.edu.cn
猜你喜欢
基层中医药(2022年1期)2022-07-22
家庭科学·新健康(2022年3期)2022-05-10
内燃机与配件(2022年2期)2022-01-17
中老年保健(2021年4期)2021-08-22
女士(2017年8期)2017-08-08
临床医药文献杂志(电子版)(2017年11期)2017-05-17
广东饲料(2016年2期)2016-12-01
湖南畜牧兽医(2016年3期)2016-06-05
兽医导刊(2016年12期)2016-05-17
哈尔滨医药(2015年6期)2015-12-01
 Journal of Beijing Institute of Technology2015年1期
- Journal of Beijing Institute of Technology的其它文章
- Numerical simulation of the delay arming process of initiating explosive brakes
- Optimized design of biconical liner by orthogonal method
- Wideband acoustic source localization using multiple spherical arrays: anangular-spectrum smoothing approach
- Influence of eddy current on transient characteristics of common rail injector solenoid valve
- Designing the cooling system of a hybrid electric vehicle with multi-heat source
- Novel miniature pneumatic pressure regulator for hopping robots