
Relationship between number of passing events and operating parameters in m ixed bicycle traffic
2015-07-25 06:04YanXingchenHePengChenJunYeXiaofeiLiuQingchao
Yan XingchenHe PengChen JunYe XiaofeiLiu Qingchao
(1School of Transportation,Southeast University,Nanjing 210096,China)
(2School of Maritime and Transportation,Ningbo University,Ningbo 315211,China)
Relationship between number of passing events and operating parameters in m ixed bicycle traffic
Yan Xingchen1He Peng1Chen Jun1Ye Xiaofei2Liu Qingchao1
(1School of Transportation,Southeast University,Nanjing 210096,China)
(2School of Maritime and Transportation,Ningbo University,Ningbo 315211,China)
This paper investigates the passing events between electric bicycles and conventional bicycles and explores the relationships between passing events and traffic parameters in bicycle facilities.Three exclusive bicycle paths in Nanjing,China,were observed w ith cameras.Then,the field data including vehicle number,velocity characteristics and passing event features were analyzed in detail.Data analysis and fitting reveal that the speed difference has little impact on the passing eventnumber,as does the bicycle ratio.The Gaussian function can better describe the relationship between the passing eventnumber and bicycle volume(density).The valid use level of bicycle path w idth influences the inflexion of the passing events-density fitting curve.The conclusions can be applied for estimating the passing events in mixed bicycle flows and for choosing a suitable width of separate bicycle path.
mixed bicycle traffic;passing events;traffic operating parameters;correlation analysis
Botma[1]first applied passing events to determ ine bicycle facilities’levels of service(LOS).Then the passing eventwas adopted by the Highway Capacity Manual(HCM)2000[2]and 2010[3].According to the formulae reported in HCM 2000 and 2010,the number of passing events keeps a linear and positive relationship w ith bicycle volume.These results are based on the observation of non-motorized facilities in Western countries.However,facilities in China are different from their counterparts in the West.First,bicycle lanes are set separately on the curbside of roads w ithout lane-splitting.All bicycles run in the same direction along each side.During the commuting period,bicycle volume is much larger than that in the West.Meanwhile,electric bicycles(e-bicycle)and conventional bicycles(c-bicycle)run on the same paths or lanes.E-bicycles contribute to larger speed difference in non-motorized flow due to their higher speeds in contrast to c-bicycles.For these reasons,it is uncertain whether passing events in the non-motorized flow keep a positive relationship w ith volume and other parameters.
Passing events,first proposed by Botma[1],were used to evaluate the bicycle level of service(BLOS)in 1995.Then the indicator was accepted by other researchers. Scholars conduct_ed many studies in bicycle’s passing and meeting events[411].Most of them paid attention to the passing events of the conventional bicycles.The findings were comprehensive and practical,including the characteristics of passing maneuvers,the application of passing events to BLOS evaluation and passing event type,etc.However,few researchers studied the passing events of e-bicycle-passing-bicyclew ith sim ilarmethods used in bicycle research.Moreover,the studies of relationships between passing events and bicycle traffic parameters were scarce.To bridge the gap,a detailed observation was conducted in Nanjing and field data was collected to explain the relationship.
The objective of this paper is to study the relationships between passing events in bicycle flow and traffic parameters in Nanjing.Statistical analysis and curve fitting are adopted to process the data captured by cameras.The facilities selected are exclusive non-motorized paths,on which traffic flow aremainly c-bicycles and e-bicycles.If not particularly noted,bicyclemeans c-bicycle.
1 Data Collection
Bicycle traffic observation was carried outbetween July 7,2014 and July 9,2014 at three sites in Nanjing under peak traffic conditions.The criteria for selection of survey sites are as follows:
1)Paved level terrain,good view;
2)Enough distance from intersections,block accesses and bus stations;
3)Large bicycle volume;
4)Availability of an acceptable vantage point for the video recorder.
According to the criteria above,three exclusive nonmotorized path segments are finally determ ined for videotaping,which are on Hunan Road,Zhongshan Road and Longpan Road in Nanjing.To obtain characteristic data,the w idth of the chosen paths varies from 2 to 4 m,representing the paths of 1,2 and 3 lanes.Ref.[3]reported that the required length of bike-passing-bike events was100 ft(30.4 m).Due to e-bicycles’higher velocity,the length of e-bicycle-passing-bicycle should be less than 30.4 m.However,the investigations of e-bicycle-passing-e-bicycle events were required.Therefore,we chose 50 m as our observation length.The observations were carried out during morning peak period(7:30 to 9:00)and evening peak period(16:00 to 19:00).
The tools used for the observation are as follows:a measuring tape of 30 m long,two digital video cameras(Sony DCR-SR20E,resolution 720×576 pixels),two tripods,yellow tape,and 4 suits of yellow flags.It is noted that the tripods we used are special tripods w ith a maximum height of 4 m.W ith them,the camera can obtain a high view point,which guarantees wider shooting range and better visibility.
Fig.1 indicates the setting details and the effects of the field work.As soon as everything was ready,the two cameras were started and shooting lasted for 1 h.
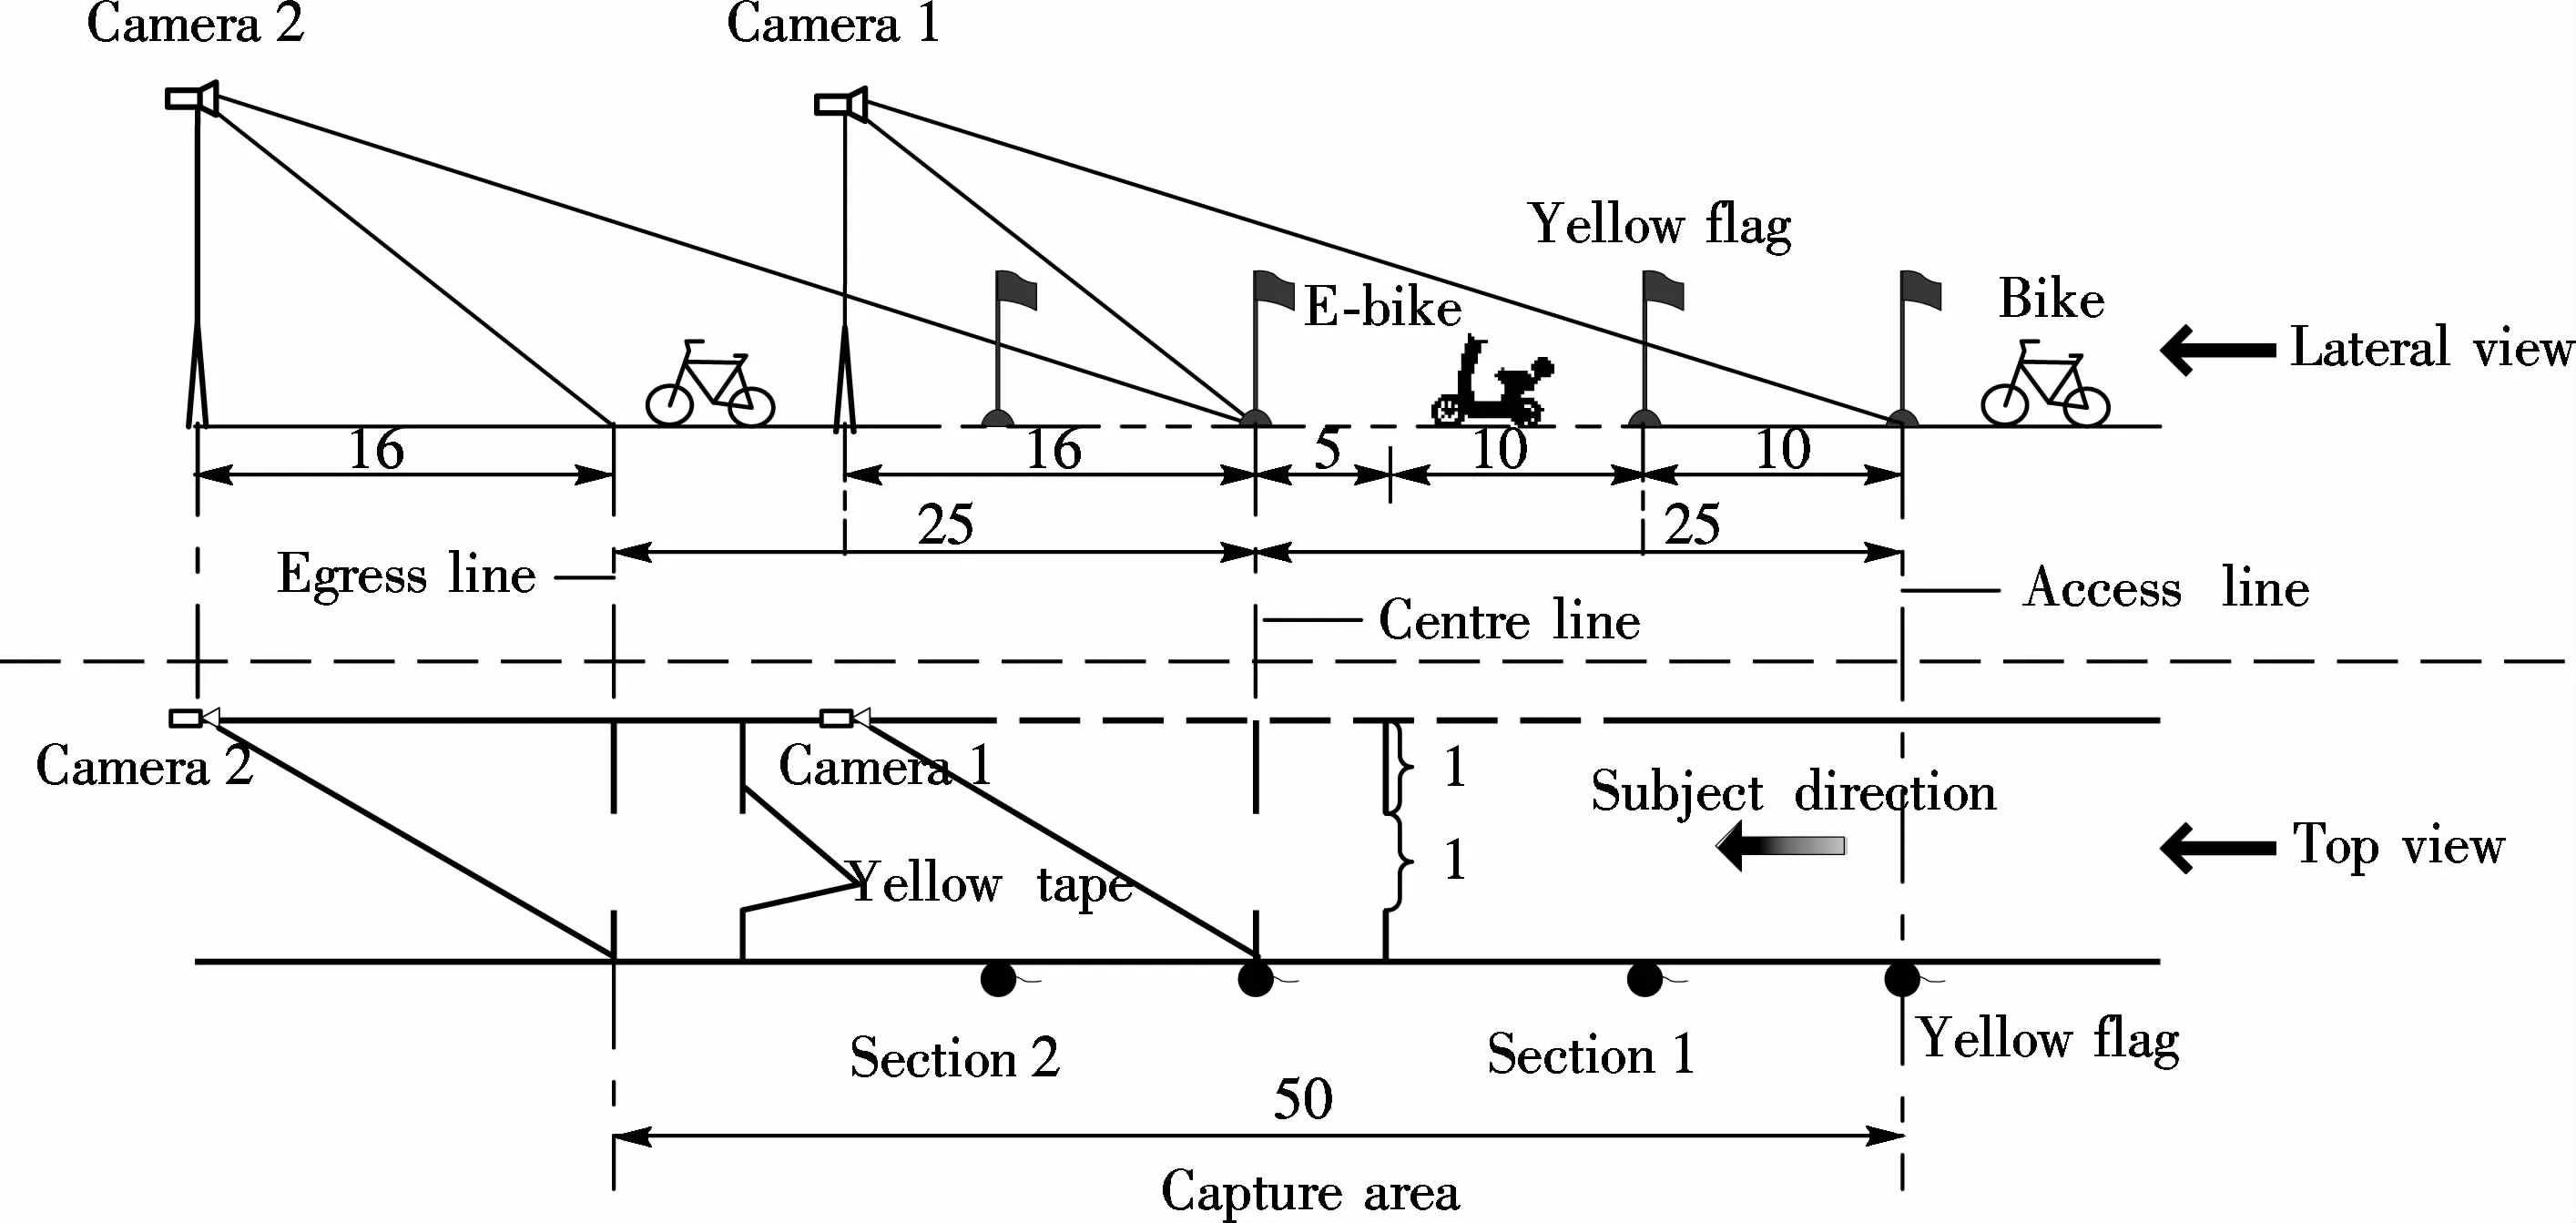
Fig.1 Setting details for the observation(unit:m)
Vehicles’speed and volume were measured from one section at the same time.The observed segment’s density and passing eventswere derived from both sections.Passing events were counted every m inute according to two types,e-bicycle-passing-e-bicycle(Type 1)and e-bicycle-passing-bicycle(Type 2).Based on the methods above,30 intervals of each site were recorded,w ith each interval lasting for 60 s.
Through the field observation,we obtainedmuch experience about the investigation of traffic flows on bicycle facilities w ith two cameras:
1)The setting height of the camera is closely related to the performance of the camera.
2)In order to facilitate the video editing,the same starting point of two cameras should be set during the shooting.
3)For raw video,cutting and rearranging are necessary.
2 Results
The details of the survey sites are provided in Tab.1.Tab.2 illustrates the statistical results of the vehicle number.For Site 1,412 vehicles were recorded,30%of which were bicycles.At Site 2 and Site 3,there were 1 123 and 1 051 vehicles,w ith the bicycle proportion being 18%,19%respectively.
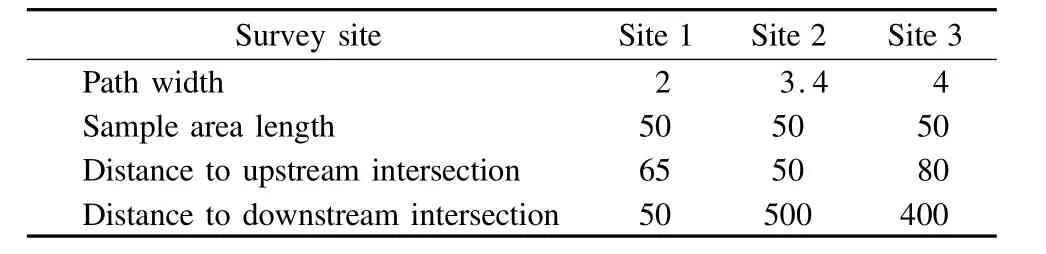
Tab.1 Survey site details m
From Tab.3,we can see that,with the rise of path width,the speed data shows obvious and regular changes.The overallmean velocities of vehicles at the three sites are3.88,6.27 and 7.10 m/s,grow ing noticeably w ith the w idening of the path.Sim ilar changes are seen in the speed of e-bicycles and bicycles.Meanwhile,the speed gaps between e-bicycles and bicycles vary from 0.81m/s at Site 1 to 2.28m/s at Site 3,whichmeans that the rise in the w idth contributesmore to the e-bicycles’velocity. The data of speed variance also increases gradually when the path w idth varies from 2 to 4 m.
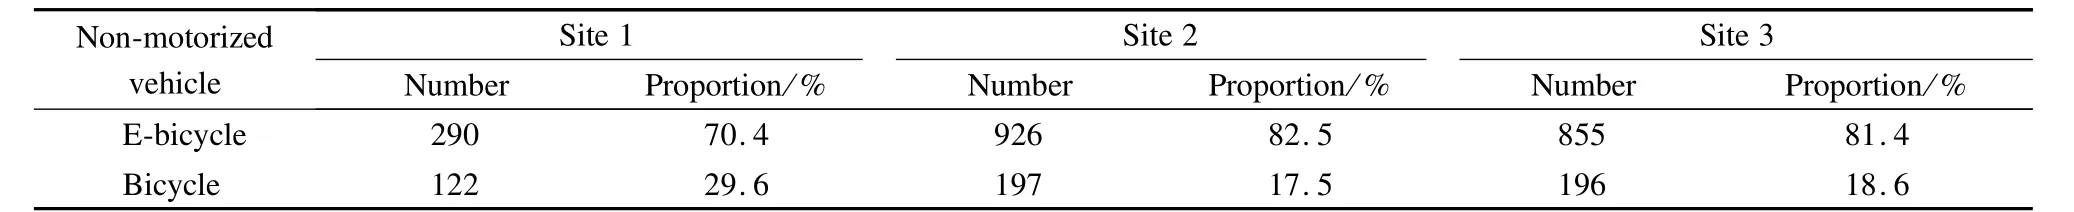
Tab.2 Bicycle number and proportion
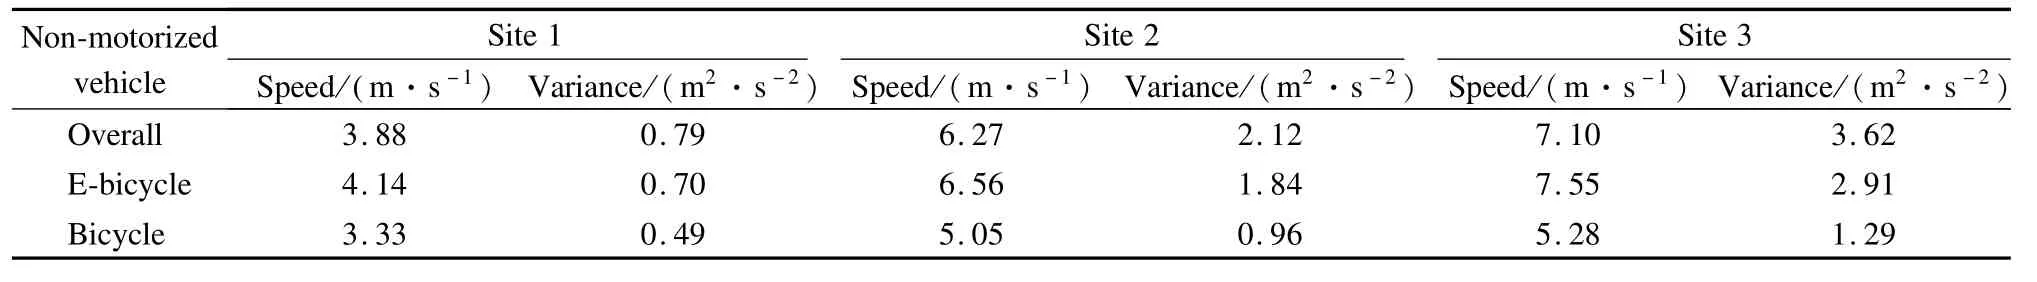
Tab.3 Velocity characteristics
As shown in Tab.4,the events of Type 1 account for themajority at Site1.In contrast,passing events of Type 2 have a larger proportion at Site 2 while the two types are basically equal at Site 3.
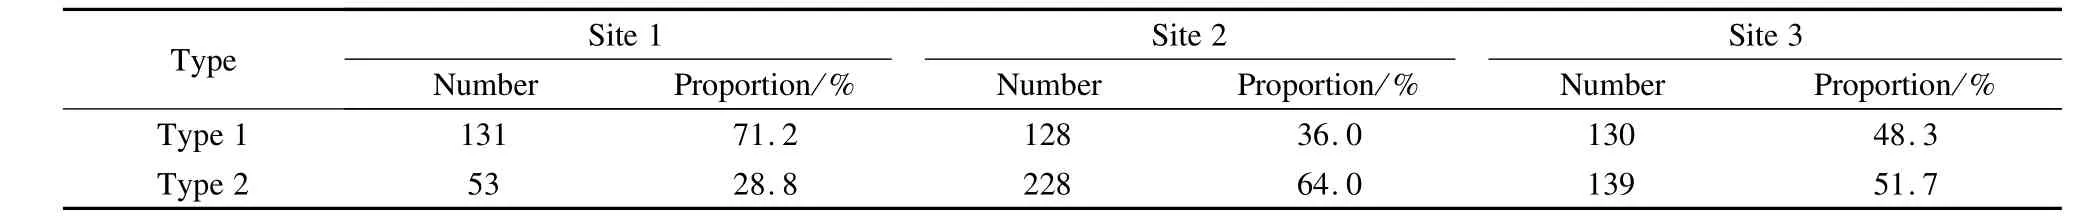
Tab.4 Passing events counting
As illustrated in Tab.5,the correlation analysis indicates that the volume and density at Site 1maintain amoderate relationship(>0.3).In contrast,these relationships at Site 2 and Site 3 are strong(>0.5).However,the velocity variances and bicycle ratios at the three sites show a weak relationship w ith the passing events(<0.3).

Tab.5 Correlation analysis results between the passing events and different parameters
Due to the strong correlation between the bicycle passing events and the volume(density),we applied four commonly used functions to fit the data.Tabs.6 to 8 show the data fitting results of the relationship between passing events and the volume(density)at the three survey sites.The Gaussian function performed best according to the results except for the passing events-densityfitting at Site 2.However,the goodness of fitting for the Gaussian function is close to that for the quadratic function at the site.To be consistent w ith other sites,we adopted the Gaussian function.Tab.9 outlines all the fitting formulae.
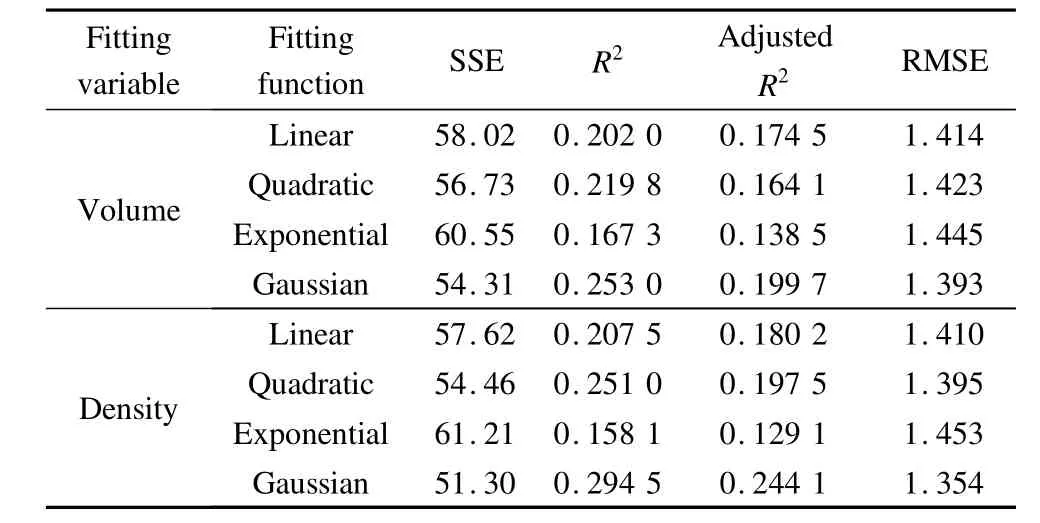
Tab.6 Data fitting results w ith different functions for Site 1
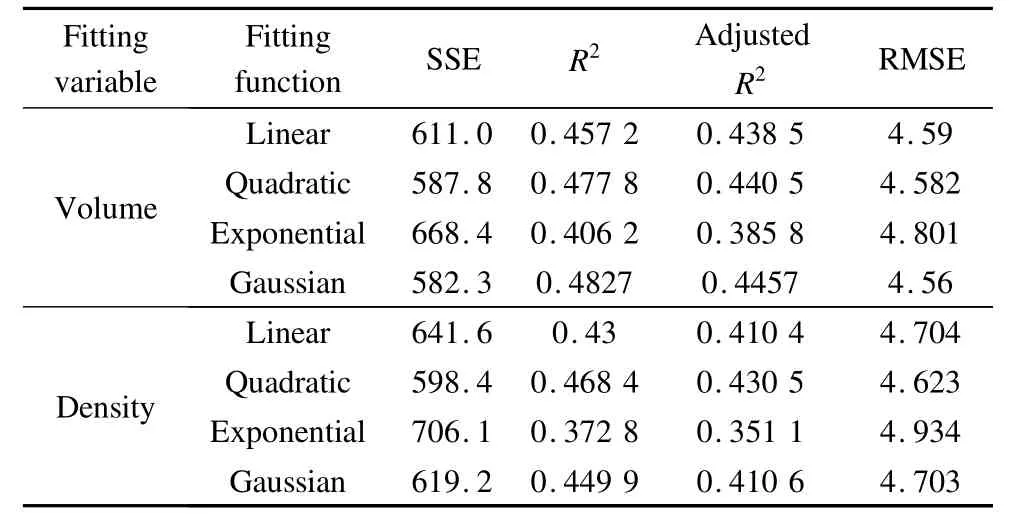
Tab.7 Data fitting results w ith different functions for Site 2
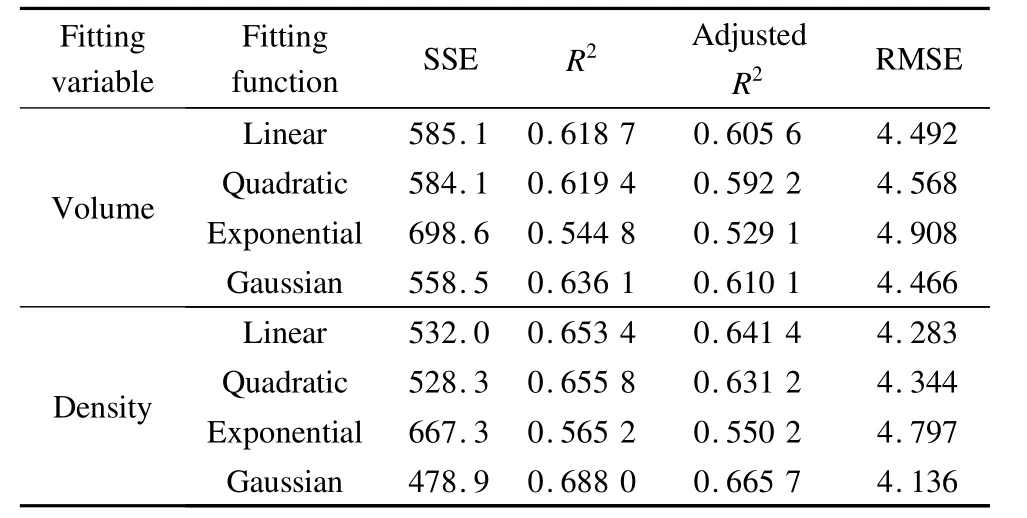
Tab.8 Data fitting results w ith different functions for Site 3
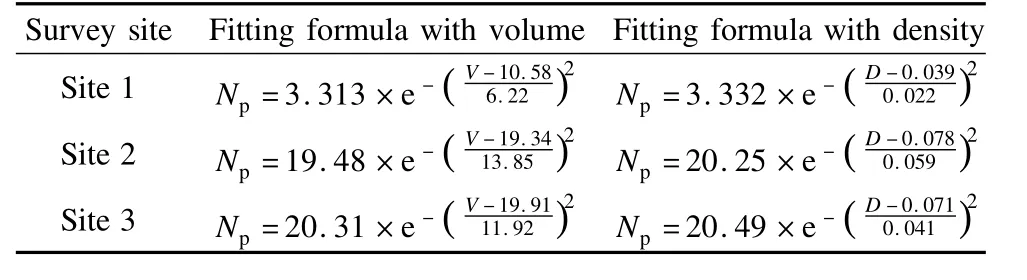
Tab.9 Data fitting results w ith Gaussian function
The curve fitting results for the three sites are similar.The diagrams of Site 1 are given to indicate the characteristics of the fitting results.Fig.2 gives the fitting curves for the Gaussian function and nonparametric fitting.As illustrated in Fig.2,the Gaussian curve shows a steady grow th with volume at firstand decreases after the point10bike/(m in·m).The curve for nonparametric fitting expresses a same trend although the curve fluctuates during the process.However,the volume value 10 is not the saturation point according to the volume-density diagram(see Fig.3).
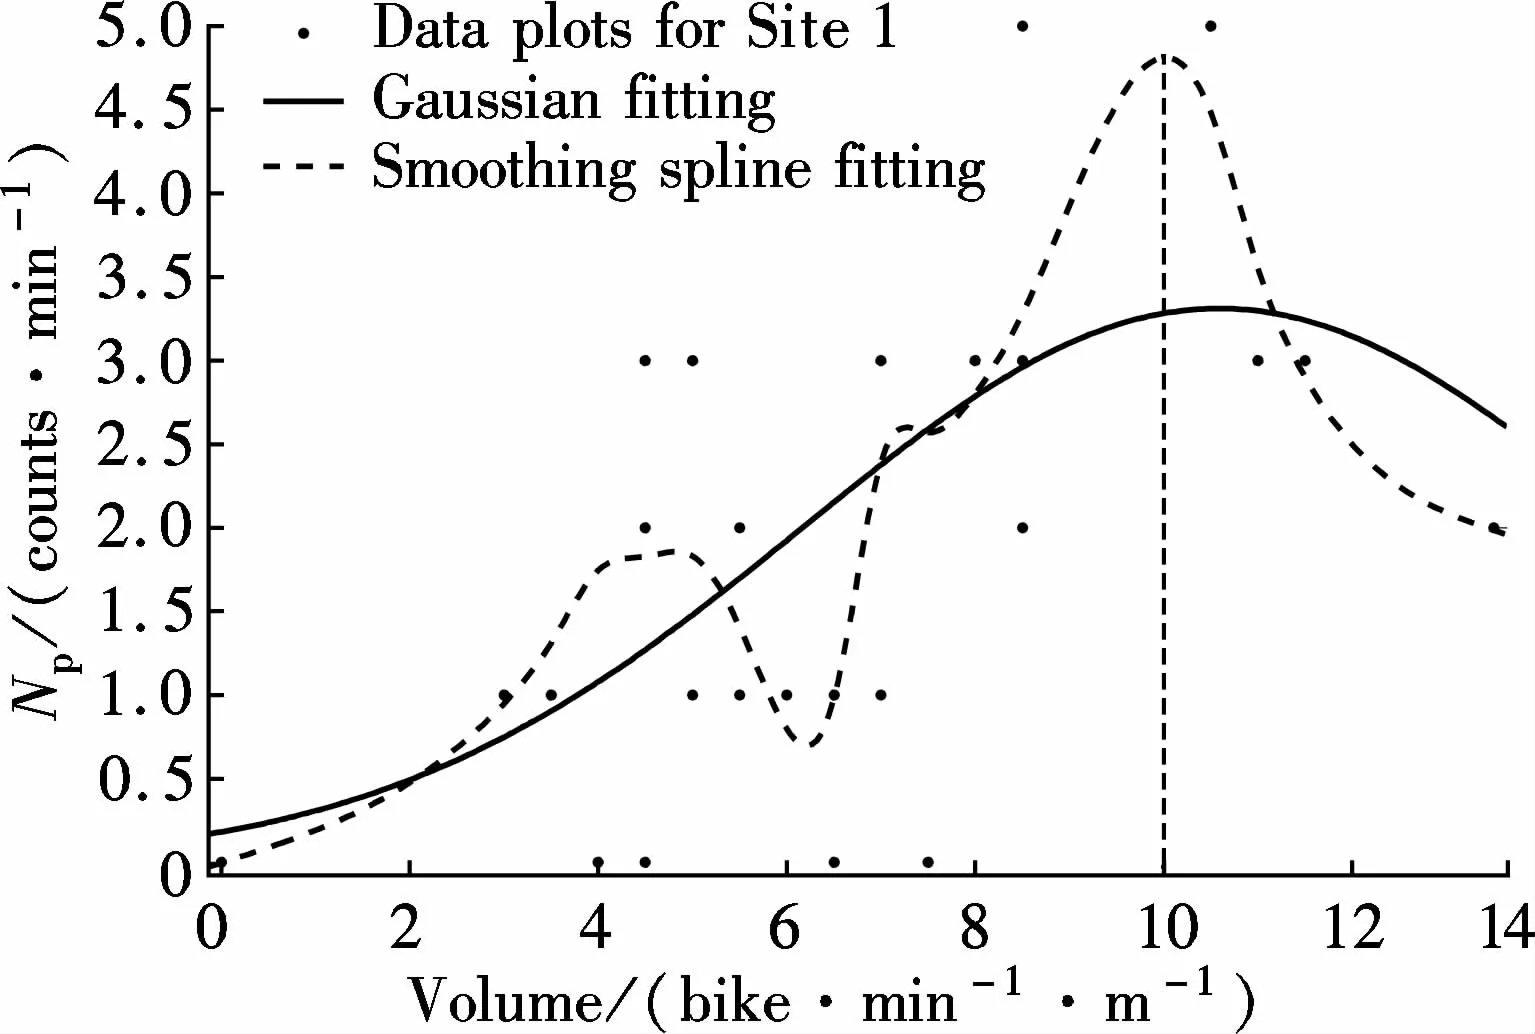
Fig.2 Relationship between passing events number Npand volume at Site 1
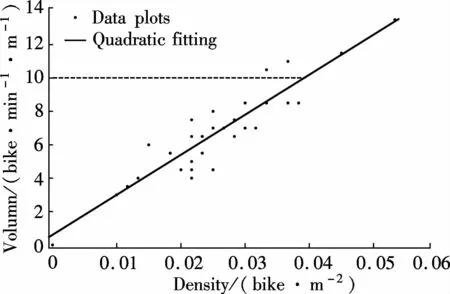
Fig.3 Relationship between volume and density at Site 1
3 Discussions
3.1 Influence of vehicles’speed difference on passing events
According to the description of results,the speed difference between two types of vehicles shows a steady grow th w ith the rise of path w idth.Normally,the w ider the speed gap thatexists between e-bicycles and bicycles,the greater the probability that passing events w ill occur.However,the passing event number expresses a weak correlation w ith velocity variance.The survey sites keep different distances to the intersection upstream.Due to the existence of intersection upstream,c-bicycles and ebicycles cannot arrive regularly.They always appear in groups like waves.When signal lights turn green,all the c-bicycles and e-bicycles start at the same time.Due to the stopping orders and speed difference of bicycles,the fast ones w ill overtake the slow.W ider speed gaps and shorter headwaysmake the overtaking process accomplish earlier.By contrast,when velocity difference is small,the overtaking process needs more time and longer distance.Therefore,velocity difference and headway determ ine the position in which the passing event occurs.Since headways of non-motorized vehicles usually stay stable at intersections,the speed gap becomes the key factor.If the gap is smaller,passing eventswill occur after the observed area.Therefore,we observe the least passing events at Site 1.On the contrast,larger gaps make the events finish before vehicles arrive at the observed area,which result in fewer samples.This explains why there are fewer passing events at Site 3 than those at Site 2.When the flow reaches the observed area,many passing events have completed or not yet although the speed variance is large.To remove the impactof the chosen location,we suggest selecting investigation sites which are located at the same distance to the intersections upstream.
3.2 Relationship between passing events and c-bicycle ratio
The curve fitting results in Tab.5 illustrate that passing events areweakly related w ith the c-bicycle ratio inm ixed flow,which is unexpected.According to our understanding before the observation,the c-bicycle ratio is considered as one of the important factors impacting passing between bicycles.By review ing the video,we found that the relative locations of bicycles in the m ixed flow influenced passing seriously,rather than the c-bicycle ratio or quantity.In some intervals,many passing events occurred when only one bicyclewas operating in front of the flow(see Fig.4(a)).However,fewer passing events were observed in some intervals although c-bicycles covered a large proportion.These bicycles ran after e-bicycles(see Fig.4(b)),which means that there was going to be no passing events due to the higher speed of e-bicycles.Thus,the distribution of the slow bicycles in an arriving flow affects passing events.
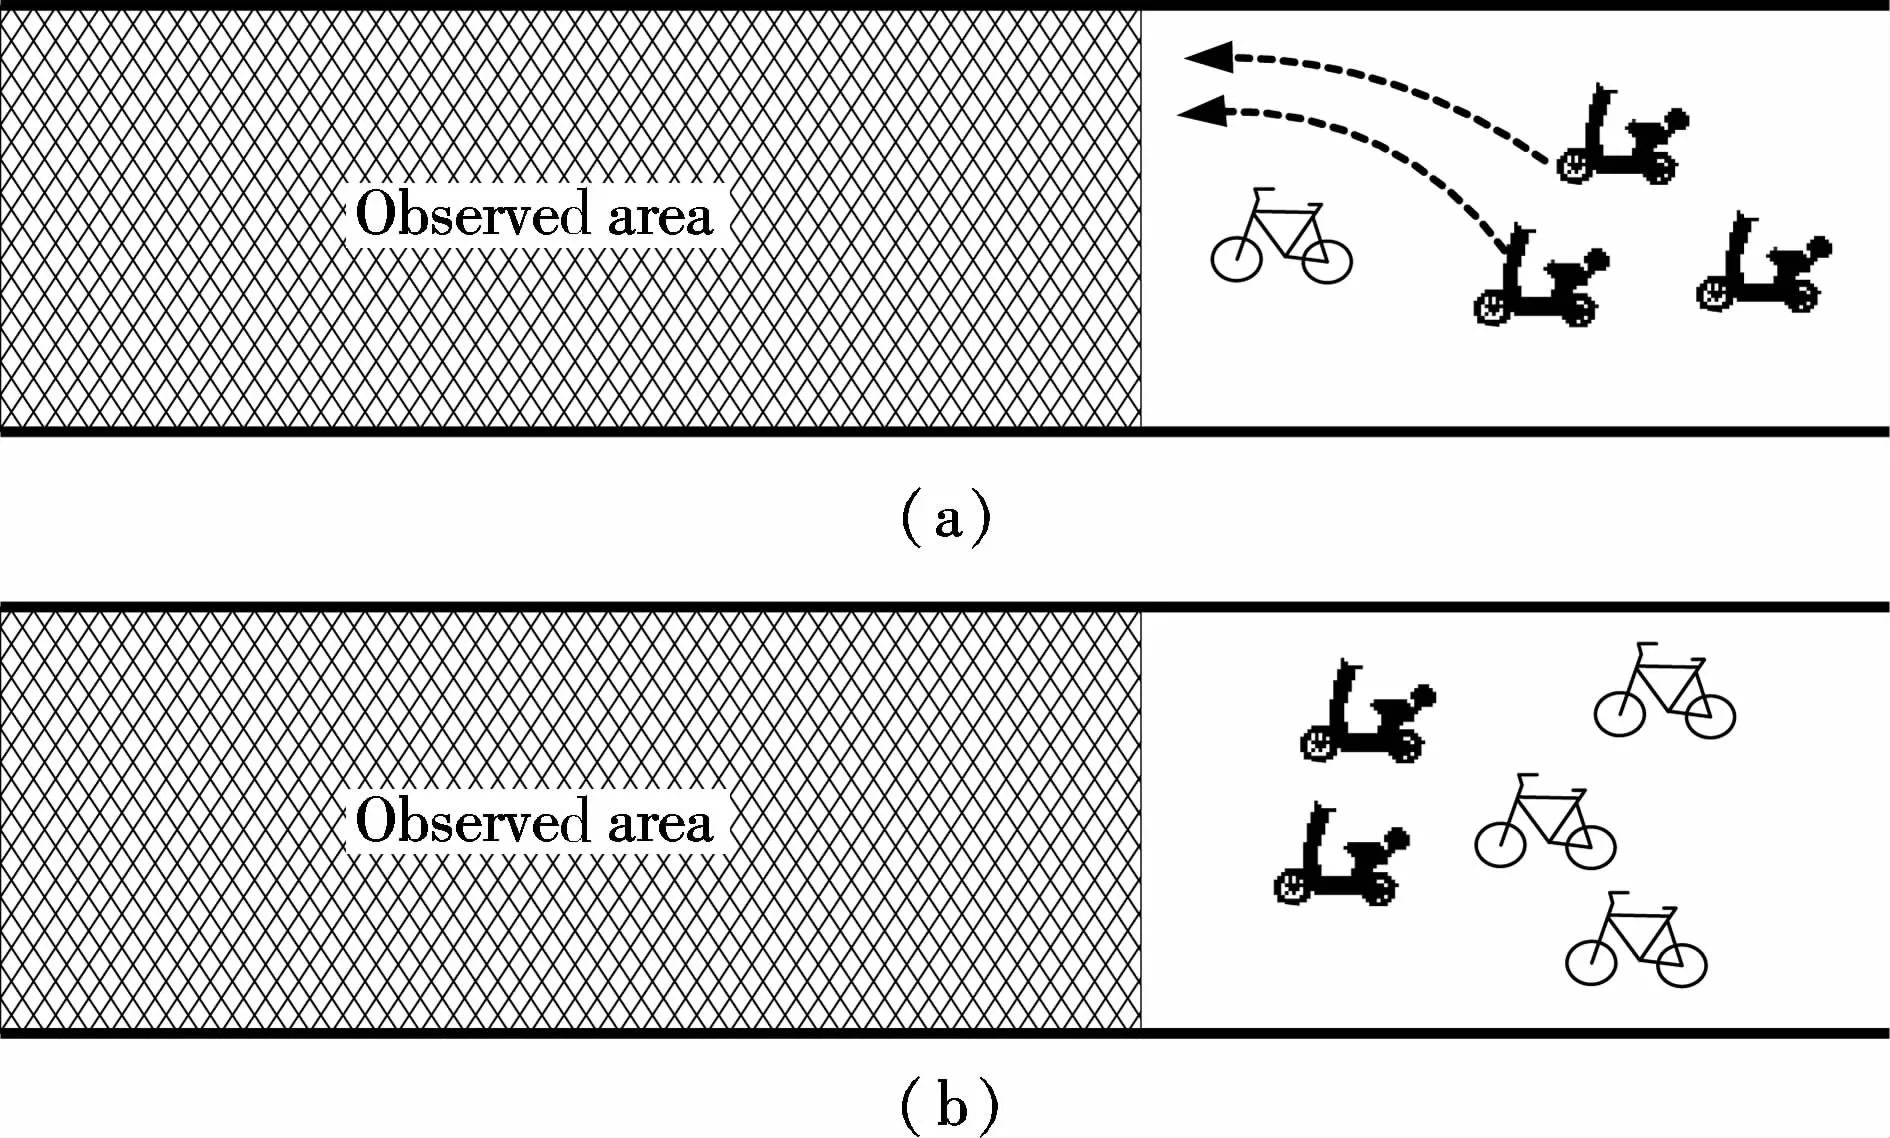
Fig.4 Different distribution cases of bicycles.(a)Bicycles in front of e-bicycles;(b)Bicycles behind e-bicycles
3.3 Relationship between passing event quantity and bicycle volume(density)
As Botma[1]reported,the bicycle passing eventmaintained a linear and positive relationship w ith bicycle volume.The conclusion is not consistent w ith our observation about the m ixed traffic flow consisting of e-bicycles and bicycles.The data fitting results imply that the Gaussian function describes the relationship of the two parameters better than others.The curves for Gaussian and nonparametric fitting both show an upward at first and then a downward trend.When the volume is low,fastbicycles have enough space to overtake slow ones.Thus,passing events express an upward trend at the beginning.As the volume increases,fast bicycles have no sufficient space to manage overtaking maneuvers.Then,the passing events decrease later.Moreover,the turning pointappears before the saturation condition.
Passing events have a similar relationship w ith bicycledensity(see Fig.5).The simulation results of Zhao et al.[10]also showed an upward trend at first and then a decreasing trend.According to the analysis of passing event-volume relationship,passing events reach the turning point before the saturation condition.Moreover,Fig.5 illustrates that the turning point appears at different densities.The inflexion of Site 1 appears first at 0.04 bike/m2.Site 3 goes after it at0.07 bike/m2.Site 2 is the latest(0.08 bike/m2).As reported in Ref.[12],the operating w idth(m inimum)of the design bicycle is 1.2 m.We can consider that the overtaking operation w ill notoccur when the lateral clearance is far below the value.Fig.6 describes the valid use of the path w idth.The bicycles make full use of the path w idth at Site 2.For comparison,the invalid w idth of path at Site 1 and Site 3 are 0.8 m and 0.4 m,respectively.This explains why the turning point of Site 1 first appears and Site 2 is the last.We can conclude that the valid use level of the path w idth determines the density value of the inflexion.This also suggests that the w idth of a new bicycle path should bemultiples of the operating width of a bicycle.
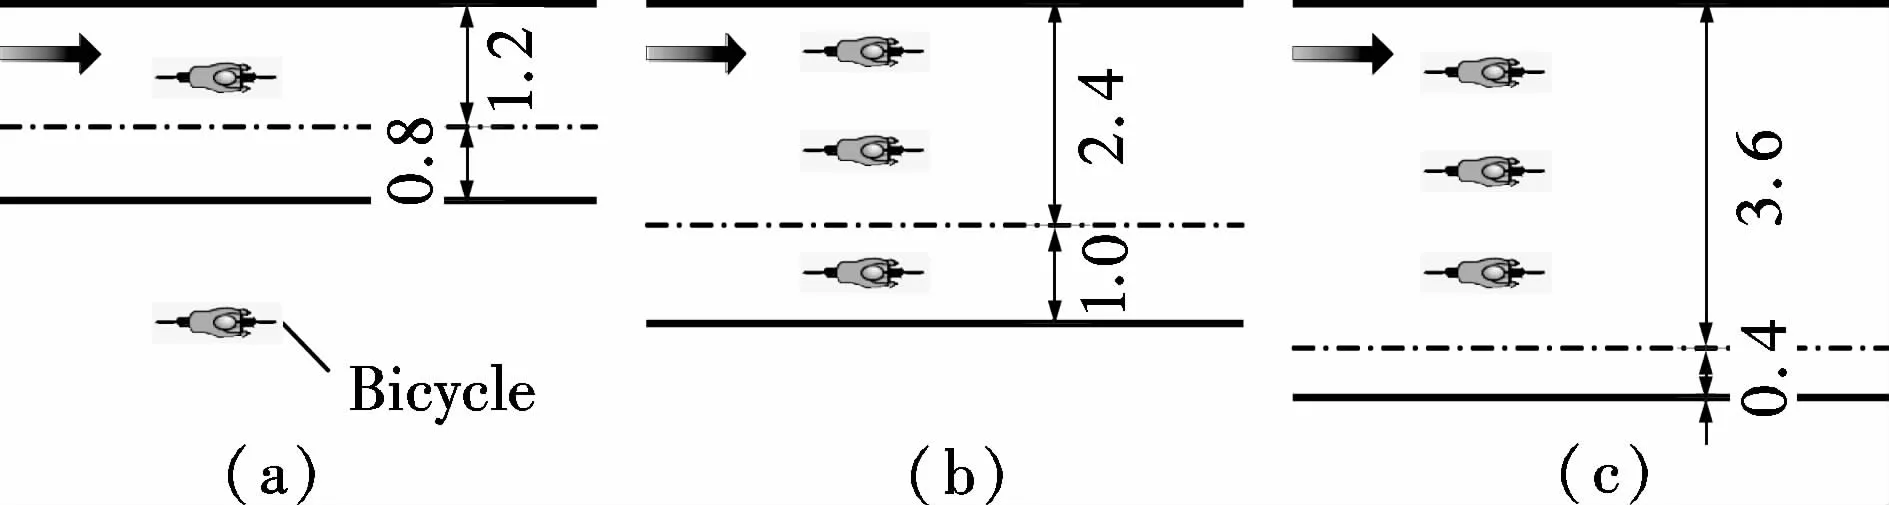
Fig.6 Descriptions for the valid path w idth(unit:m).(a)Site 1(2 m);(b)Site 2(3.4 m);(c)Site 3(4 m)
4 Conclusion
On these grounds,we can reasonably conclude the follow ing:The setting height of cameras is closely related to the performance of cameraswhen they are used to observe c-bicycle and e-bicycle flow.The larger velocity difference or variance cannot assuremore passing events in the bicycle path.The Gaussian function performs best in fitting the relationship between the passing events and volume(density).The valid use level of the path width influences the inflexion of the passing events-density fitting curve.
The findings of this study can serve as a reference for investigating c-bicycle and e-bicycle flow with cameras.The fitting equation of the relationship between passing events and traffic parameters can be applied to estimate the passing event quantity in m ixed bicycle traffic flows.Meanwhile,the equations are a good supplement to the calculation methods in HCM 2010.The conclusions here needmore data and cases to verify.Data should be collected under more traffic conditions and in other cities.The trail location wheremost passing events occur at a certain vehicle speed difference is a pointworth exploring.
[1]Botma H.Method to determine level of service for bicycle paths and pedestrian-bicycle paths[J].Transportation Research Record,1995,1502:38- 44.
[2]Transportation Research Board.Highway capacitymanual[R].4th ed.Washington DC:TRB,2000.
[3]Transportation Research Board.Highway capacitymanual[R].5th ed.Washington DC:TRB,2010.
[4]Allen D P,Rouphail N,Hummer JE,et al.Operational analysis of uninterrupted bicycle facilities[J].Transportation Research Record,1998,1636:29- 36.
[5]Khan S I,Raksuntorn W.Characteristics of passing and meeting maneuvers on exclusive bicycle paths[J].Transportation Research Record,2001,1776:220-228.
[6]Green JS,Hummer JE,Rouphail N M.Using the number of passing andmeeting events to design pedestrian and bicycle shared-use paths[C]//2nd Urban Street Symposium.Anaheim,CA,USA,2003:1- 15.
[7]Hummer JE,Rouphail N M,Toole J L,et al.Evaluation of safety,design,and operation of shared-use pathsfinal report[R].Washington DC:Department of Transportation,2006.
[8]Li Z B,WangW,Zhao D,etal.Modeling bicycle passing events on physically separated roadway[J].Journal of Southeast University:Natural Science Edition,2012,42(1):156- 161.(in Chinese)
[9]Zhao D,Wang W,Li Z B,etal.Psychological delaying model of bicycle passing events on physically separated bicycle roadways in China[J].Physics Procedia,2012,24:856- 863.
[10]Zhao D,WangW,Li Z B,etal.Modeling of passing events inm ixed bicycle traffic w ith cellular automata[J].Transportation Research Record,2013,2387:26- 34.
[11]Chen X H,Lin B,Fang X L,etal.Occurrence and impact of passing maneuvers in non-motorized traffic m ixed of bicycles and mopeds[C]//Transportation Research Board 93rd Annual Meeting.Washington DC,2014:38 -44.
[12]American Association of State Highway and Transportation Officials.Guide for the planning,design,and operation of bicycle facilities[R].Washington DC:AASHTO,2010.
混合非机动车交通流超车事件数和运行参数的关系
闫星臣1何 鹏1陈 峻1叶晓飞2刘擎超1
(1东南大学交通学院,南京210096)
(2宁波大学海运学院,宁波315211)
调查了电动车和自行车之间的超车事件,并探索已有非机动车设施内超车事件数和交通参数之间的关系.应用摄像机观测了3个南京机非隔离的非机动车道路段,并详细分析了包括流量、速度和超越事件特征在内的实际数据.通过数据分析和拟合发现:超车事件与速度差别以及自行车比例相关性较弱;高斯函数可以较好地描述超车事件数和流量(密度)之间的关系;非机动车道的利用水平影响到超车事件密度曲线的拐点位置.研究结论可应用于混合非机动车流中超车事件数的计算和机非隔离非机动车道的宽度设置.
混合非机动车流;超车事件;交通运行参数;相关性分析
U491.2
10.3969/j.issn.1003-7985.2015.03.021
2015-01-17.
Biographies:Yan Xingchen(1987—),male,graduate;Chen Jun(corresponding author),male,doctor,professor,chenjun@seu.edu.cn.
s:The National Natural Science Foundation of China(No.51238008,51408322).
:Yan Xingchen,He Peng,Chen Jun,et al.Relationship between number of passing events and operating parameters inm ixed bicycle traffic[J].Journal of Southeast University(English Edition),2015,31(3):418- 423.
10.3969/j.issn.1003-7985.2015.03.021
猜你喜欢
现代装饰(2022年5期)2022-10-13
中学生数理化·八年级物理人教版(2021年12期)2021-12-31
中学生数理化·八年级物理人教版(2021年12期)2021-12-31
童话世界(2020年32期)2020-12-25
数学小灵通(1-2年级)(2020年4期)2020-06-24
中学生数理化·八年级物理人教版(2019年12期)2019-05-21
中学生数理化·八年级物理人教版(2019年12期)2019-05-21
小学生导刊(2018年16期)2018-07-02
中国卫生(2014年12期)2014-11-12
中学英语之友·上(2008年1期)2008-03-20
 Journal of Southeast University(English Edition)2015年3期
- Journal of Southeast University(English Edition)的其它文章
- CoMP-transm ission-based energy-efficient scheme selection algorithm for LTE-A system s
- Detection optim ization for resonance region radar w ith densemulti-carrier waveform
- Dimensional emotion recognition in whispered speech signal based on cognitive performance evaluation
- Cascaded projection of Gaussian m ixturemodel for emotion recognition in speech and ECG signals
- Action recognition using a hierarchy of feature groups
- Ergodic capacity analysis for device-to-device communication underlaying cellular networks