
Simulating the Three-Dimensional Image of Cold Atomic Cloud
2016-06-05 14:58PENGYu
光谱学与光谱分析 2016年12期
PENG Yu
1. School of Science,Beijing Forestry University,Beijing 100083,China 2. Center for Quantum Information,IIIS,Tsinghua University,Beijing 100084,China
Simulating the Three-Dimensional Image of Cold Atomic Cloud
PENG Yu1,2
1. School of Science,Beijing Forestry University,Beijing 100083,China 2. Center for Quantum Information,IIIS,Tsinghua University,Beijing 100084,China
We propose a scheme for accurately simulating of the three-dimensional image of cold atomic cloud,which is more intuitive and stereoscopic than former two-dimensional image by probe laser. We have realized simulating of cold atomic cloud. The number of trapped atoms is about 108. The atomic cloud is about the geometric three-dimensional shape. Tri-axial ellipsoid with distinct semi-axis lengthsRx=1.06 mm,Ry=1.06 mm,Rz=0.57 mm,and the three-dimensional image of cold atomic cloud was simulated for the first time.
Atom optics; Laser cooling; Lasers
Introduction
The concept of the magneto-optical trap (MOT) was first suggested by Jean Dalibard[1],when pioneers of the field such as Pritchard and Chu were still struggling with dipole trapping of neutral atoms[2-5]. The MOT was shown to be able to trap a much higher number of atoms (on the order of 107[3]),making it a preferred choice as a source of cold atoms. The MOT is a widely used technique,as the trap can produce ultracold atomic clouds with temperatures below 100 μK[6-7]. The two properties of the MOT cloud that we are most interested in are the number and the temperature and how they behave in different regimes.
To measure these properties,we need methods to measure the cloud size,the number of atoms,and the expansion of the cloud. For cloud Radius,the fluorescence image of the cloud is taken using a grayscale CCD camera. The value in each pixel is averaged over many images to reduce noise due to the fluctuation in number of atoms[6]. For number of Atoms,the absorption method uses another weak laser beam as a probe and is aligned to pass through the cloud and is collected on a photodiode. The number of atoms inside the trap is measured by looking at the optical signal coming from either the fluorescence from the trapped atoms or the absorption of a probe beam[7]. For the expansion of the cloud,the ensemble of trapped atoms can have average velocity components that differ from dimension to dimension due to each dimension of the trap having different cooling and trapping forces[7].
Here we propose a new method for determining three-dimensional image of cold atomic cloud for the first time. Compared to former two-dimensional image by probe laser[7],the three-dimensional image of cold atomic cloud is intuitive and stereoscopic.
In order to trap a large ensemble of atoms,the atoms need to be cooled and confined to a specific location. The six cooling /repump beams and two detection beams are delivered from the optical table to the mot chamber using 10 m long SM-PM fibers. At the output end of the fibers,the beams are collimated with beam expanders that produce the desired beam size and polarization. Fig.1 show the schematic of the MOT.

Fig.1 Schematic of magneto-optical trap
The bronze rings represent the magnetic field coils in an anti-Helmholtz configuration. The red ball in the middle represents the atomic cloud. The pink arrows are the laser beams arranged in counter-propagating pairs of mutually orthogonal polarization. The fluorescence of atomic cloud is collected by detector.
For a given MOT detuning,the atom number can be maximised by maximising the fluorescence (photodiode voltage). There are a number of parameters that can alter the atom number captured. Unfortunately most parameters are dependent on each other,which complicates the order of optimisation. The first step in optimisation is to determine the best Rb dispenser current. A compromise has to be made between obtaining high atom numbers and running the dispensers too hard,thus shortening their lifetime. Therefore running the dispensers at 3.7 A was chosen.
Attention is now turned to optimising the detuning of the MOT cooling light. The maximum fluorescence does not necessarily correspond to the maximum atom number. Small detunings,being close to resonance,cause the MOT to oscillate and hence account for the large error. The maximum stable fluorescence occurs at -2π×12.5 MHz. The maximum atom number is now achieved with a frequency detuning of -2π×17 MHz.
To estimate three-dimensional image of the trapped rubidium atoms in MOT,three shutters are arranged at three directions of counterpropagating to control the cooling and trapping light,shown in Fig.1[8]. And the light pulse is generated by controlling the on and off of shutters with the help of a time sequence controller.
When the external trigger pulse from the time sequence controller has arrived,the shutter will work. The fluorescent signal of in-trap atoms cloud can easily be taken by the detector,and then show on oscilloscope. In order to take three-dimensional image of the trapped atoms,we control three directions of counterpropagating by shutters separately.
Atoms that passed through the center laser overlapping region would be then captured into the MOT. Assuming there are no collisions between trapped atoms,the change in number of atoms with time is
N(t)=N0(1-exp{-t/τ})
(1)
whereτis the lifetime of the trap is found by collecting the fluorescence signal during the loading,andN0is the steady state number of atoms. Therefore the fluorescent signal intensity
I(t)=Ib+I(1-exp{-t/τ})
(2)
I(0)=Ibis the background signal.I(τ) is the fluorescence signal during the loading. A detuning of -2π×12.5 MHz produces an image of a large and stable cold atom cloud on the CCD camera. The repumping light detuning has a much higher tolerance and an atomic cloud is observed over a 2π×100 MHz range. The detuning is set by optimising the fluorescence seen on the CCD camera.
本文从简化代表库、SLAF-seq技术以及基于限制性酶切的简化基因组测序3方面介绍了简化基因组测序技术的研究进展,为快速检测出高密度的SNPs位点,建立高密度遗传图谱和分子标记开发提供参考.
This equation 2 describes the dynamic of a MOT with a loading of atoms into MOT. We control three directions of counterpropagating by shutters separately to research the loading process of cold atomic atoms in 3 directions.
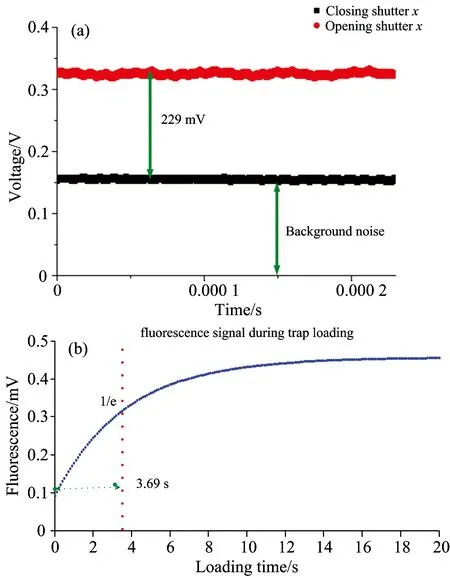
Fig.2 MOT photodiode voltage (fluorescence) during trap loading by shuttering the trapping light ofX
(a):Fluorescence signal collected by oscilloscope; (b):Loading procedure. A 3.69 s loading 1/e time was used.
Firstly we close the shutterxand then open the shutterx(other two shutters are open in the procedure). The fluorescent signal is shown in Fig.2(a). The black signal is background noise when closing the shutterx,and the red signal is the fluorescence of atoms with three shutters opening. Loading procedure is shown in Fig.2(b). The loading time is extracted 3.69 s. The atom number saturates for a loading time greater than 14 seconds. 108cold atoms can be collected by the MOT. The exponential decay has a 1/e lifetime of 3.69 seconds. The fluorescence signal change during the loading is 229 mV.
Figure 2 plots photodiode voltage against. The optimum fluorescence is achieved when a current of 5 A in the anti-Helmholtz configuration coils on the MOT is used,which corresponds to a magnetic field gradient of 5.2 G·cm-1.
Secondly we close the shutteryand then open the shuttery(other two shutters are open in the procedure). The fluorescent signal is shown in Fig.3(a). The black signal is background noise when closing the shuttery,and the red signal is the fluorescence of atoms with three shutters opening. Loading procedure is shown in Fig.3(b). The loading time is extracted 3.76 s. The fluorescence signal change during the loading is 230 mV.
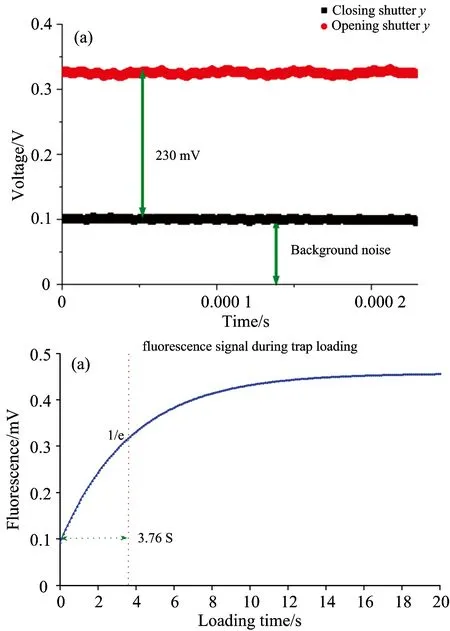
Fig.3 MOT photodiode voltage (fluorescence) during trap loading by shuttering the trapping light ofY
(a):Fluorescence signal collected by oscilloscope; (b):Loading procedure. A 3.76 s loading 1/e time was used.
We take two-dimensional image of the trapped atoms by former common method by probe laser as comparison. The cloud radius is measured using the area fit method,and cloud radius inxdimension (horizontal in real setup) andydimension (gravity in real setup). The cloud radius inxdimension andydimension is shown in Fig.4. The data collection is controlled by a program written in LabVIEW which also controls the camera operation mode and exposure,and then handled in MATLAB by the area fit method.

Fig.4 Image of in-trap atoms cloud
The bright spot indicates the true cloud (1/eradius 0.99 mm×1.03 mm)
By analysis of the loading time by shutteringxbeam andybeam,we found there are almost equal,shown in Fig.2 and Fig.3. Therefore we infer that the loading time represent the corresponding size of atomic cloud. In order to verify our conclusion,we measure the size of atomic cloud with former method with probe laser. We found the image of dimensionxand dimension y measured by former method are almost equal,shown in Fig.4. This result is the same as our new method. Therefore we conclude that the loading time ratio of dimensionxtoyis equal to the size ratio in dimensionxtoy. So we can get the image of atoms cloud by measuring the loading time.
Thirdly we close the shutterzand then open the shutterz(other two shutters are open in the procedure). The fluorescent signal is shown in Fig.5(a). The black signal is background noise when closing the shutterz,and the red signal is the fluorescence of atoms with three shutters opening. Loading procedure is shown in Fig.5(b). The loading time is extracted 2.04 s. The fluorescence signal change during the loading is 173 mV.
By analysis of the loading time by shutteringxbeam,ybeam andzbeam,shown in Fig.2,Fig.3 and Fig.5,we getτx∶τy∶τz=1∶1∶0.54. ThereforeRx∶Ry∶Rz=1∶1∶0.54 is concluded. This atomic cloud is about the geometric three-dimensional shape. Tri-axial ellipsoid with distinct semi-axis lengthsRx,Ry,andRz. An ellipsoid is a closed quadric surface that is a three-dimensional analogue of an ellipse. The standard equation of an ellipsoid centered at the origin of a Cartesian coordinate system and aligned with the axes is
(3)
The points (Rx,0,0),(0,Ry,0) and (0,0,Rz) lie on the surface and the line segments from the origin to these points are called the semi-principal axes of lengthRx,Ry,andRz.

Fig.5 MOT photodiode voluage (fluorescence) during trap loading by shuttering the trapping light ofZ
(a):Fluorescence signal collected by oscilloscope; (b):Loading procedure. A 2.04 s loading 1/etime was used.
They correspond to the semi*major axis and semi-minor axis of the appropriate ellipses. Here,Rx,Ry,Rzare the radius of the atoms cloud along thex,y,zaxes. Finally semi-axis lengthsRx=1.06 mm,Ry=1.06 mm,Rz=0.57 mmwere got,and the three-dimensional image of cold atomic cloud was simulated,shown in Fig.6.
Conclusion
In this paper,we have realized simulating of the three-dimensional image of cold atomic cloud. Compared to former two-dimensional image by probe laser,the three-dimensional image of cold atomic cloud is intuitive and stereoscopic. The number of trapped atoms is about 108. The atomic cloud is about the geometric three-dimensional shape. Tri-axial ellipsoid with distinct semi-axis lengthsRx=1.06 mm,Ry=1.06 mm,Rz=0.57.
[1] Steven Chu、Nobel Lecture. Rev. Mod. Phys.,1998、70: 685.
[2] Chu S,Hollberg L,Bjorkholm J E,et al. Phys. Rev. Lett.、1985、55(1):48.
[3] Raab E L,Prentiss M,Cable A,et al. Phys. Rev. Lett.,1987,59: 2631.
[4] Cohen-Tannoudji C N. Manipulating Atoms with Photons. Nobel Prize Lecture. 8th December、1997.
[5] Phillips W D. Rev. of Mod. Phys.,1998,70: 721.
[6] Andrejs Vorozcovs,Matthew Weel,Scott Beattie,et al. J. Opt. Soc. Am. B,2005,22(5): 943.
[7] Colin Cameron A,Frank A G Windmeijer. Journal of Econometrics,1997,77(2): 329.
[8] Steck D A. Rubidium 87 D Line Data. Los Alamos National Laboratory,2001.
O562.3
A
冷原子的三维图像模拟
彭 瑜1,2
1. 北京林业大学理学院,北京 100083 2. 清华大学量子信息中心,北京 100084
提出了一种用于精确模拟冷原子云的三维图像方案、这个方案比先前通过探测激光的方法所获得的二维图像更加直观和立体。该研究实现了冷原子云的模拟、捕获原子的数量约为108。原子云是几何三维形状、Rx=1.06 mm,Ry=1.06 mm,Rz=0.57 mm,具有不同半轴长度的三轴椭圆体。
原子光学; 激光冷却、激光
2016-03-15、
2016-07-22)
2016-03-15; accepted:2016-07-22
National Natural Science Foundation of China (11504022),Fundamental Research Funds for the Central Universities (BLX2015-09),and National Natural Science Foundation of China(31530084)
10.3964/j.issn.1000-0593(2016)12-4130-05
Biography:PENG Yu,(1980—),Ph. D.,in Beijing Forestry University e-mail: pengyu@bjfu.edu.cn
猜你喜欢
北京林业大学学报(社会科学版)(2022年4期)2023-01-04
北京林业大学学报(社会科学版)(2022年4期)2023-01-04
橡塑技术与装备(2022年6期)2022-06-02
资源信息与工程(2021年5期)2022-01-15
——对2018年广州市一道中考题的研究
中学数学研究(广东)(2021年6期)2021-04-20
四川地质学报(2020年2期)2020-05-31
校园英语·下旬(2019年7期)2019-10-07
校园英语·上旬(2018年7期)2018-09-08
军民两用技术与产品(2017年13期)2017-12-18
中国房地产业(2016年8期)2016-03-01
- 光谱学与光谱分析的其它文章
- 利用显微红外光谱技术表征非均质油气储层裂缝特征
——以任丘潜山蓟县系雾迷山组碳酸盐岩储层为例 - 高光谱成像技术无损检测赣南脐橙表面农药残留研究
- 基于便携式近红外光谱仪的重金属离子定量分析研究
- 提取葡萄糖多晶光学参数的迭代和遗传算法比较分析
- Studies on the Interaction of Perfluorononanoic Acid with Human Serum Albumin by Multi-Spectroscopic,Molecular Docking and Isothermal Titration Calorimetry Techniques
- 《光谱学与光谱分析》2017年征订启事