
A joint computational-experimental study of intracranial aneurysms: Importance of the aspect ratio*
2016-10-18 05:36SimonSuiManLAIAbrahamYikSauTANGAndersonChunOnTSANGGilbertoKaKitLEUNGAlfredCheukHangYUKwokWingCHOW
水动力学研究与进展 B辑 2016年3期
Simon Sui-Man LAI, Abraham Yik-Sau TANG, Anderson Chun-On TSANG, Gilberto Ka-Kit LEUNG,Alfred Cheuk-Hang YU, Kwok Wing CHOW
1. Department of Electrical and Electronic Engineering, University of Hong Kong, Hong Kong, China,
E-mail: simonlai@hotmail.com.hk
2. Department of Mechanical Engineering, University of Hong Kong, Hong Kong, China
3. Department of Surgery, Li Ka Shing Faculty of Medicine, University of Hong Kong, Hong Kong, China
4. Department of Electrical and Computer Engineering, University of Waterloo, Ontario, Canada
A joint computational-experimental study of intracranial aneurysms: Importance of the aspect ratio*
Simon Sui-Man LAI1, Abraham Yik-Sau TANG2, Anderson Chun-On TSANG3, Gilberto Ka-Kit LEUNG3,Alfred Cheuk-Hang YU4, Kwok Wing CHOW2
1. Department of Electrical and Electronic Engineering, University of Hong Kong, Hong Kong, China,
E-mail: simonlai@hotmail.com.hk
2. Department of Mechanical Engineering, University of Hong Kong, Hong Kong, China
3. Department of Surgery, Li Ka Shing Faculty of Medicine, University of Hong Kong, Hong Kong, China
4. Department of Electrical and Computer Engineering, University of Waterloo, Ontario, Canada
Rupture of a cerebral aneurysm (abnormal swelling of blood vessel in the brain) will cause subarachnoid hemorrhage, and will result in an alarming rate of mortality and morbidity. A joint computational-experimental study is conducted to assess the importance of the aspect ratio in the dynamics of blood flow. The aspect ratio is defined here to be the ratio of the height of the aneurysm to the linear dimension of the neck. Idealized models of such aneurysms located near a bifurcation point were investigated. Numerical simulations for hemodynamic properties like shear stress and flow rate were performed. The computational results were verified experimentally with specially fabricated phantoms, blood mimicking fluid and Doppler ultrasound imaging. Excellent agreements were obtained. Two features are highlighted, providing information in the intensely debated link between rupture risk and geometric factors. On increasing the aspect ratios, firstly, a jet impinging on the distal part of the neck can be observed, and secondly,a region of positive shear stress gradient can be found there. Furthermore, computational analyses for four patient-specific models were conducted to correlate with the results of idealized models and to provide further clinical insight.
intracranial aneurysms, aspect ratio, Doppler ultrasound
Introduction
The applications of computational and experimental techniques of fluid mechanics to study the human cardiovascular system have received intensive attention recently[1]. Arterial aneurysms are abnormal dilatations of blood vessels. Mechanisms for their generation and development are still not fully understood[2],but vascular biology and hemodynamics are believed to play crucial roles. Besides large blood vessels like the abdominal aorta and the thoracic aorta, such aneurysms also occur frequently in smaller vessels, e.g. intracranial (or cerebral) aneurysms in the circulation system in the brain[3].
With increasingly sophisticated imaging techniques, more such cerebral aneurysms are detected before catastrophic events occur. These abnormal swellings may occur in as much as a few percent of the total population[4]. The main risk of cerebral aneurysms is the phenomenon of rupture, which leads to subarachnoid hemorrhage. The rate of mortality is alarming, and any necessary subsequent medical procedure for surviving patients poses a heavy financial burden for the society. The traditional treatment for unruptured aneurysms is open surgery, but recently endovascular methods have proven to be effective and less traumatic[5]. However, the risk of rupture needs to be balanced against the risk of treatment.
Scientifically, the hemodynamics and properties of the vortices and impingement zone associated with these aneurysms have been investigated[6]. Among all these geometric and dynamic factors, e.g., size and location of the aneurysms, pressure, flow rate and shear stress, we focus on the aspect ratio. The aspect ratio (AR) is commonly defined to be the ratio of theaneurysm depth to the dimension of the neck, and has been demonstrated clinically to be a statistically significant quantity in terms of assessing the risk of rupture[7-9]. Indeed for irregular shaped aneurysms, a volume to ostium area ratio has also been proposed[10]. The main idea behind these proposals is that slower flow in high AR sacs might lead to various processes in vascular biology, which will weaken the aneurysm wall[11]. This conjecture is difficult to prove explicitly with the present state of scientific knowledge. Hence,in clinical experiments, elastase induced aneurysms in rabbit had been investigated[11].
The main goal of this work is to conduct a joint computational-experimental study on intracranial aneurysms. Such swellings usually occur along the sidewall of a parent vessel (fusiform aneurysms) or near a bifurcation point (saccular aneurysms).
Computational investigations on bifurcation aneurysms have captured the attention of researchers. The effect of aneurysm geometry, the roles of low shear stress and high pressure in aneurysm rupture have been assessed. As the AR of the aneurysm increased, a reduction in the wall shear stress and an intensified wall pressure were observed, which could lead to a higher risk of rupture[12]. After the deployment of a high porosity stent, numerical simulations of an idealized model of a basilar tip aneurysm exhibited substantial reductions in the velocity field, pressure and shear stress[13]. Furthermore, computations under a non-Newtonian fluid assumption were performed on cerebral aneurysm models with the presence of daughter saccules[14]. Complex flow patterns were observed inside the aneurysms, which might imply a greater chance of rupture. These studies demonstrate the merit of computational fluid dynamics (CFD) in analyzing the highly complex flow patterns inside the aneurysmal sac.
On the other hand, phantom studies and enhanced imaging techniques to improve the understanding of the dynamics of intracranial aneurysms had also been carried out. Particle image velocimetry measurements of spherical aneurysm models were compared with computer simulations. Small variations in the geometric shape might produce significant changes in the hemodynamic parameters like vorticity and shear stress[15]. High frame rate angiography and computer fluid dynamics simulations had been assessed jointly,and these two approaches produced very good agreements[16].
The idea here is to employ still another measurement technique, namely, ultrasound imaging, to study models of cerebral aneurysms. Important merits of ultrasound technology include (1) the noninvasive nature, (2) affordability, and (3) no known harmful side effects. Indeed abdominal aortic aneurysms induced in mice had been measured by ultrasound with the additional advantages of rapid imaging speed, reproducibility, and high resolution[17]. In contrast, the usage of ultrasound imaging to blood flow issues in the brain has not been extensive. One direction is to assess if vasospasm in the middle cerebral artery will reduce the flow in the corresponding extracranial internal carotid artery[18]. Indeed this potential of contrastenhanced ultrasound imaging to visualize the flow dynamics in cerebral aneurysms during neurosurgical procedure is valuable[19], and would be examined in this work with the issue of varying the aspect ratio.
The plan of the paper can now be described. The CFD formulation, the fabrication of the phantom and experimental setup will be explained. The matching between CFD and experiments will then be discussed. Finally, conclusions will be drawn.
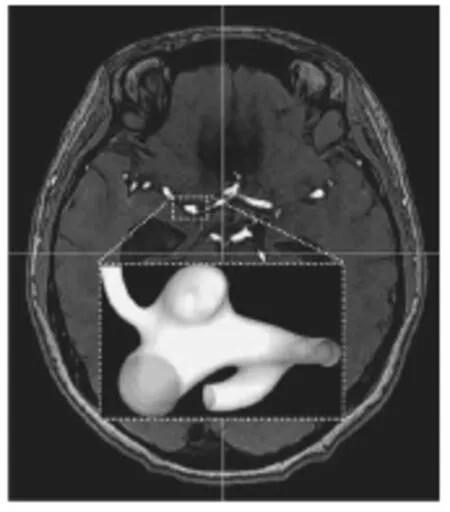
Fig.1(a) Aneurysm morphology of a real patient
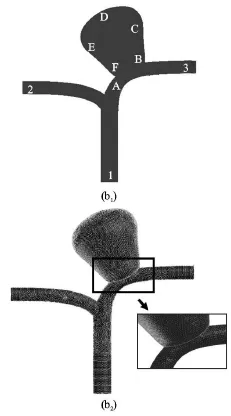
Fig.1(b) Schematic diagram of the generalized model utilized in this study, with the location of different points near and inside the aneurysm (b1) Computational mesh of the numerical model for
1. Materials and methods
1.1 Computational fluid dynamics simulations
1.1.1 Aneurysm models
Both idealized and patient specific models will be investigated. The computational process was started by building the models through specialized software and would be followed by solving the equations of fluid dynamics[20-22]. For the idealized case, a sequence of three-dimensional intracranial aneurysm models was created via the computer aided design (CAD)software SOLIDWORKS 2013 (Dassault Systèmes,Waltham, MA, USA). These idealized models were based on the computed tomography (CT) data of a patient with a cerebral aneurysm located near an arterial bifurcation (Fig.1(a)). The effect of the aspect ratio will be elucidated quantitatively by varying the linear dimensions over a range of realistic values typically found in patients (Fig.1(b)). The distance from the apex of the aneurysm to the neck was set to be equal to the maximum transverse dimension of the aneurysm. As such the AR becomes the sole geometric parameter,with a smaller neck width leading to a larger AR. Three sets of models were tested, namely,2.0 and 3.0, similar to the range of values studied earlier in the literature. The software Gambit 2.4.6(ANSYS, Canonsburg, Pennsylvania, USA) was used for generating high quality mesh. The numerical simulations were then performed by Fluent 6.3 (ANSYS,Canonsburg, Pennsylvania, USA).
1.1.2 Fluid mechanics
The blood plasma was assumed to be a Newtonian fluid of density 1 060 kg/m3and viscosity 0.0035 kg/(m∙s). The continuity and Navier-Stokes equations were solved by an unsteady solver in Fluent,with a time step of 0.001 s, and a residual error of 10-6. Tetrahedral elements with a size of 0.3 mm were employed. The computational mesh was shown in Fig.1(b). As an illustrative example, the mesh independence test for the case ofwas presented. Three sets of simulation with different number of elements were performed. The flow velocities at Point A were: 0.43 m/s (3×10⁵grids), 0.44 m/s (8×10⁵grids),0.44 m/s (1.4×10⁶grids). Consequently, the mesh with 8×10⁵grids was taken for further analysis.
1.1.3 Boundary conditions
A pulsatile velocity profile and a pressure waveform were prescribed at the inlet and outlets respectively (Fig.2). The wall was taken as rigid, and no slip boundary conditions were applied. The Reynolds number at the peak systole was 531, and thus the flow was assumed to be laminar.
In the actual numerical simulations, a cycle will refer to a complete period of a heartbeat pulse with systole and diastole. Typically two cycles of computations would generate a periodic output, and data for the third cycle would be reported in the subsequent discussion. Unless otherwise stated, the properties analyzed refer to those at the systole phase of the cardiac cycle.
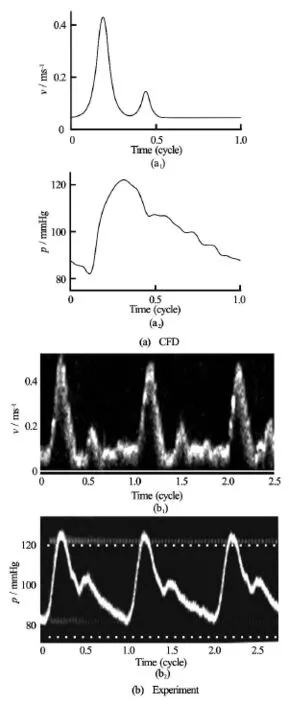
Fig.2 Boundary conditions for the velocity and pressure waveforms prescribed at the inlet and outlets of the CFD simulations (a) and the experimental models (b)
1.1.4 Patient-specific models
In addition to the idealized models, four patientspecific cases were also included to provide clinical insight. These aneurysms were located on the internal carotid artery. The information of the patients and the linear dimensions of the aneurysms were summarizedin Table 1. In general the aneurysms were located either at or in the vicinity of a bifurcation (for Patient I and Patients II, III and IV respectively). The ARs of these aneurysms ranged from 1.1 to 2.2. The threedimensional aneurysm models were reconstructed from the angiograms of the patients via the software Mimics (Materialise, Leuven, Belgium) for CFD study.

Table 1 Details of the patient information and the aneurysm geometries of the four patient-specific models. The AR ranges from 1.1 (Patient I) to 2.2 (Patient IV)
1.2 Experimental set-up and ultrasound flow measurements
1.2.1 Preparation of the phantoms
Aneurysm models were first created using CAD software SOLIDWORKS 2013, with wall thickness of 0.8 mm and female plugs added at the inlet and outlets. This CAD model was then printed on a stereolithography machine (Eden 350 V, Objet Geometries,Rahovot, Israel), which could fabricate three-dimensional models with 16 µm layer thickness resolution and 42 µm layer plane resolution. A special compliant photopolymer (FullCure 930, Objet Geometries) was used for stereolithography production. As a supporting cast, gel-like supporting photosensitive resin (FullCure 705, Objet Geometries) was deposited in the hollow regions of the model during fabrication. The actual choice of vessel wall thickness depends on many competing factors. Vessel walls being too thin will lack structural rigidity, while vessel walls being too thick will suffer from excessive ultrasound attenuation. An optimal range of wall thickness has been identified.
After the raw stereolithography builds were printed, the “phantoms” were then soaked in deionized water for two hours to rinse away the supporting cast surrounding the aneurysm. Subsequently, the supporting cast within the vasculature was carefully removed under water using a curette. These finished models were stored in distilled water at room temperature in closed containers. Such procedures would permit the fabricated models to be operational over time without significant change in mechanical properties. As quantified via tensile testing, the average elastic modulus of the wall was measured to be 391 kPa[23]. To compare with the computational results, phantoms with1.5, 2.0 and 3.0 were fabricated and tested(Fig.3).
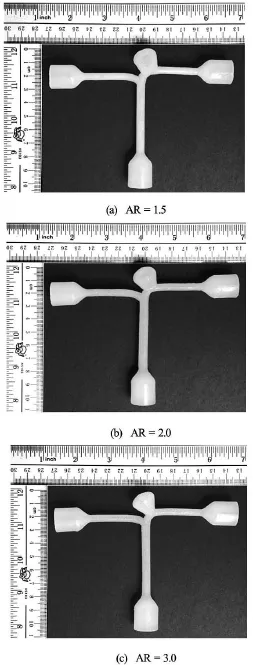
Fig.3 Phantom models of various ARs created by rapid prototyping machine
1.2.2 Flow systems
A computer controlled gear pump system(AccuFlow-Q, Shelley Medical Imaging, London, ON,Canada) was established to generate a pulsatile inflow at 72 cycles per minute, and a peak flow rate of 4.5 ml per second. A blood mimicking fluid (BMF) (Shelley Medical Imaging) with the following properties was utilized in this experiment[24]: (1) density is 1 037 kg/m3, (2) kinematic viscosity is 3.95×10⁻⁶m2/s,(3) acoustic speed is 1 548 m/s, (4) Newtonian fluid,(5) nylon scatter with blood-matching ultrasound scattering power. A physiological monitor with capability to record intraluminal pressure in real-time (HP Agilent CMS-2001/M1006B, Agilent Technologies,Böblingen, Germany) was deployed as a pressure sensing catheter at the outlets of the phantom.
The flow circuit consisted of the following components. It started with the gear pump, where the BMF entered the phantom through the inlet and exited at the outlets through the mounted phantom. The pressure sensor was linked to a variable flow restrictor to produce the effects of varying peripheral resistance downstream. Before the steady state was reached, air bubbles were allowed to rise and settle in the reservoir,and the baseline pressure could be adjusted by raising or lowering the reservoir level (Fig.4).
In preparation for the experiment, the three phantoms of different AR values were mounted on the same water tank to facilitate parallel study of their flow dynamics. Care was taken to avoid buckling the phantoms. Distilled water was filled to 2 cm atop the height of the phantoms.
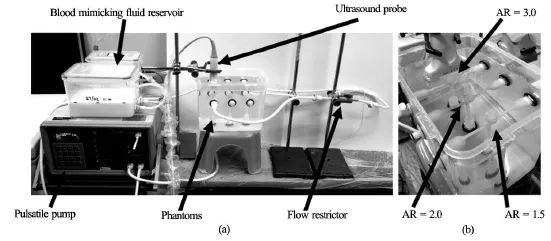
Fig.4 The experimental set-up showing all the major components (a), The phantom models with different aspect ratios being mounted in parallel for comparison (b)
1.2.3 Doppler ultrasound measurement: Quantitative flow investigation
An ultrasound scanner (SonixTouch, Ultrasonix,Richmond, BC, Canada) equipped with a linear array transducer (L14-5W, Ultrasonix) was used for flow measurements. The transducer was vertically positioned 0.015 m above the apical point of the phantom,and the imaging plane was aligned with the coronal(frontal) plane of the aneurysm. Pulsed Doppler measurements with an angle corrected flow velocity field were then taken at the inlet, the left and right outlets. The axial (relative to transducer, or vertical direction, defined as theaxis here) flow velocity was also recorded at selected points along the aneurysm, namely,sites “A”, “B”, “C”, “D”, “E” and “F” (Fig.1(b)).
For all the pulsed Doppler measurements, ultrasound beams of frequency 5 MHz and range gate of 2.0 mm were employed. For the fast flow sites, the pulse repetition frequency (PRF) was set to be 5 kHz with a wall filter cut-off of 100 Hz, and hence a flow velocity of up to 0.6 m/s was captured. Conversely,for the slow-flow sites, the PRF was chosen to be 1.3 kHz with a wall filter cut-off of 25 Hz, and thus a flow velocity of up to 0.15 m/s was recorded. For data reported in the next section, six consecutive pulse cycles were measured for each phantom and each measuring site.
1.2.4 Duplex color Doppler ultrasonography: Qualitative flow visualization
Using the same ultrasound scanner, duplex color Doppler ultrasonography was performed to acquire images of the flow patterns inside the aneurysm. The color box was set to cover the entire aneurysm and the three branches. The frequency parameter was kept at 5 MHz, while PRF and wall cut-off were set to 1.3 kHz and 6 Hz respectively. Doppler ensemble size would use ten samples, and no beam steering nor Doppler angle correction was performed, resulting in a velocity range of. Furthermore, in a color Doppler image, the red/blue color denoted the flow directions toward/away from the transducer along the vertical direction respectively.
1.2.5 Flow visualization by ultrasound imaging
At the inlet of the phantom, the input flow rate was set to have two peaks in the velocity field, namely,at 0.44 m/s at the systolic peak, followed by another maximum at 0.18 m/s. At the outlet the peak flow rates corresponding to a velocity of about 0.35 m/s for both the left and right outlet branches were implemented. The outlet pressure was calibrated to attain a physiologically realistic value of 120/80 mmHg. Theseprofiles were selected as they were used frequently in many studies of carotid arteries earlier in the literature[23].
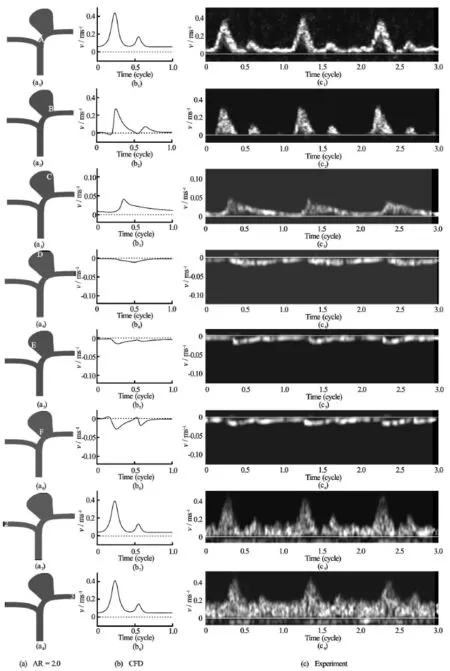
Fig.5 CFD results and ultrasound Doppler signals showing the velocity field at various locations near and inside the aneurysm for the case of, Sites “A” through “F” and points “2” and “3” are defined according to Fig.1(b)
For all the phantoms studied, aliasing occurred at the entry of the aneurysm due to the high velocity jet,and one single vortex was observed inside the aneurysm. Finally, the wall of the phantom was observed to display a slight movement due to the compliance of the elastic material, but these small amplitude vibrations did not substantially affect the agreement with CFD results presented in the next section. Shadowing effect below the aneurysm was also noted, due to the inherently high ultrasound signal attenuation of the compliant wall material[23].
2. Results and discussions
2.1 Fixed aspect ratio
The flow dynamics in the aneurismal sac was analyzed. Inside the aneurysm, at the inflow region(Sites “A”, “B”, “C”, Fig.1(b)), as blood moved up from the neck to the apex, the axial flow velocity was reduced, and the waveform broadened. At the outflow region (Sites “D”, “E”, “F”), as blood moved from the apex down to the neck, the axial flow speed increased and the waveform narrowed. The peak velocity at the outflow region was lower than that of the inflow region. However, the flow rate in and out of the aneurysm should have a net sum of zero, as the aneurysm was a blind sac, and this balance was maintained by the difference in areas of the influx and outgoing flows. This flow pattern indeed compared favorably with the computations and the experiments conducted earlier in the literature[25]. Without stenting, blood flow entered the aneurysm near the distal neck and created an anticlockwise vortex. The flow would then leave the aneurysm near the proximal region[25].
Basically, our CFD simulations and the experimental results showed extremely good agreements. As an illustrative example, the case ofwas highlighted. The velocity fields obtained computationally at the entrance of the aneurysm (site “A”), ascending portion of the stream (sites “B”, “C”), apex (site“D”), descending portion (sites “E”, “F”) were reported (Fig.5). The corresponding data of the velocity from experiments were displayed too (Fig.5). The shapes of the curves were almost identical. Furthermore, the maxima of the velocity field of the computational and experimental data agreed well, within just a few percent of each other.
2.2 Varying aspect ratio
The flow pattern near the neck region and inside the aneurysm was determined both computationally and experimentally as depicted in Fig.6. Fora significant portion of the fluid went into the aneurysm instead of flowing to the downstream vessel directly. For, however, strong flow impingement was observed near the neck. About half of the flow entered the aneurysm. In general, for higherAR, the area of the interface at the neck which exhibited velocity influx into the aneurysm would be smaller than that of the outflow region.
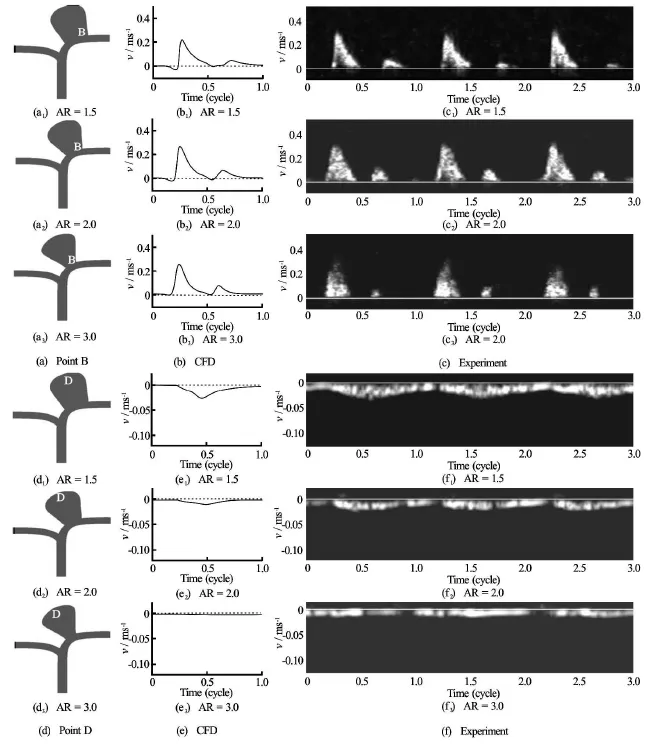
Fig.7 CFD results and ultrasound Doppler signals showing the velocity at Point “B” (a) and “Point” D (d) for different aspect ratios:1.5, 2.0 and 3.0
Another illuminating perspective was to examine the properties and extent of the jet impingement. The size of the jet impinging on the aneurysm and the location of impact were also obtained both by computations and experiments (Fig.6). Again excellent agreements were observed. In general, for lower aspect ratio, the jet was wider, and did not hit the wall directly as this fluid stream crossed into the aneurysmal sac and eventually reached the distal wall. However, for higher aspect ratio, the jet of fluid entering the aneurysm was narrower and impinged directly on the aneurysm wall.
These trends were further confirmed by both the computational and experimental velocity fields recorded at the point of impact (Point “B”) and the apex(Point “D”) of the aneurysm (Fig.7). With increasing ARs, the maximum fluid velocity was lower at the apex region, as the main blood stream encountered difficulties in entering the sac in view of the smaller size of the entrance.
2.3 Shear stress gradient
Given the promising agreements between these two approaches, it would be instructive to use CFD to assess the shear stress at the aneurysm, where experimental measurements might be most difficult. Earlier works in the literature[26,27]had suggested that an abnormally low shear stress or an extraordinarily steep shear stress gradient might damage the normal functions of the endothelial cells. We shall demonstrate that aneurysms with higher aspect ratios do give rise to sharper shear stress gradients, thus lending support to the clinical beliefs that the risk of rupture grows with an increasing AR.
The wall shear stress at the distal aneurysmal wall for different ARs was first calculated (Fig.8). The horizontal axis was the distance measured from the aneurysm neck. A local maximum was observed in the case ofand. This phenomenon was probably due to the flow impingement onto the aneurysmal wall, resulting in a high shear stress locally. The shear stress, however, just dropped gradually for the case of
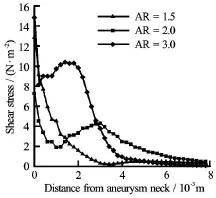
Fig.8 Shear stress at the distal aneurysmal wall for different ARs
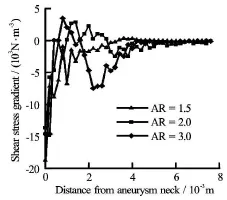
Fig.9 Shear stress gradients at the distal aneurysmal wall for different ARs
The shear stress gradient for various aspect ratios was then obtained by numerical differentiation (Fig.9). All three curves displayed a numerically large, but algebraically negative, slope near the wall. However, the curves forandchanged direction and exhibited a maximum, thus necessarily incurring regions of positive gradients[28]. Such sharp changes in gradients may have adverse consequences in terms of vascular biology of the endothelial cells,and will be pursued quantitatively in the future.
2.4 Patient-specific cases
To provide further clinical insight, several patient-specific models were tested computationally and compared with the idealized models. The flow pattern near the neck region and inside the aneurysm was portrayed in Fig.10. For patient I with lower1.1), the jet was wider, and entered the aneurysm without hitting onto the distal aneurysmal wall. However, as AR increases, a narrower fluid jet was observed. For patient IV with higher AR, the jet of fluid impinged directly on the distal aneurysm wall. This phenomenon compared favorably with the pattern observed in idealized models (Fig.6).
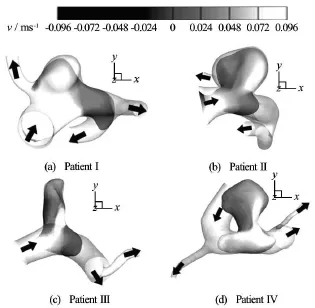
Fig.10 Computational velocity contour plots for the four patient-specific models with AR ranging from 1.1 (Patient I)to 2.2 (Patient IV)
3. Conclusions
The present paper conducts a joint computational-experimental study on the importance of the aspect ratio, defined here as the ratio of the aneurysm depth to the linear dimension of the neck. A higher aspect ratio has usually been associated with a greater risk of rupture statistically through clinical data[7-10]. However,the underlying flow dynamics is still not yet fully understood. Here the accuracy of computational simulations is verified by comparing with the flow measurements through phantoms fabricated from specialized materials with idealized geometries. Excellent agreements between the two approaches are obtained. Similar flow patterns are also observed in patient-specific models. This paper extends our previous works in twoaspects. Firstly, a more realistic boundary condition used frequently in the literature, where the velocity profile attains a nonzero value at the close of each cardiac cycle[29], is adopted here, and experimental verification is incorporated[30]. Secondly, our earlier work concentrated on such a joint computationalexperimental study for bifurcation and sidewall aneurysms with a fixed AR[31]. We have now extended the consideration to varying aspect ratios in this work.
With different aspect ratios, two significant changes are observed from these joint investigations. Firstly, jets of blood stream entering an aneurysmal sac of higher aspect ratio tend to be narrower, and may impinge on the weakened wall directly. Secondly, the shear stress at the distal portion of the neck exhibits sharp variations and regimes of positive gradient are found for aneurysms with larger aspect ratios, providing a platform for the potential damage of the endothelial cells[28].
In this study, the flow visualization in the phantoms is performed by ultrasonography. This is indeed a useful tool in medical engineering, and can be applied to study different blood vessel diseases, e.g. stenosis and ulcers[23]. The merits of ultrasound imaging include (1) noninvasive in nature, (2) relatively low cost,and (3) no known harmful side effects. Furthermore,particle injection into the fluid is not necessary. Consequently, this technique has great potential to be developed into an intraoperative tool in neurosurgical operations in the future.
There are various possible extensions for the present work. In terms of geometric configuration, the length of the parent artery upstream employed in the simulation might affect the flow dynamics and the wall tension[32]. A similar issue can be examined here. Real blood vessels in patients are elastic but there is no universal agreement in the literature regarding the effects of elasticity on the hydrodynamics, with some studies showing effects on the velocity field[33], while other works might indicate similar results for both rigid and elastic models[34]. Nevertheless in future studies on rupture risk, wall thickness and elasticity must be restored[35]. Post-treatment wall shear stress and displacement distribution were investigated by utilizing patient specific basilar tip model with fluidstructure interaction simulation[36]. A joint computational-experimental study using patient-specific configuration will be fruitful. The boundary conditions could also be varied to investigate the effect of the peripheral resistance of the downstream branches[22].
In conclusion, many clinical questions are still not fully understood and many challenges remain ahead[37-41]. Besides the aspect ratio, geometric factors like the orientation of the side branch relative to the aneurysm and the curvature of the parent vessel might be critical criteria. These issues should be addressed through such computational-experimental approaches in the near future.
Acknowledgements
Partial financial support has been provided by the Seed Funding Program for Basic Research of The University of Hong Kong, funding program from the Research Grants Council (Grant No. GRF 785113)and Innovation and Technology Support Program through contracts ITS/011/13 and ITS/150/15 of the Government of the Hong Kong Special Administrative Region.
References
[1] TAYLOR C. A., DRANEY M. T. Experimental and computational methods in cardiovascular fluid mechanics[J]. Annual Review of Fluid Mechanics, 2004, 36: 197-231.
[2] LASHERAS J. C. The biomechanics of arterial aneurysms[J]. Annual Review of Fluid Mechanics, 2007, 39: 293-319.
[3] HUMPHREY J. D., TAYLOR C. A. Intracranial and abdominal aortic aneurysms: Similarities, differences and need for a new class of computational models[J]. Annual Review of Biomedical Engineering, 2008, 10: 221-246.
[4] CEBRAL J. R., RASCHI M. Suggested connections between risk factors of intracranial aneurysms: A review[J]. Annals of Biomedical Engineering, 2013, 41(7): 1366-1383.
[5] D’URSO P. I., LANZINO G. and CLOFT H. J. et al. Flow diversion for intracranial aneurysms: A review[J]. Stroke,2011, 42(8): 2363-2368.
[6] SFORZA D. M., PUTMAN C. M. and CEBRAL J. R. Hemodynamics of cerebral aneurysms[J]. Annual Review of Fluid Mechanics, 2009, 41: 91-107.
[7] UJIIE H., TAMANO Y. and SASAKI K. et al. Is the aspect ratio a reliable index for predicting the rupture of a saccular aneurysm?[J]. Neurosurgery, 2001, 48(3): 495-503.
[8] WEIR B., AMIDEI C. and KONGABLE G. et al. The aspect ratio (dome/neck) of ruptured and unruptured aneurysms[J]. Journal of Neurosurgery, 2003, 99(3): 447-4 51.
[9] NADER-SEPAHI A., CASIMIRO M. and SEN J. et al. Is aspect ratio a reliable predictor of intracranial aneurysm rupture?[J]. Neurosurgery, 2004, 54(6): 1343-1348.
[10] YASUDA R., STROTHER C. M. and TAKI W. et al. Aneurysm volume-to-ostium area ratio: A parameter useful for discriminating the rupture status of intracranial aneurysms[J]. Neurosurgery, 2011, 68(2): 310-318.
[11] ZENG Z., DURKA M. J. and KALLMES D. F. et al. Can aspect ratio be used to categorize intra-aneurysmal hemodynamics? -A study of elastase induced aneurysms in rabbit[J]. Journal of Biomechanics, 2011, 44(16): 2809-2816.
[12] WANG Qing, WANG Wei-zhe and FEI Zhi-min et al. Simulation of blood flow in intracranial ICA-PComA aneurysm via computational fluid dynamics modeling[J]. Journal of Hydrodynamics, 2009, 21(5): 583-590.
[13] QIU Xiao-ning, FEI Zhi-min and ZHANG Jue et al. Influence of high-porosity mesh stent on hemodynamics of intracranial aneurysm: A computational study[J]. Journal of Hydrodynamics, 2013, 25(6): 848-855.
[14] WANG Sheng-zhang, CHEN Jia-liang and DING Guanghong. Non-newtonian computational hemodynamics in two patient-specific cerebral aneurysms with daughter saccules[J]. Journal of Hydrodynamics, 2010, 22(5): 639-646.
[15] HOI Y., WOODWARD S. H. and KIM M. et al. Validation of CFD simulations of cerebral aneurysms with implication of geometric variations[J]. ASME Journal of Biomechanical Engineering, 2006, 128(6): 844-851.
[16] JOU L. D., MAWAD M. E. Analysis of intra-aneurysmal flow for cerebral aneurysms with cerebral angiography[J]. American Journal of Neuroradiology, 2012, 33(9): 1679-1684.
[17] MARTIN-MCNULTY B., VINCELETTE J. and VERGONA R. et al. Noninvasive measurement of abdominal aortic aneurysms in intact mice by a high-frequency ultrasound imaging system[J]. Ultrasound in Medicine and Biology, 2005, 31(6): 745-749.
[18] SCHÖNING M., SCHEEL P. and WITTIBSCHLÄGER J. et al. The effect of vasospasm on cerebral perfusion: A color duplex study of the extra- and intracranial cerebral arteries[J]. Ultrasound in Medicine and Biology, 2012,38(3): 360-367.
[19] HÖLSCHER T., RODRIGUEZ-RODRIGUEZ J. and WILKENING W. G. et al. Intraoperative brain ultrasound: A new approach to study flow dynamics in intracranial aneurysms[J]. Ultrasound in Medicine and Biology,2006, 32(9): 1307-1313.
[20] LAM S. K., FUNG G. S. K. and CHENG S. W. K. et al. A computational study on the biomechanical factors related to stent-graft models in the thoracic aorta[J]. Medical and Biological Engineering and Computing, 2008, 46(11): 1129-1138.
[21] TANG A. Y. S., FAN Y. and CHENG S. W. K. et al. Biomechanical factors influencing type B thoracic aortic dissection: Computational fluid dynamics study[J]. Engineering Applications of Computational Fluid Mechanics, 2012, 6(4): 622-632.
[22] TANG A. Y. S., CHUNG W. C. and LIU E. T. Y. et al. Computational fluid dynamics study of bifurcation aneurysms treated with pipeline embolization device: Side branch diameter study[J]. Journal of Medical and Biological Engineering, 2015, 35(3): 293-304.
[23] LAI S. S. M., YIU B. Y. S. and POON A. K. K. et al. Design of anthropomorphic flow phantoms based on rapid prototyping of compliant vessel geometries[J]. Ultrasound in Medicine and Biology, 2013, 39(9): 1654-1664.
[24] RAMNARINE K. V., NASSIRI D. K. and HOSKINS P. R. et al. Validation of a new blood-mimicking fluid for use in Doppler flow test objects[J]. Ultrasound in Medicine and Biology, 1998, 24(3): 451-459.
[25] LIOU T. M., LI Y. C. Effects of stent porosity on hemodynamics in a sidewall aneurysm model[J]. Journal of Biomechanics, 2008, 41(6): 1174-1183.
[26] MALEK A. M., ALPER S. L. and IZUMO S. Hemodynamic shear stress and its role in atherosclerosis[J]. JAMA The Journal of the American Medical Association,1999, 282(21): 2035-2042.
[27] SHOJIMA M., OSHIMA M. and TAKAGI K. et al. Magnitude and role of wall shear stress on cerebral aneurysm: Computational fluid dynamic study of 20 middle cerebral artery aneurysms[J]. Stroke, 2004, 35(11): 2500-2505.
[28] DOLAN J. M., MENG H. and SINGH S. et al. High fluid shear stress and spatial shear stress gradients affect endothelial proliferation, survival and alignment[J]. Annals of Biomedical Engineering, 2011, 39(6): 1620-1631.
[29] KU D. N., GIDDENS D. P. and ZARINS C. K. et al. Pulsatile flow and atherosclerosis in the human carotid bifurcation-Positive correlation between plaque location and low and oscillating shear-stress[J]. Arteriosclerosis,1985, 5(3): 293-302.
[30] TANG A. Y. S., LAI S. K. and LEUNG K. M. et al. Influence of the aspect ratio on the endovascular treatment of intracranial aneurysms: A computational investigation[J]. Journal of Biomedical Science and Engineering,2012, 5(8): 422-431.
[31] TSANG A. C. O., LAI S. S. M. and CHUNG W. C. et al. Blood flow in intracranial aneurysms treated with pipeline embolization devices: Computational simulation and verification with Doppler ultrasonography on phantom models[J]. Ultrasonography, 2015, 34(2): 98-108.
[32] CHEN Jia-liang, DING Guang-hong and YANG Xin-jian et al. Effects of parent artery segmentation and aneurismal-wall elasticity on patient-specific hemodynamic simulations[J]. Journal of Hydrodynamics, 2011, 23(5): 660-668.
[33] ZHAO Jun-wei, YIN Wen-yi and DING Guang-hong et al. Numerical simulation and analysis on the hemodynamics of an elastic aneurysm[J]. Journal of Hydrodynamics,2008, 20(2): 216-224.
[34] BAZILEVS Y., HSU M. C. and ZHANG Y. et al. A fullycoupled fluid-structure interaction simulation of cerebral aneurysms[J]. Computational Mechanics, 2010, 46(1): 3-16.
[35] CEBRAL J. R., VAZQUEZ M. and SFORZA D. M. et al. Analysis of hemodynamics and wall mechanics at sites of cerebral aneurysm rupture[J]. Journal of NeuroInterventional Surgery, 2015, 7(7): 530-536.
[36] CHEN Jia-liang, WANG Sheng-zhang and DING Guanghong et al. Patient-specific blood dynamic simulations in assessing endovascular occlusion of intracranial aneurysms[J]. Journal of Hydrodynamics, 2009, 21(2): 271-276.
[37] HAN Xu, LIU Xiao-sheng and LIANG Fu-you. The influence of outflow boundary conditions on blood flow patterns in an AcoA aneurysm[J] Chinese Journal of Hydrodynamics, 2015, 30(6): 692-700(in Chinese).
[38] MU Li-zhong, HE Ying and CHEN Jun-yuan et al. Study of blood flow regulation in a patient-specific model for the circle of Willis with an aneurysm by computational and in-vitro simulation[J] Chinese Journal of Hydrodynamics, 2015, 30(6): 707-715(in Chinese).
[39] KAN Xiao-xin, BAI Yi-fan and MA Tao et al. Fluid-structure interaction of aortic dissection based on the computed tomography reconstructed model[J]. Chinese Journal of Hydrodynamics, 2015, 30(6): 701-706(in Chinese).
[40] LIU Hai-bin, QIN Kai-rong and YUAN Wen-xue et al. Acute effect of moderate intensity aerobic cycling exercise on carotid arterial stiffness and hemodynamics in sedentary controls[J]. Chinese Journal of Hydrodynamics,2015, 30(6): 721-728(in Chinese).
[41] WANG Yan-xia, GAO Zheng-ming and LIU Bo et al. A flow chamber device for simulating oscillatory shear stress in the common carotid artery after exercise training[J]. Chinese Journal of Hydrodynamics, 2015, 30(6): 650-656(in Chinese).
September 20, 2015, Revised April 1, 2016)
* Biography: Simon Sui-Man LAI (1985-), Male,
Master, Research Associate
Abraham Yik-Sau TANG,
E-mail: aystang@hku.hk

- 水动力学研究与进展 B辑的其它文章
- Theoretical analysis and numerical simulation of mechanical energy loss and wall resistance of steady open channel flow*
- Investigation of cavitation bubble collapse near rigid boundary by lattice Boltzmann method*
- Numerical solution of thermo-solutal mixed convective slip flow from a radiative plate with convective boundary condition*
- Oscillating-grid turbulence at large strokes: Revisiting the equation of Hopfinger and Toly*
- A robust WENO scheme for nonlinear waves in a moving reference frame*
- Numerical simulations of viscous flow around the obliquely towed KVLCC2M model in deep and shallow water*