
Application of first order rate kinetics to explain changes in bloom toxicity—the importance of understanding cell toxin quotas*
2018-08-02 02:50PhilipORRAnusuyaWILLISMicheleBURFORD
Philip T. ORR , Anusuya WILLIS, Michele A. BURFORD
Australian Rivers Institute, Griffith University, 170 Kessels Rd, Nathan, Qld 4111, Australia
Abstract Cyanobacteria are oxygenic photosynthetic Gram-negative bacteria that can form potentially toxic blooms in eutrophic and slow flowing aquatic ecosystems. Bloom toxicity varies spatially and temporally, but understanding the mechanisms that drive these changes remains largely a mystery. Changes in bloom toxicity may result from changes in intracellular toxin pool sizes of cyanotoxins with differing molecular toxicities, and/or from changes in the cell concentrations of toxic and non-toxic cyanobacterial species or strains within bloom populations. We show here how first-order rate kinetics at the cellular level can be used to explain how environmental conditions drive changes in bloom toxicity at the ecological level.First order rate constants can be calculated for changes in cell concentration ( μ c: speci fic cell division rate)or the volumetric biomass concentration ( μ g: speci fic growth rate) between short time intervals throughout the cell cycle. Similar first order rate constants can be calculated for changes in nett volumetric cyanotoxin concentration ( μ tox: speci fic cyanotoxin production rate) over similar time intervals. How μ c (or μ g) covaries with μ tox over the cell cycle shows conclusively when cyanotoxins are being produced and metabolised,and how the toxicity of cells change in response to environment stressors. When μ tox/ μ c >1, cyanotoxin cell quotas increase and individual cells become more toxic because the nett cyanotoxin production rate is higher than the cell division rate. When μ tox/ μ c=1, cell cyanotoxin quotas remains fixed because the nett cyanotoxin production rate matches the cell division rate. When μ tox/ μ c <1, the cyanotoxin cell quota decreases because either the nett cyanotoxin production rate is lower than the cell division rate, or metabolic breakdown and/or secretion of cyanotoxins is occurring. These fundamental equations describe cyanotoxin metabolism dynamics at the cellular level and provide the necessary physiological background to understand how environmental stressors drive changes in bloom toxicity.
Keyword: cyanotoxin production dynamics; first order rate kinetics; cyanobacteria
1 INTRODUCTION
Cyanobacteria are primitive autotrophic Gramnegative bacteria that have been present on Earth for an estimated 3.5×10⁹y. Cyanobacteria were largely responsible for modifying a CO2-rich atmosphere to produce an O2-rich atmosphere which allowed the evolution of eukaryotes and intelligent life.Cyanobacteria (like many bacteria) produce a suite of bioactive compounds, the natural function of which is large unknown. Some of those compounds are the cyanotoxins—a suite of more than 250 bioactive toxigenic compounds which can directly impact the environment and have economic consequences because they present a health risk to humans and other animals if ingested. They are of particular concern to water managers who are responsible for managing recreational and drinking water supplies.
Records of toxic algae and cyanobacteria have been around for several thousand years but the first record in the scienti fic literature was an account by Francis(1878) who described a bloom of Nodularia spumigena Mertens ex Bornet and Flahault in Lake Alexandrina in South Australia. This report included a description of the deaths of sheep, horses, dogs and pigs that had been exposed to, and drunk the water from Lake Alexandrina. He suggested that the surface scum was toxic and responsible for the animal deaths. Since then there have been numerous reports in the literature of animal intoxications from exposure to a wide range of cyanobacteria and their toxins (Deem and Thorp,1939; M c Leod and Bondar, 1952; Negri et al., 1995;Wood et al., 2017a). In addition to records of animal deaths, there is also evidence that cyanotoxins were implicated in the deaths of 72 people in Caruaru in Brazil where contaminated dialysis water obtained from Tobocas Reservoir was used to treat patients in a renal dialysis centre (Jochimsen et al., 1998).
Although there had been reports of in-lake toxicity variability (Rose, 1953), little research was initially carried out on the mechanism of cyanotoxin production, the environmental triggers which cause these organisms to begin producing these cyanotoxins,or what drives changes in toxicity of blooms at either the cellular or population scales. Interest was stimulated following publication of papers by Gorham(1960, 1964) that described the changes in intracellular fast death factor (FDF) in cultures of M icrocystis aeruginosa (Kützing) Lemmermann in response to culture age and temperature. Carmichael and Gorham(1981) documented the first comprehensive spatial and temporal survey of cyanotoxin dynamics in Hastings Lake, Canada. They showed that the spatial distribution of FDF varied throughout the lake by up to 4 orders of magnitude over distances as short as several decimetres, and varied temporally over days,months and years. The study by Carmichael and Gorham (1981) stimulated interest in the kinetics of cyanotoxin production. Principally using mouse bioassay by intraperitoneal injection, researchers began to study the effects of a wide range of environmental stressors to identify how they triggered production of FDF, because of the impacts on safety of drinking water sourced from contaminated supplies.
Preliminary identi fication of the FDF cyanotoxins as microcystins (MCYST’s) by Bishop et al. (1959),and comprehensively by Botes et al. (1984), led to development of rapid and accurate analytical detection methods. Numerous further laboratory and field studies were carried out to test the role of environmental stressors including light, temperature, nutrient limitation, trace metals and pH on the production kinetics of MCYST’s and the closely related marine cyanotoxin, nodularin (NODLN) in a suite of species that were known to produce them (van de Westhuizen and Eloff, 1983; Watanabe and Oishi, 1985; Wicks and Thiel, 1990; Sivonen, 1990; Kiviranta et al.,1991; Utkilen and Gløme, 1992; Lukač and Aegerter,1993; Lehtimäki et al., 1994; Rapala et al., 1997;Wood et al., 2017b). While other cyanotoxins(anatoxin-a and anatoxin-a(s)) were known at this time, and a range of species known to produce them,it was primarily production of MCYST’s by M. aeruginosa, O scillatoria agardhii Gomont(basionym Planktothrix agardhii (Gomont)Anagnostidis and Komárek) and Anabaena flosaquae Brébisson ex Bornet and Flauhault, which were of interest because of the impact they had on safety of drinking and recreational water supplies.
In 1979, an outbreak of hepato-gastroenteritis among 150 local residents occurred on Palm Island,Queensland, Australia (Byth, 1980a, 1980b). The outbreak was traced to a bloom of Cylindrospermopsis raciborskii Wołoszyńska Seenaya and Subba Raju and a new cyanotoxin of importance to water managers—cylindrospermopsin (CYN)—was subsequently identi fied in a strain of C. raciborskii isolated from the bloom (Hawkins et al., 1985).Hawkins et al. (2001) later carried out a batch culture study to assess how N-limitation impacted C.raciborskii to produce CYN’s, but the majority of studies on environmental regulation of CYN’s production by C. raciborskii have been carried out in recent years by Davis et al. (2014), Pierangelini et al.(2014), Pierangelini et al. (2015) and Willis et al.(2015). These studies have conclusively shown that production of CYN’s by C. raciborskii is a constitutive process and largely independent of environmental drivers (Burford et al., 2016).
In the Austral summer of 1991, a 1 000-km bloom of Dolichospemum circinale Rabenhorst ex Bornet and Flahault (basionym Anabaena circinalis Rabenhorst) occurred in the Darling River in NSW,Australia (Bowling and Baker, 1996). The bloom was demonstrably neurotoxic but none of the cyanotoxins known at the time were identi fied in bloom samples.This had serious health implications for drinking water safety for local communities because now, a new unidenti fied cyanotoxin capable of contaminating water supplies had been discovered. Worryingly, the cyanotoxin concentrations in drinking water could not be measured analytically, and there were no known water treatment processes available to remove them. Nor was there any indication of what the environmental drivers were that were stimulating the cyanobacteria to produce them. These cyanotoxins were eventually identi fied by Humpage et al. (1994)as paralytic shell fish poisons (PSP’s), and now referred to as saxitoxins (STX’s) when produced by cyanobacteria. STX’s were later identi fied in strains of C. raciborskii from Brazil (Lagos et al., 1999) and have since been implicated in the deaths of patients at a renal dialysis centre in Caruaru, Brazil (Jochimsen et al., 1998). To date, only a few studies have been undertaken on the regulation of STX’s production by either Australian strains of A. circinalis, (Negri et al.,1997; Testè et al., 2003) or South American strains of C. raciborskii (Castro et al., 2004; Carneiro et al.,2009; Carneiro, 2013).
There are many species of cyanobacteria that produce a wide range of known cyanotoxins including many which have not been mentioned here and it is beyond the scope of this paper to comprehensively review those studies. From a management perspective,it is the MCYST’s, STX’s and CYN’s produced by M. aeruginosa, A. circinalis, A. flos- aquae and C. raciborskii that are of most interest to water managers who need to know what environmental drivers are largely responsible for stimulating production of cyanotoxins by these organisms in water supplies, and how this impacts upon bloom toxicity.
In all the earlier studies of MCYST production by M. aeruginosa and A. flos- aquae, there was no apparent common pattern of response to any environmental stressor although interestingly, van de Westhuizen and Eloff, (1983) noted that changes in bloom toxicity “…might be due to changes in species composition…”. They dismissed this as unlikely given the known rapid spatial and temporal dynamics of bloom toxicity shown by Carmichael and Gorham(1981) but Wood et al. (2017b) were not so dismissive and noted that “…a range of environmental variables(e.g. temperature, nutrients) in fluence the relative abundance of toxic and non-toxic genotypes…”. It wasn’t until publication of the study by Orr and Jones(1998) that a strong correlation between the speci fic rates of cell division and production of MCYST-LR by M. aeruginosa was identi fied. The implications of the findings by Orr and Jones (1998) for explaining toxicity dynamics of blooms were not fully appreciated until the studies by Davis et al., (2014), Pierangelini et al., (2014, 2015) and Willis et al., (2015) when the importance of strain differences were recognised, and the production dynamics at the cellular level could then be used to explain the effects of environmental drivers of bloom toxicity changes.
In this paper we review the importance of assessing changes in cyanotoxin cell quotas ( Q) in response to external stressors and show how an understanding of the cyanotoxin production kinetics at the cellular level is essential to explain the temporal and spatial variability of bloom toxicity at the environmental level that was first documented by Carmichael and Gorham (1981).
2 MEASURING METABOLITE PRODUCTION DYNAMICS
Production of any metabolite including cyanotoxins is a complex process that may be under the control of many factors at a range of scales from the molecular to the environmental level. This can include up and down regulation of cyanotoxin production genes,activation and deactivation of cyanotoxin production enzymes, nutrient limitation of substrates used directly in the production of cyanotoxins, nutrient limitation of other cellular processes required for cyanotoxin production and through impacts of external factors such as temperature and pH on the rates of intracellular processes. Irrespective of where control of cyanotoxin production occurs, it is ultimately expressed at the cell physiological level.Production sensu strictu is de fined as an increase in the pool size (i.e. total amount) over time, with nett toxin production being the result of metabolic production, minus metabolic and chemical degradation.
When normalised to volume, the cyanotoxin pool size in a culture or a bloom (as intracellular,extracellular or total cyanotoxin/mL), is called the volumetric cyanotoxin concentration (Orr and Jones,1998). Changes in the volumetric cyanotoxin concentration represent nett changes to the pool size.If the volumetric cyanotoxin concentration changes temporally, it can only be interpreted as cyanotoxin production or loss. Therefore measuring the temporal dynamics of intracellular and extracellular cyanotoxin pool sizes provides information on secretion and/or degradation rates. Comparison of intracellular,extracellular and total volumetric cyanotoxin concentration was used by Orr and Jones (1998) to demonstrate that MCYST-LR was only released from the cells during cell lysis, and similarly by Davis et al.(2014) to demonstrate CYN secretion during stationary phase when increased cell-lysis occurred.Indeed, Orr and Jones (1998) were also able to show that the extracellular MCYST-LR pool size correlated with the number of cells that had lysed in death phase based on the measured cell MCYST-LR quotas( QMCYST-LR) during stationary phase.
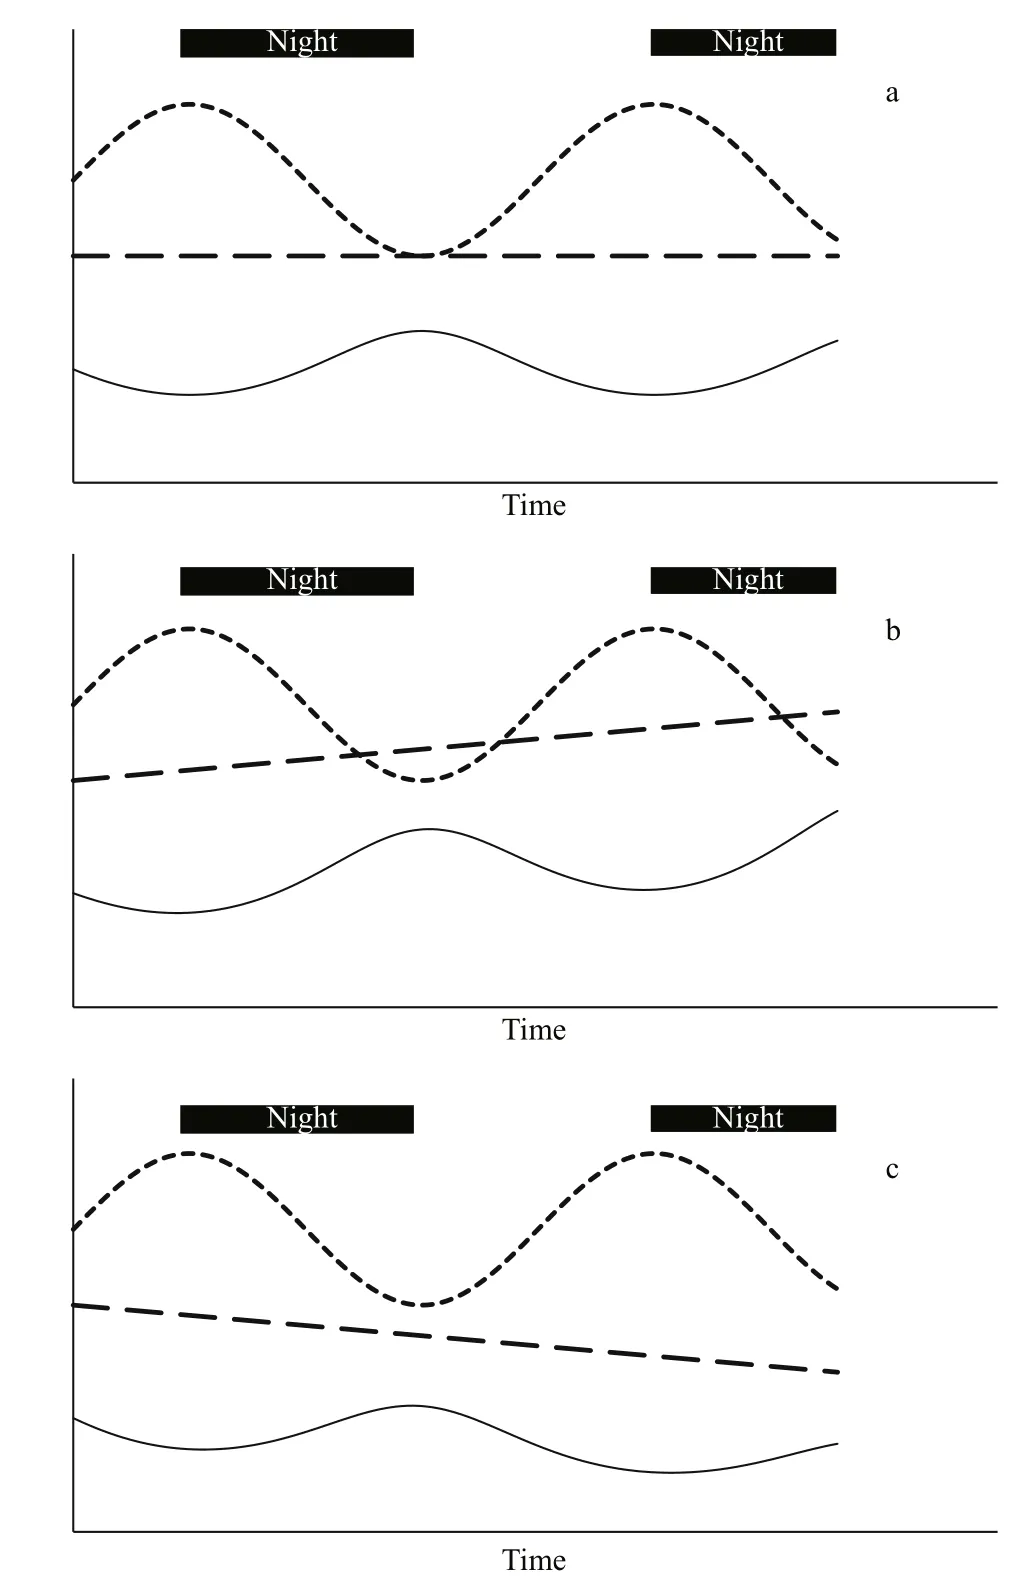
Fig.1 Gravimetric toxin concentration (black line)changes in response to diel volumetric dry weight concentration (dotted line); the cyanotoxin pool size(dashed line) is a) remaining constant, b) increasing and c) decreasing over time
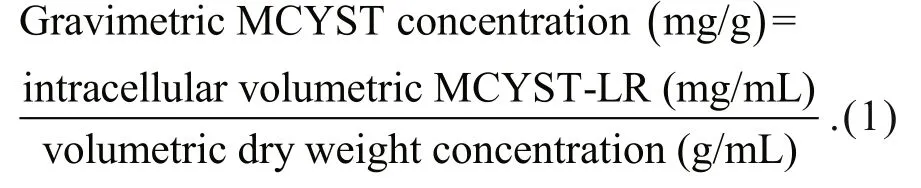
Gravimetric concentration (mass of cyanotoxin per unit mass of cyanobacteria) has often been used to assess the impacts of environmental stressors on the rates of cyanotoxin production (Sivonen, 1989; Wicks and Thiel, 1990) but it is actually a measure of proportional content, and therefore cannot be used to assess whether cyanotoxins have been produced or not.
Temporal changes in the gravimetric cyanotoxin concentration measure changes in the toxicity of the material by describing relative changes in the proportion of cyanotoxin within the total biomass.Gravimetric concentration cannot be used to assess production or loss of cyanotoxins—or indeed of any metabolite—because the gravimetric cyanotoxin concentration is equally affected by changes to the volumetric dry weight concentration (denominator in Eq.1) as it is by changes to the volumetric cyanotoxin concentration (numerator in Eq.1). Figure 1 shows how the gravimetric cyanotoxin concentration (solid line) varies inversely to changes in volumetric dry weight concentration (dotted line) and that it can increase, remain constant or decrease irrespective of whether the amount of cyanotoxin or any metabolite(dashed line) has increased, remained constant or decreased. Indeed, cyanotoxins are also a component of the dry weight so cyanotoxin dynamics are also re flected in the dry weight dynamics.
Similarly, where the amount of cyanotoxins are expressed against anything that is also a variable—such as protein (Utkilen and Gjølme, 1992),chlorophyll or carbohydrate (Lyck, 2004)—the result gives the relative proportions of those two variables so changes measure how they covary and cannot be used to assess production or loss. This was recognised by Lyck (2004) who said that “…microcystin data must be expressed in a way that is independent of more variable cellular components, such as protein,chlorophyll and carbohydrate (dry weight), to re flect true changes in microcystin content.”. Therefore, the only suitable parameter for assessing and measuring production and loss of cyanotoxins (or any metabolite)is volumetric cyanotoxin (or metabolite)concentration.
Having calculated the intracellular volumetric cyanotoxin concentration (intracellular cyanotoxin/mL) allows calculation of the cell cyanotoxin quota( Q) using Eq.2. This is the population average amount of cyanotoxin contained in each cell.
During cell division, existing cyanotoxins will be partitioned into daughter cells and the cell quota will halve. Anderson et al., (1990) referred to this a“division losses”. Additionally, the cell cyanotoxin quota ( Qtox) could be further reduced by secretion without affecting the total volumetric cyanotoxin concentration. However, if production of cyanotoxin occurs as the cell concentration increases, for each cell division the cell quota may either reduce by up to 50%, may remain constant or may increase depending on the relative rates of production of cells and cyanotoxin. We discuss the importance of assessing the rates of production when interpreting changes in bloom toxicity in the following section.
3 APPLICATION OF FIRST ORDER RATE KINETICS TO ASSESS CYANOTOXIN PRODUCTION
When rates of cell division are only limited by the physiological capacity of cells to divide and are not subject to nutrient limitation, light limitation or physiological stress, cell concentrations will increase exponentially (log phase) so first order rate kinetics can be applied. The standard first order rate equation(Eq.3) describes the time rate of change of a variable that is doubling at a fixed rate ( μ) within a de fined time period (mins, hours or days). In Eq.3, μ is the first order rate constant, C0is the initial concentration,and C1is the final concentration after time interval t.

If the cell concentrations (cells/mL) are known at times t0and t1, the speci fic cell division rates ( μc) can be calculated using Eq.4 for cell concentrations C0and C1respectively.

Although batch culture growth and cell division curves only follow first order rate kinetics during log phase, Eq.4 can also be used to track how the instantaneous speci fic rates of cell division ( μc) or growth ( μg), and cyanotoxin production ( μtox) vary as cultures progress from log to stationary phase, then eventually death phase. Anderson et al. (1990) studied the production of PSP’s by the toxic dino flagellate Alexandrium fundyense Balech. They calculated μcfrom cell concentrations (which they incorrectly referred to as speci fic growth rate) and μtoxfrom intracellular volumetric PSP concentrations (mol intracellular PSP’s/mL) between harvest intervals throughout the experiment. They noticed a consistent correlation between changes in cell concentration and changes in volumetric toxin (PSP) concentration irrespective of whether the cultures were nutrient replete, N or P limited or suffering from temperature or salinity stress (see Anderson et al., 1990 (Figs.2A,3A, 4A, 5A, 6A)). They suggested that a 1:1 relationship between μcand μtoxshowed that PSP’s were produced at rates equal to what is needed to replace dilution through “division loses”. They also noted that when the ratio was greater than 1:1 it meant that PSP’s were being produced faster than new cells,and when the relationship was lower than 1:1 that they were produced at rates too slow to replace“division loses”. They did not elaborate or further explore the implications of this relationship. Equations 5, 6, and 7 describe the three possible scenarios relating changes in μcand μtox.
Equation 5 indicates that the speci fic rate of intracellular cyanotoxin production ( μtox) between t0and t1is slower than the speci fic rate of cell division( μc). The consequence of this is that at the cellular level, cyanotoxin production rates are insufficient to match the rate of division losses. Unless metabolism or excretion of cyanotoxins is occurring, μtoxand μcwill lie somewhere between 0.5 and 1 where 0.5 means no production is occurring and the existing cyanotoxin pool is being diluted into twice the number of cells at each division, and 1 which is the scenario described in Eq.6.

Equation 6 describes the condition where the speci fic rate of intracellular cyanotoxin production( μtox) between t0and t1is equal to the speci fic cell division rate ( μc). Cyanotoxin production occurs at rates that meet the demands of division losses and the cell cyanotoxin quota remains constant.

Equation 7 indicates that the speci fic rate of cyanotoxin production is faster than the speci fic cell division rate between t0and t1. The consequence of this is that production is more than sufficient to make up for division losses and the cell toxin quota will increase.

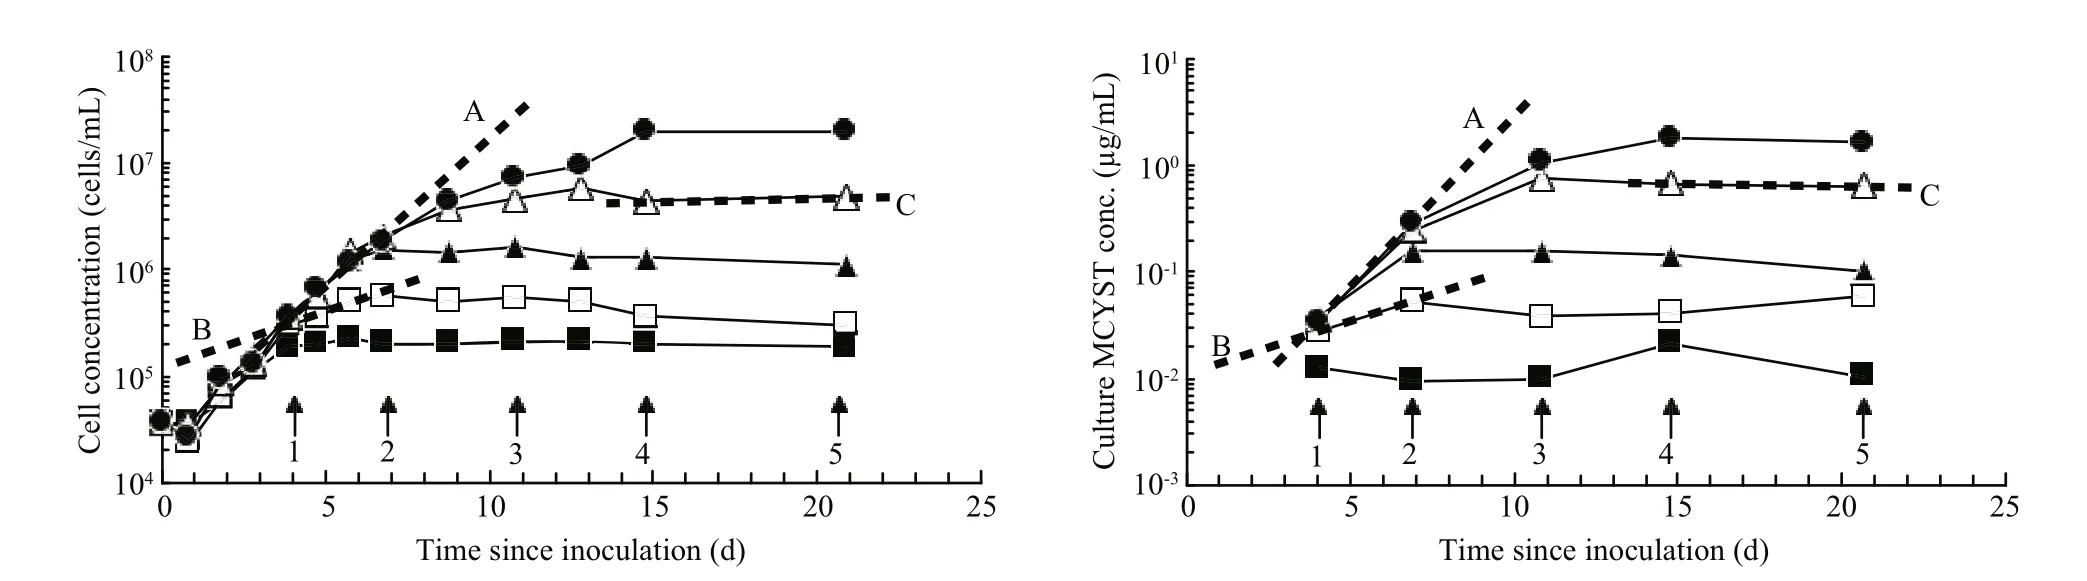
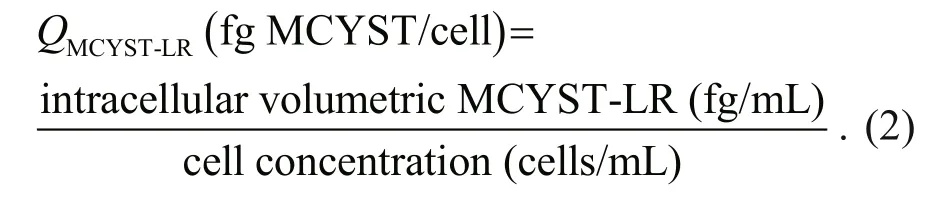
Fig.2 Volumetric cell concentration and volumetric MCYST-LR concentration curves redrawn from Orr and Jones (1998,Figs.1B and 6B) showing the first order rate curves plotted for three time intervals
While Eqs.5, 6, and 7 describe the relationship between the instantaneous rates of production of cells and cyanotoxins, a consequence of this is they also measure the instantaneous relative rate of change of the cell cyanotoxin quota ( Qtox). If the rate of cell division is faster than the rate of cyanotoxin production, Eq.5 also measures the rate Qtoxis falling and therefore how quickly cells (measured as the population average) are becoming less toxic.Conversely, Eq.7 measures the rate at which cells(measured as the population average) are becoming more toxic. Although alluded to by Anderson et al.(1990), Orr and Jones (1998) were the first to speci fically state than an important consequence of a 1:1 linear proportionality (Eq.6) was that the MCYSTLR cell quota ( QMCYST-LR) remains constant. Lyck(2004) later provided the first comprehensive assessment of the importance of the relationship between μc, μg, μtox,and Qtoxand showed that when the relationship between μtoxand μcwas linear but without 1:1 proportionality, Qtoxwould either increase or decrease with μcand cells would become more toxic or less toxic as they progressed from log into stationary phase.
4 IMPORTANCE OF CELL QUOTA
There is no reason to expect that the relationships described in Eqs.5, 6, and 7 should apply consistently throughout the cell cycle. It is possible, indeed likely,that different relationships may apply during different phases or in response to speci fic environmental stressors. Anderson et al. (1990) recognised this and plotted μcagainst μtox(see Anderson et al., 1990(Fig.8)) to show how the two first order rate constants covaried as cultures progressed from log through to stationary phase. They consistently found a linear and generally 1:1 proportionality lying consistently between 2:1 and 1:0.5 for all points (except 2) from all phases of the cell cycle from all experiments. If the relationship described in Eq.6 holds true over the entire cell cycle, then cyanotoxin production is tightly coupled to cell division and a new ( fixed) quota of cyanotoxin is only ever produced to replace division losses. In this case at the cellular level, Qtoxis constant because the cyanotoxin pool size doubles at the same rate as the cell concentration. Any metabolite that is produced in fixed amounts is said to be constitutive.
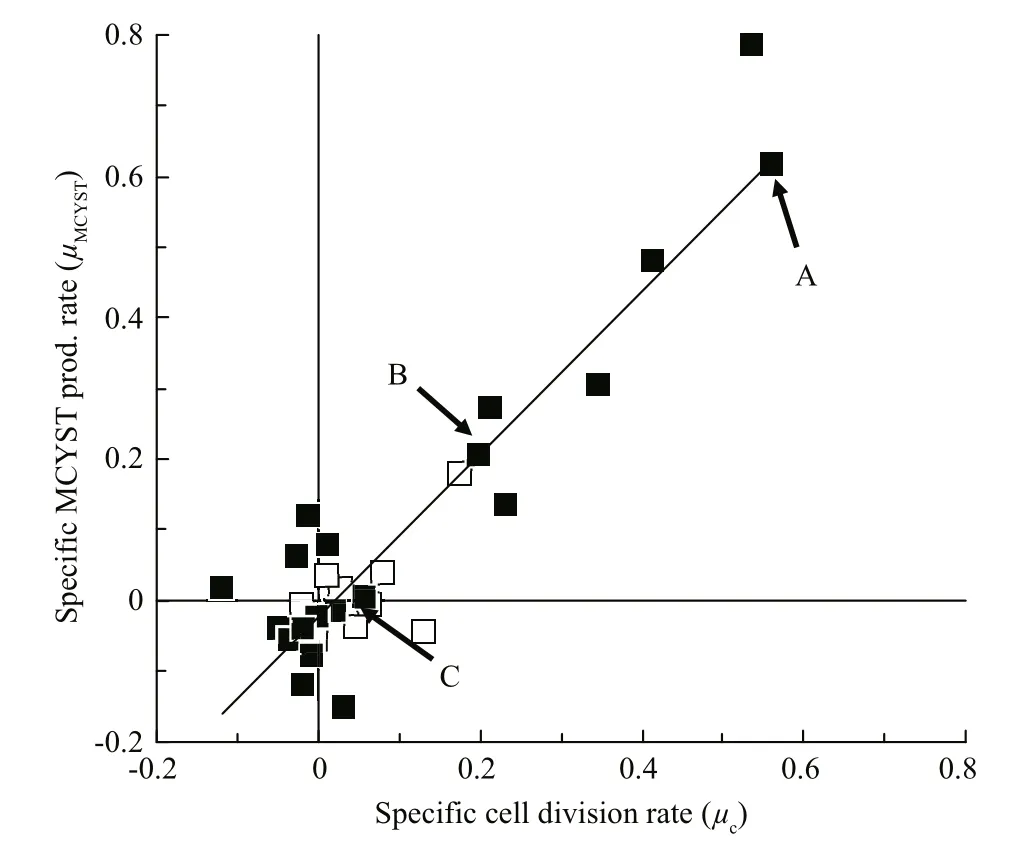
Fig.3 Redrawn from Orr and Jones (1998, Fig.8) with points identi fied that correspond to the first order rate curves shown in Fig.2
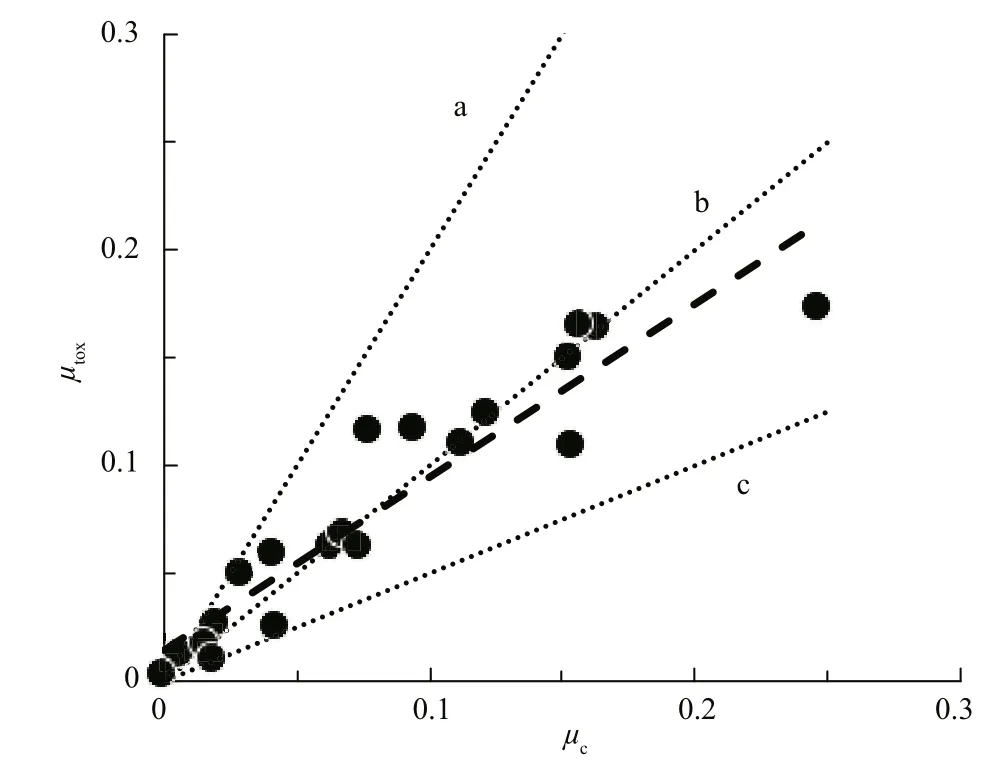
Fig.4 Speci fic cell division rate plotted against speci fic CYN production rate for a range of N nd P-limited C. raciborskii cultures
Orr and Jones (1998) applied that same method to their data and they calculated μtoxand μcfor corresponding short time intervals in log, stationary and death phases (Fig.2). They too were able to show that the first order rate constants μtoxand μcwere equal under N-limited growth in batch culture, during log and stationary phases but that μtoxremained constant while cultures moved into death phase (Fig.2, Line C and Fig.3 point C). When plotted, their data produced a linear correlation of 1:1 proportionality (Fig.3).Therefore, production of MCYST-LR seemed tightly coupled to cell division, and only sufficient MCYSTLR was ever produced to restore the MCYST-LR cell quota ( QMCYST-LR) to pre-division levels. Orr and Jones(1998) applied this method to data previously published by Sivonen et al. (1989) who studied the effects of light, temperature, nitrogen limitation and phosphorus limitation on production of desmethyl-3-MCYST-RR by O. agardhii, and Rapala et al. (1997)who studied the effects of these same environmental stressors on production of MCYST-LR, MCYST-RR and their des-methyl-ASP3variants by A. flos- aquae.Here too, the speci fic growth rate ( μg)—as a surrogate for cell division which they didn’t measure—and speci fic cyanotoxin production rate ( μtox) were highly correlated ( R2=0.94 and 0.95 for O. agardhii and 0.62 and 0.49 for A. flos- aquae) with a 1:1 proportionality over the cell cycle irrespective of the environmental stressor or the growth phase of the cultures (see Orr and Jones, 1998 (Fig.9)). Lyck (2004), however,showed that MCYST-LR was produced in the dark when cultures that had been grown under constant light were shielded with aluminium foil but even then,the ratio of μtoxto μcdid not exceed 2 and Lyck (2004)proposed that all the evidence suggested that MCYSTLR production by M. aeruginosa was constitutive.Long et al. (2001) showed that in continuous culture,the cell MCYST-LR quota was dependent on the cell division rate (the dilution rate) although production dynamics under continuous culture—where all cellular processes are in dynamic equilibrium—cannot be directly compared to batch culture kinetics.Using data from Orr and Jones (1998), Long et al.,(2001) and Lyck (2004), Jähnichen et al., (2008) were able to model the dynamics of MCYST’s production in both batch and continuous culture. They con firmed the observations of each of the three studies that QMCYSTvaried by less than 3-fold over the cell cycle irrespective of the strain used or the environmental variable that was tested. They also con firmed that despite having a linear proportionality between μtoxand μc, the correlation was not always 1:1 (as suggested by Eqs.5, 7). Lyck (2004) even observed that a 2-fold variation in Qtoxcan be expected irrespective of the underlying proportionality, because cells must reproduce their contents prior to cell division. Lyck (2004) also observed that cells grown under a 14:10 light-dark cycle had higher Qtoxin late stationary phase—presumably as cells continue to produce MCYST but did not divide. Orr and Jones(1998) who grew their cultures under continuous light demonstrated the opposite with a 3-fold lower Qtoxof 50 fg/cell in stationary phase compared to 150 fg/cell during log phase—presumably as cells continued to divide for between 1 and 2 cell divisions as the nitrogen cell quota fell from Q Nmaxto Q Nminand“division losses” were not replaced—the scenario described in Eq.5.
Following on from that study, Hawkins et al.,(2001) carried out a batch culture study on the production of cylindrospermopsins (CYN) by C. raciborskii. Under N-limitation, they showed that for this species, production follows similar production kinetics with μcand μtoxcovarying linearly and with 1:1 proportionality—at least during log phase and the transition to stationary phase. More recently, in a comprehensive coordinated study on the impacts of a wide range of environmental stressors on production of CYN by three CYN-producing strains of C. raciborskii, (Davis et al., 2014; Pierangelini et al.,2014; Pierangelini et al., 2015; Willis et al., 2015;Willis et al., 2016) showed that μcand μtoxare tightly coupled with a 1:1 linear proportionality. The consequence of this according to Eq.6, is that CYN cell quotas ( Qcyn) were fixed for each strain but varied by several orders of magnitude between strains.Figure 4 shows data from Willis et al. (2015) for a range of N- and P-limited C. raciborskii cultures and demonstrates the uniform linearity and 1:1 proportionality of the relationship between μtoxand μcfor the three CYN-producing strains that have different constituent CYN cell quotas. Together, these authors have shown conclusively that CYN production by C. raciborskii at the cellular level is largely unaffected by environmental stressors and that CYN’s are produced in fixed amounts during cell division so production is therefore constitutive (Burford et al.,2016). Given the consistent correlation and 1:1 proportionality between μtoxand μcfor a range of strains and environmental stressors, we postulate that CYN’s might not be secondary metabolites, but may actually be primary metabolites in strains that produce them with a function related to growth and cell division that has yet to be discovered.
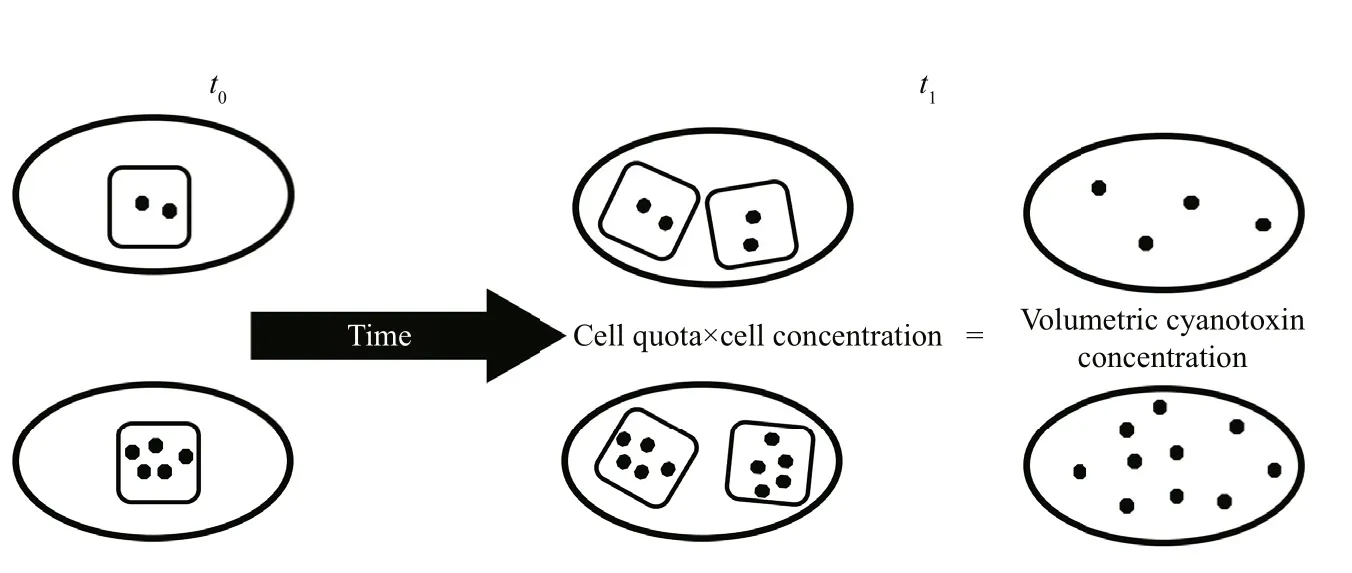
Fig.5 Two strains with different cell quotas at t 0
5 IMPLICATIONS FOR BLOOM TOXICITY
Measuring changes in the intracellular, extracellular or total volumetric cyanotoxin concentration is the only way to conclusively demonstrate that nett production (sensu strictu), loss, degradation,remetabolism, secretion or relocation of cyanotoxins has occurred because it provides a direct measure of changes to the intracellular, extracellular or total pool sizes within a fixed volume. There are more than 250 known cyanotoxins within the three major toxin groups, around 20 STX’s and at least 5 known CYN’s.The molecular toxicity of each variant is different, is not always known and can differ by several orders of magnitude from essentially being non-toxic such as linear MCYST-LR (Bourne et al., 1996) to STX with a molecular toxicity of 2 483 Mouse Units/μmol by IP injection (Kuiper-Goodman et al., 1999). Bloom toxicity is therefore solely determined by the total volumetric cyanotoxin concentration, but modi fied by the dynamics of individual cyanotoxins which have different molecular toxicities (Negri et al., 1997),modes of action and routes of ingestion. Understanding how Qtoxvaries over the cell cycle in response to environmental stressors for each cyanotoxin produced by different species or strains in a bloom population provides valuable insights into how environmental stressors are responsible for driving changes in bloom toxicity.
There are several interpretations that can be made from changes to the volumetric cyanotoxin concentration alone. Individual cells may be becoming more or less toxic (i.e. Qtoxis increasing or decreasing);the relative proportions of individual cyanotoxins may be changing through production, remetabolism or chemical breakdown (Orr et al., 2004); new cells may be produced with each new cell having the same,higher or lower cell quotas than the parent cell, or the existing cell population may be relocated through advection or vertical entrainment within the water column. Therefore, changes to the volumetric toxin concentration must be considered concurrently with changes to a growth-related variable such as cell concentration, volumetric dry weight concentration,or even volumetric filament length— filament length per unit volume. Figure 5 shows 2 strains of a cyanobacterium with different Qtoxprogressing from t0to t1. Between times t0and t1, the cell concentration has doubled and the volumetric cyanotoxin concentration has doubled (Eq.6) but the Qtoxof each strain at t1is the same as it was at t0so the water has become more toxic but individual cells have not.
Within the MCYST’s, MCYST-LR is between 3 and 6 times more toxic than MCYST-RR and within the STX’s, the gonyautoxins (GTX) are about half as potent, and the C-toxins are about 160 times less potent than the parent STX (Negri et al., 1997). Work by Norris et al., (1999) showed that CYN was toxic and suggested deoxycylindrospermopsin (d-CYN)does not contribute signi ficantly to the toxicity of C. raciborskii. Neumann et al. (2007) later found con flicting results and showed that d-CYN was about 30% less toxic to cultured BE-2 and MNA cell lines after 48 h and 72 h of exposure than CYN. With the toxicity status of d-CYN unclear, a recent study by Stewart et al. (2017) has con firmed that d-CYN is indeed non-toxic. Measurement of μtoxand estimation of Qtoxfor individual cyanotoxins produced by a species or strain can be used to determine if the ratios of cyanotoxins with different molecular toxicities(MCYST-LR:MCYST-RR, CYN:d-CYN or STX:GTX2:C1) changes over the cell cycle or in response to environmental stressors rendering cells more or less toxic irrespective of changes to the total Qtox.
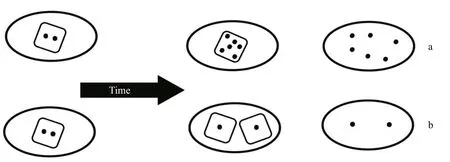
Fig.6 Each ellipse represents a unit volume of culture and each square represents a single cell
Calculating changes to the extracellular volumetric toxin concentration will indicate whether cyanotoxins are being released or degraded. If increases in the extracellular pool size correlate with the death of a known number of cells with a known fixed Qtoxthen cyanotoxins are being released as a consequence of cell lysis, however, if increases cannot be accounted for by cell lysis alone, then active secretion is indicated.
Complicating the issue of understanding drivers of bloom toxicity changes is the possible transformation of cyanotoxins to breakdown products that are more,or less toxic than the parent. Orr et al. (2004) showed that drinking water which met the Australian Drinking Water Guidelines (NHMRC and NRMMC, 2016)health alert level for STX’s of 3 μg/L (STX equivalents) at the water treatment plant could potentially become more than 3 times more toxic within 10 days due to spontaneous chemical breakdown of low potency C-toxins to more highly toxic decarbomyl-GTX’s, and that toxicity would exceed the health alert level for more than 50 days before breaking down to nontoxic breakdown products.
So how then does an understanding of the dynamics of cyanotoxin production at the cellular level help explain the dynamics of bloom toxicity in response to an environmental stimulus? There are several ways the toxicity of blooms can change. In the short term(hours to days) and over short spatial distances (e.g.within dm), changes to the volumetric cyanotoxin concentration can occur through cyanotoxin production within existing or new cells (Fig.6), or by remetabolism and degradation within existing cells or in the surrounding water. Physical relocation of existing cells through wind or current drift, or vertical entrainment will change the cell concentration in a particular location. In the longer term though (weeks to months), changes in strain or species dominance to strains or species that contain different cyanotoxins and different cell cyanotoxin quotas, will also change the volumetric concentrations of cyanotoxins within a bloom. To complicate the interpretation, any or all of these processes can be at play at any time within a mixed bloom population, but not within a laboratory monoculture.
The suite of cyanotoxins produced by individual strains, and the relative proportions of those cyanotoxins is usually fixed and to our knowledge there have been no documented records of individual stains spontaneously changing the suite of toxins that it produces (Sivonen, 1990; Negri et al., 1997; Orr and Jones, 1998; Willis et al., 2015) or spontaneously becoming toxic, or non-toxic. So, understanding how the cell quotas of individual cyanotoxins change during the cell cycle can begin to explain how toxicity of blooms change both spatially and temporally. We now know that production of CYN by C. raciborskii is constitutive, and that O. agardhii (Sivonen, 1990),A. flos- aquae (Rapala et al., 1997) and M. aeruginosa(Orr and Jones, 1998) have been shown to produce MCYST’s with kinetics that would suggest that production is also constitutive in those species.Therefore, because the cell cyanotoxin quotas of strains of these species is relatively fixed ( μtox: μchas a linear and approximately 1:1 proportionality) changes in the toxicity of blooms of these strains can be directly attributed to changes to the cell concentrations of existing strains—either through cell division or relocation implying that the volumetric toxin concentration will be maximal at peak cell concentrations. Therefore, increases or decreases in Qtoxof blooms (Wood et al., 2017b) of these species can only be explained as a change in the strains that are present that have different toxin pro files and different cyanotoxin cell quotas. In a mixed bloom population where strains with differing Qtoxcoexist,strain succession will also change the volumetric toxin concentration as suggested by van de Westhuizen and Eloff (1983).
6 CONCLUSION
It has now been shown conclusively that production of CYN by C. raciborskii, and inconclusively by Orr and Jones (1998) and Long et al., (2001) that production of MCYST-LR by M. aeruginosa is constitutive because Qtoxis fixed—or varies by no more than 2-3-fold—over the cell cycle. For these two species at least, and possibly for MCYST’s production by O. agardhii and A. flos- aquae,cyanotoxin production is not triggered by environmental stressors. Those stressors drive changes in bloom toxicity through the effect they have on the rates of cell division and growth of different strains with genetically different cyanotoxin cell quotas, and not through any stimulatory or trigger effect on the toxin production pathway itself.
 Journal of Oceanology and Limnology2018年4期
- Journal of Oceanology and Limnology的其它文章
- Editorial Statement
- Recent insights into physiological responses to nutrients by the cylindrospermopsin producing cyanobacterium,Cylindrospermopsis raciborskii*
- Response of Microcystis aeruginosa FACHB-905 to different nutrient ratios and changes in phosphorus chemistry*
- In fluence of light availability on the speci fic density, size and sinking loss of Anabaena flos- aquae and Scenedesmus obliquus*
- Regime shift in Lake Dianchi (China) during the last 50 years*
- The effects of electrochemical oxidation on in-vivo fluorescence and toxin content in Microcystis aeruginosa culture*