
Numerical simulation of transient turbulent cavitating flows with special emphasis on shock wave dynamics considering the water/vapor compressibility *
2018-09-28 05:33ChangchangWang王畅畅BiaoHuang黄彪GuoyuWang王国玉ZhongpingDuan段忠平BinJi季斌
水动力学研究与进展 B辑 2018年4期
关键词:王国
Chang-chang Wang (王畅畅), Biao Huang (黄彪), Guo-yu Wang (王国玉), Zhong-ping Duan (段忠平),Bin Ji (季斌)
1. School of Mechanical Engineering, Beijing Institute of Technology, Beijing 100081, China
2. State Key Laboratory of Water Resources and Hydropower Engineering Science, Wuhan University, Wuhan 430072, China
Abstract: The objective of this paper is to investigate the compressible turbulent cavitating flows with special emphasis on shock wave dynamics, with the water/vapor compressibility taken into account. The simulations are performed by solving the compressible,multiphase unsteady Reynolds-averaged Navier-Stokes equations with Saito cavitation model and SST-SAS turbulence model. The compressibility of both the pure water and vapor is considered by employment of the Tait equation of state for water and ideal gas equation of state for vapor. Results are presented for a 3-D NACA66 hydrofoil fixed at α=6° and σ=1.25 in partial cavitating flows. Cavity collapse induced shock wave formation and propagation, which is closely related to the compressibility characteristics of cavitating flows, are well predicted. Good performance has been obtained for both the cavity evolution process and cavitation induced pressure signals, especially the cavity collapse induced shock wave emission and its interaction with the attached cavity sheet. The pressure peaks in microseconds accompanying the shock wave are captured. The typical quasi-periodic sheet/cloud cavitation evolution is characterized by the following four stages: (1) the growth of the attached cavity sheet, (2) development of re-entrant flow and attached cavity sheet breakup, (3) attached cavity sheet rolling up and cavity cloud shedding, and (4) cloud cavity collapse, shock wave emission and propagation. The cloud cavity collapse induced shock wave dynamics is supposed to be the major origin of cavitation instabilities.
Key words: Turbulent cavitating flows, compressibility, re-entrant flow, shock wave, cavitation instability, OpenFOAM
Introduction
Hydrodynamic cavitation is an abrupt phase change phenomena when local pressure drops below vapor pressure. As the cavitation number drops, four attached cavitation regimes can be observed in the separated regions of the lifting surfaces such as pumps,turbines, marine propellers and rocket propulsions inducers, namely inception cavitation, sheet cavitation,cloud cavitation and super cavitation[1], with the cavitation region ranging from discrete bubbles or thin and glossy leading edge sheet[2-5]to contiguous domains. In the case of sheet/cloud cavitation, partial cavitation exhibits serious instabilities, especially in the process of destructive breakup, shedding and drastic collapse, which has adverse effects such as pressure fluctuations, vibration, noise and erosion[6-11].Experiments has identified the re-entrant flow, which is mainly caused by the pressure gradient at the rear of the attached cavity sheet, and the shock wave, which is closely related to the compressibility of both pure water, pure vapor and water/vapor mixture, as the main factors in this unsteady process[12-13]. The re-entrant flow mechanism has been verified and studied widely by both experiments and numerical simulations, while the investigation and understanding of shock wave mechanism is limited. A marked decrease in the sound speed in water/vapor mixture has been analyzed by Wallis[14], Brennen[15], and it is supposed that the effect of compressibility in liquid/gas mixture is much higher than that in both pure liquid and pure gas, where the local Mach number could reach even up to 10[16], providing the possibility of the existence of bubbly shock formation.Moreover, cavity collapse will generate shock wave,and the wave dynamics will significantly influence the cavitation instabilities. The coherent interaction of highly compressible features and the abrupt phase change phenomena in unsteady sheet/cloud cavitation has a powerful feedback on cavitation dynamics.
The bubble dynamics shows that water compressibility significantly influence the bubble collapse behavior, especially during the final stage when R<0.02Rmax-0.04Rmax. The bubble wall velocity can exceed the sound speed in liquid, even reaching Ma=2.2[17]and the bubble collapse induced shock wave is closely related to the liquid compressibility.On the other hand, bubbly mixture would experience an abrupt reduction in sound speed, resulting in sonic/supersonic flow even when the bulk flow velocity is relatively low[14-15,18]. Moreover, cavitation is characterized by transient abrupt mass transfer process, and the study by Franc and Michel[19]indicated that the mass transfer will further reduce the sound speed, increasing the compressibility in cavitating flows. Shamsborhan et al.[16]applied the pressure transducers and optical probe to measure the speed of sound in high void fraction two-phase flows. The results show that the sound speed in cavitating flows can drop to even below 10 m/s, and the Mach number exceeds 1.2, confirming the high compressibility characteristics in sonic/supersonic cavitating flows.The existence of shock wave in cavitating flows was firstly conjectured by the pressure pulses measurement[20-23]. Following, Reisman et al.[24]conducted experiments to investigate the dynamics and acoustics of cloud cavitation using high speed video and unsteady pressure transducers. They identified the global shock wave structure which is associated with the coherent collapse of cloud cavity, and two local structures, namely crescent-shaped region and leadingedge structures, which are caused by less-coherent collapse of cavity cloud. Further, they concluded that the shock wave dynamics is responsible for the damage and noise in cavitating flows. The pressure pulse in cavitating flows has also been captured by Leroux et al.[25]and Chen et al.[6]. Recently, Ganesh et al.[26-28]used the high-speed visualization and time-resolved X-ray densitometry measurements to examine the cavity dynamics in a wedge. They observed that with a sufficient reduction of cavitation number, the formation and propagation of a bubbly shock within the high void-fraction bubbly mixture is responsible for the large-scale periodic cloud shedding. The shock wave front is identified by the X-ray densitometry void-fraction field, confirming the existence of shock wave in cavity. However, the onset of the shock wave is not clear. Budich et al.[29]conduced numerical simulation to study the condensation shocks in cavitating flow in the same wedge and captured the periodic propagation condensation shocks in the two-phase medium forming at the trailing part of the partial cavity. They found that the condensation fronts can be triggered by shocks induced by a downstream collapsing cloud and are also observed without cloud cavity collapse. Moreover, the pressure gradient is sufficient to induce such a shock front. Leroux et al.[30]applied a joint experimental and numerical investigation of the mechanisms involved in the partial cavity instabilities around a NACA66 hydrofoil. The experiments showed that there are two dynamics associated with partial cavity instabilities, one is dominated by re-entrant flow, characterized by higher Strouhal number (~0.3) and the other by shock wave characterized by lower Strouhal number(~0.07/0.09). The shock wave mechanism consists of the alternate interaction between the re-entrant flow and shock wave, which is caused by the shedding cloud cavity collapse induced shock wave emission and propagation in the field and significantly influence the residual cavity growth. The numerical results based on a single fluid model, where the baroclinic torque[31]is ignored in the cavitation region,around a 2-D foil captured the cloud cavity collapse induced shock wave phenomena and its transportation.However, the numerical result focused on the shock wave emission and propagation at the foil wake and the interaction between the shock wave and the cavity sheet is ignored. The effect of compressibility within the cavitating flows, especially the cavity collapse induced shock wave dynamics is important for the understanding of the cavitation dynamics. The coupling of transient mass transfer and highly compressibility effects makes the physics more complex. To further investigate the compressible turbulence cavitation dynamics, it is necessary to discuss the bubble/cavity cluster collapse dynamics,considering the compressibility of both liquid and vapor. Using a twisted hydrofoil, Schnerr et al.[32]conducted cavitation simulation using the CATUM and captured the cavity collapse induced shock wave with high pressure at 2.3×10⁴kPa using the nanosecond time step with the inlet speed at 50 m/s.Recently, several researchers[33-35]have developed compressible methods based on two phase mixture by employing the state equation of both liquid and vapor for the simulation of cavitating flow. However, the cavity collapse shock wave and its interaction with the cavity are rarely reported. OpenFoam is an open source software and has been adopted as an effective tool for the cavitation simulation[36].
In the present work, numerical simulation, based on transport equation cavitation model, of the transient cloud cavity dynamics around a NACA66 hydrofoil is conducted. The compressible governing equations, including mass, momentum and energy conservation equations, are solved. The thermodynamic equations of state with Tait equation of state for pure water and ideal gas state equation for vapor are implemented to consider the compressibility effects of both water and vapor. The objectives of this paper are to (1) illustrate the cavitation structure evolution in the transient sheet/cloud cavity behaviors along with cavity collapse induced shock wave, considering the compressibility of both water and vapor, (2) promote the understanding of the sheet/cloud cavity instabilities, in particular the shock wave dynamics.
1. Mathematical and physical model
1.1 Governing equations
The governing equations are the three-dimensional compressible Navier-Stokes equations (continuity, momentum and energy equations) along with a transport equation for the void fraction:
wheremρ, U, p, e, K,mμ, Cpm, T,mκ,m+, m-and t are the density, velocity vector,pressure, internal energy, kinematic energy, dynamic viscosity, specific heat, temperature, thermal conductivity, water evaporation rate, condensation rate and time, respectively. αeff=α1κ1/cv1+α2κ2/cv2, κ1,2κ, cv1and cv2are the thermal conductivity and specific heat of liquid and vapor respectively. The subscript m, l and v indicates the liquid/vapor mixture, liquid and vapor phase, respectively. I is the unit tensor. The surface σ is taken to be constant as 0.0728. Eqs. (1)-(4) are closed by the state equations given in the next subsection to consider the compressibility effects of both water and vapor. Heat transfer is accounted for by solving the energy equation where the temperature distribution varies in the cavitation region.
1.2 State equation for vapor, water and vapor/vapor mixture
In the present study, the set of governing equations in Section 1.1 are closed by an equation of state for water and vapor to consider the compressibility effects of both water and vapor, which are important for the wave dynamics in cavitating flows,especially during the cloud cavity collapse process.Considering the control volume Ω, the volumeaveraged vector or conservative variables is defined as

where overbars denote cell averages.
We consider calorically perfect gas obeying the ideal-gas equation of state

where subscript v denotes vapor-phase value and Rv=461.6 J/(kg· K)is gas constant. In the present study, the non-condensable gas is ignored in the gas phase.
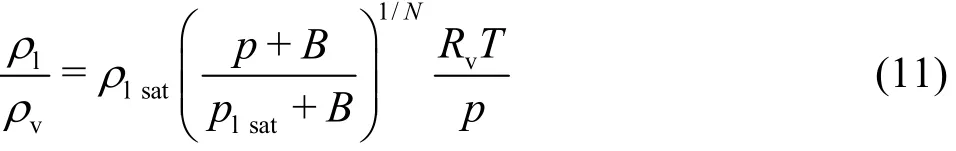
The equation of state in the pure water region is expressed by the Tait equation of state[37]:
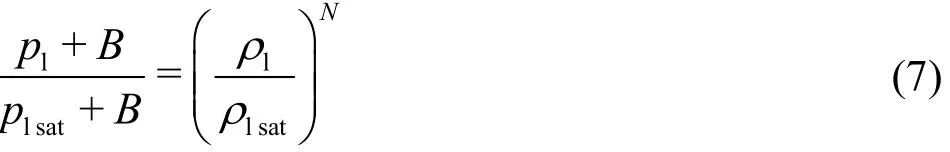
where psat=2338.6 Pa and ρsat=998.16 kg/m3are the saturation pressure and saturation density of liquid water at 293.15 K according to National Institute of Standards and Technology (NIST) data.B=3.06× 10⁸Pa and N=7.1 are the fitted constants. The comparisons of density and speed of sound in water between the present Tait equation and NIST data are shown in Fig. 1(a), and the comparison of speed of sound in water/vapor mixture obtained by Brennen method[15]with experiment data[38-40]are shown in Fig. 1(b) (c is the sonic speed). Although the present Tait equation underpredicts the value of speed of sound in pure water within the range of 10 m/s, the speed of sound in mixture shows a good agreement with experiment data. This is not seen as a serious drawback for the prediction of compressibility effects in water/vapor mixture.
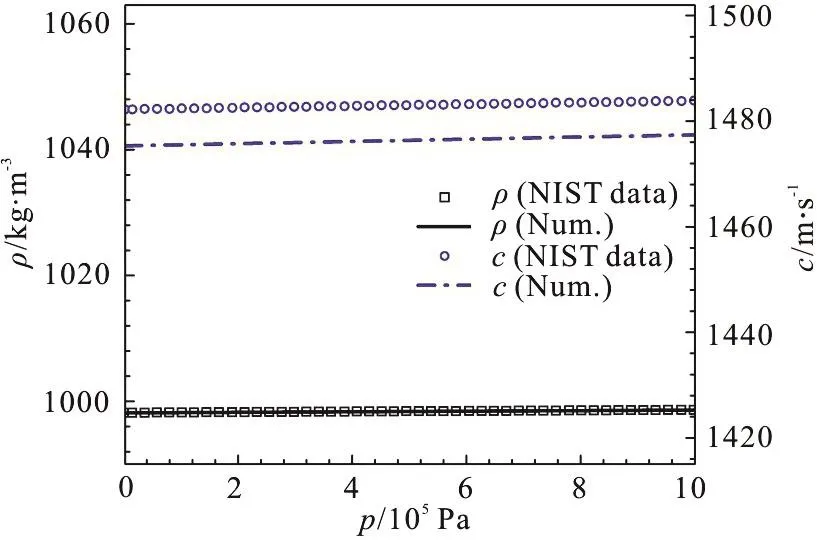
Fig. 1(a) (Color online) Comparisons of density (left) and speed of sound (right) in water predicted by the present Tait equations of state with NIST data
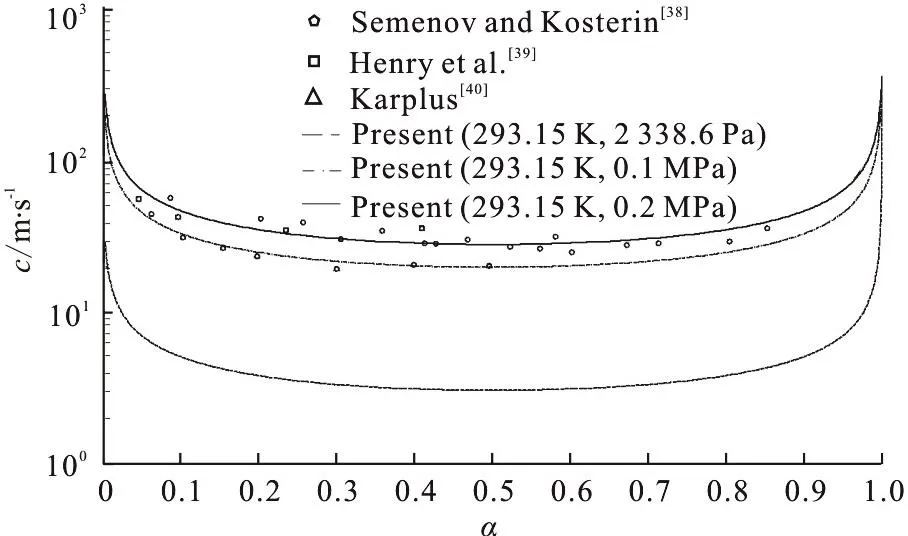
Fig. 1(b) Comparisons of speed of sound obtained by Brennen method[15] in water-vapor mixture to experiment data[38-40]
For two-phase regions in cavitating flows, the homogeneous mixture of water and vapor in local thermodynamic and mechanical equilibrium are adopted. The density and dynamic viscosity of the water-vapor mixture can be expressed by linearly combining the vapor-phase and water-phase,vρ and lρ with 0≤α≤1 being the vapor volume fraction in the considered control volume:

where the density of water and vapor are defined by the equation of state in (7) and (6), the dynamic viscosity of water (μl=1.0018× 10⁻³Pa· s) and vapor(μv=9.7271× 10⁻⁶Pa· s) are assumed constant at 293.15 K due to the weak thermal effects in room temperature water.
Assuming the local thermodynamic equilibrium,p=pv=pland T=Tv=Tl. Along with the equations of state (6) and (7), the density ratio ρl/ρvcan be written as follows
1.3 Mass transfer model
The Saito cavitation model[41]is a transportequation based cavitation model and is employed to describe phase change between water and vapor. The mass transfer model for vapor-liquid mixture is based on the theory of evaporation/condensation on a plane surface[42], and the evaporation or condensation rate per unit surface area at the interface mbis expressed by the Hertz-Knudsen-Langumuir equation as follows
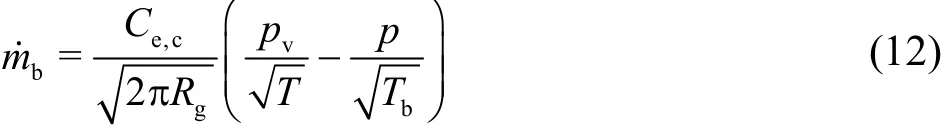
where Ce,c, Tb, pvand Rgare the evaporation or condensation coefficient at the bubble wall, the temperature in a bubble, the saturated vapor pressure,the partial pressure of vapor and the gas constant of vapor, respectively. Ignoring the thermal effects of cavitation process in room temperature water, Tb=T,and using the effective bubble radius Reffand the bubble number density n, the evaporation or condensation rate per unit volume in a vapor/liquid mixture m is modeled as follows:
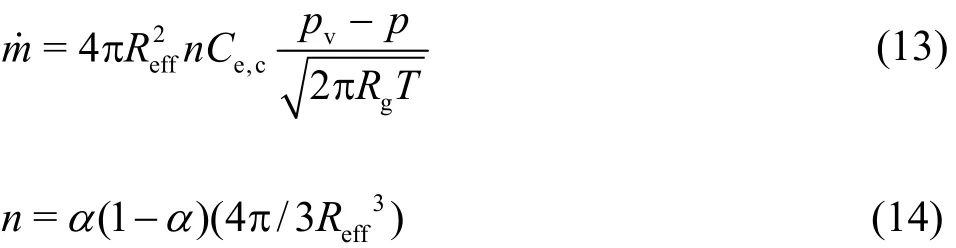
Finally, m˙ is expressed as follows

where A=3/Reff=Cαα( 1-α) , representing the concentration of interfacial area in the vapor/liquid mixture, according to Saito et al.[41]. Considering the non-symmetric characteristics of evaporation rate and condensation rate around the saturation temperature,then the mass transfer rate is expressed as follows:

where α is the void fraction,lρ is the liquid density,vρ is the vapor density and Ccis the rate coefficient for recon- version of vapor back into liquid when local pressure exceeds the saturated vapor pressure. Ceis the rate coefficient for vapor generated from liquid when local pressure below the saturated vapor pressure. In the present study,=Ce=1 is taken according to the Ref. [41].
The temperature-dependent saturation vapor pressureis given by the empirical formula[43]as

with θ=1-T/ Tc. The subscript “c” denotes temperature, pressure and density at the critical point. For water pc=22.064 MPa, ρc=322 kg/m3, Tc=647.14 K. Coefficients aiand exponents mifor water are given in Table 1.
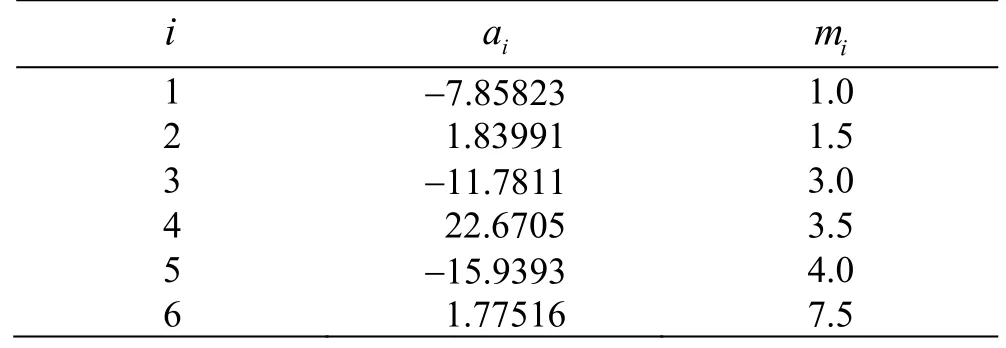
Table 1 Coefficients and exponents for the saturation state(13) for water[44]
1.4 Turbulence closure model
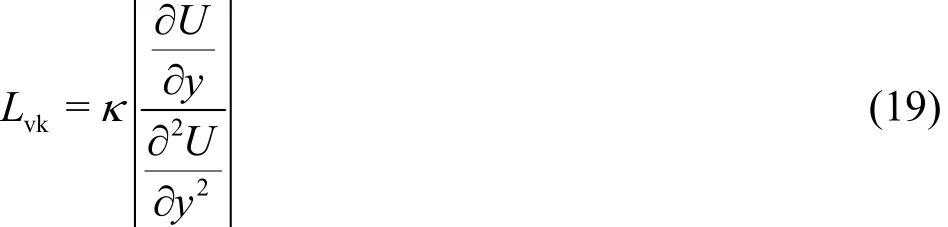
The compressible SAS SST turbulence model[45]used for high Reynolds number flows is used in the present work. It is a kind of hybrid RANS-LES model,where for attached flows the model shows RANS-like behaviors and in the unsteady regions LES-like behaviors, to better capture the unsteady cavitation dynamics. The SAS SST model is constructed by introducing the von Karman length-scale, Lvk, into the ω equation of the k-ω-SST model to be used as a sensor for detecting unsteadiness, which allows the SAS model to dynamically scale-adaptive to the resolved structures in the unsteady RANS calculation.
Turbulent kinetic energy (k) equation
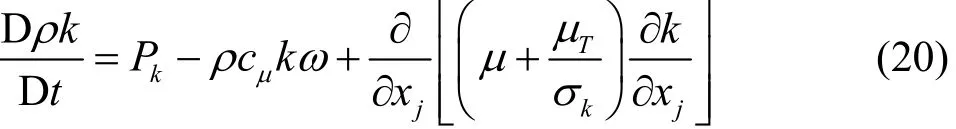
Turbulent frequency ()ω equation

where Pk=-τij∂Ui/∂xjis the production of turbulent kinetic energy and CDkω=∂k/∂xj∂ω/∂xjis the turbulent cross-diffusion term. The blending of the ω- equation with the ε-equation is achieved by the blending function F1and by blending the sets of closure constants. The turbulent viscosity is given by μT=a1k/max(a1ω,SF2),S=and F2is another blending function. The SAS term is as following

where ζ2=3.51, σΦ=2/3, CSAS=2.0,L=/is the length scale of the modeled turbulence.
2. Numerical setup and description
The numerical simulation is conducted based on the open source software OpenFOAM, and a phase change algorithm is implemented into the native compressible two-phase solver compressible Inter-Foam of OpenFOAM-4.0. The phase change is implicitly treated as a source to implement into the compressible phase volume fraction equation and compressible Pressure equation[46]. A foil of the NACA66 series used by Leroux et al.[25]was used in the present study. The relative maximum thickness of the foil was τ=12% at 45% from the leading edge and the relative maximum camber was 2% at 50%from the leading edge. The foil chord length in the experiments was c=0.15 m and the foil was fixed in the test section with a 0.192 m wide square cross section and 1 m in length. The angle of attack was 6°and the cavitation number is 1.25. The inlet flow velocity was U∞=5.33m/s and the static pressure was adjusted to vary according to the cavitation number, defined as σ=(pout-pv)/(0.5ρlU2). The Reynolds number is Re=U∞c/ν=7.96× 105(cand ν are the foil chord length and kinematic viscosity,respectively). It should be noted that, according to the experiments by Leroux et al.[25], this cavitation condition has distinct cavity behaviors characterized by low Strouhal number, which is supposed to be influenced strongly by cavity cloud collapse emitted shock wave dynamics.
The 3-D fluid domain is shown in Fig. 2(a),which corresponds to the size of the experimental test section in the Ecole Navale Cavitation Tunnel. It should be noted that due to the large computational cost to use the real spanwise size of the experimental hydrofoil, the spanwise width is chosen as 0.3c in the present paper, the same domain treatment as Ji et al.[31]and Sagaut[47]. The computational domain has an extent of about 2c upstream and 6c downstream of the foil to simulate far-field boundary conditions at the inlet and outlet, respectively. A no-slip boundary condition is imposed on the hydrofoil surface, top and bottom tunnel boundaries, and symmetry conditions are imposed on the front and back tunnel boundaries.The non-reflect boundary conditions are used for both the inlet and outlet to avoid the pressure reflection.The inlet turbulence kinematic intensity is set as 0.05 and the inlet turbulence mixing length frequency is 77 200. The calculation mesh is shown in Fig. 2(b),the total grid nodes are approximately 2.5×10⁶with 80 nodes uniformly distributed along the spanwise.Sufficient refinement near the foil surface was generated to control the y-plus below 1. The time step is chosen as 1×10⁻⁵s to control the maximum Courant number (Co) below 0.4. The total simulation time consists of ten complete cavitation cycles, to guarantee the computation convergence, the similar treatment as Chen et al.[48]and Wang et al.[49].
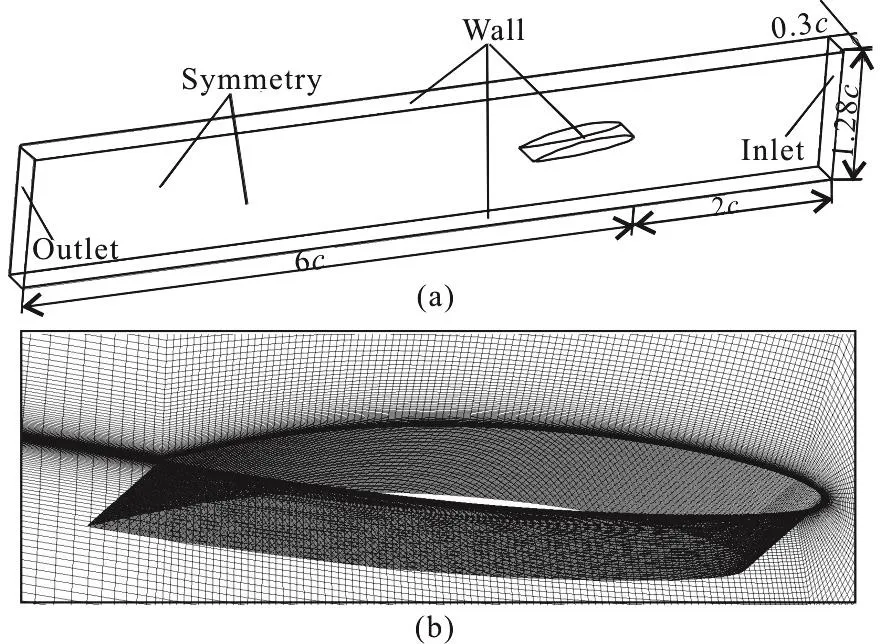
Fig. 2 Computational domain and mesh details
Figure 3 shows the normalized total cavity volume (Vc/Vcmax) evolution during almost ten cavity shedding cycles. The total volume is defined as follows
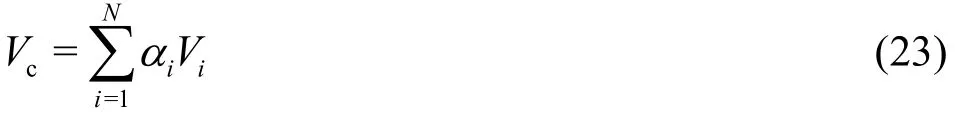
where N is the total number of control volume (cell)in the computational domain,iα is the vapor fraction in each cell and Viis the volume of each cell. It can be found that the periodic cavitation evolution characteristics is well predicted.

Fig. 3 The time evolution of total cavity volume
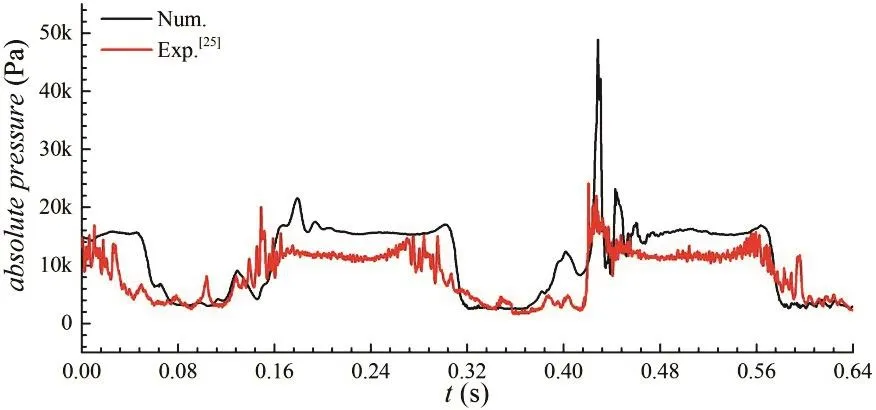
Fig. 4 (Color online)Comparisons of the absolute pressure evolution with the experiments data[25]atx/c=0.7
The comparisons of the absolute pressure evolution between the compressible results and the experiments data[25]at x/ c=0.7 during 0.64 s are shown in Fig. 4. It can be found that the numerically predicted absolute pressure magnitude agrees well with the experiment data[25]. The cavity cloud collapse induced pressure peaks at t=0.4292s is well predicted.
The comparisons of the experimentally measured[25]and numerically predicted cavitation evolution frequency based on both the cavity volume and absolute pressure evolution are shown in Table 2, the relative error of which is also present in the table. The unsteady cavitation frequency characterized by low cavitation evolution frequency is accurately predicted.
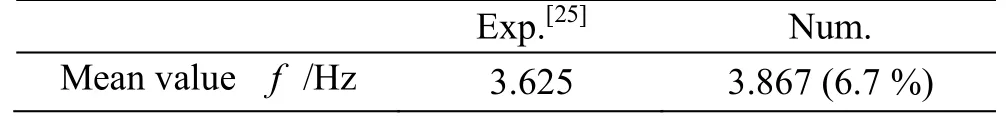
Table 2 Comparisons of the experimentally measured[25]and numerically predicted cavity evolution frequency with the relative error presented.
The comparisons between the predicted vapor fraction contours (right, compressible simulation results) and the experimentally observed unsteady cavitation behaviors (left, Ref. [25]), accompanied by the predicted absolute pressure on foil surface and side symmetry plane, in a typical cavitation cycle, are shown in Fig. 5. It can be found that numerically predicted cavitation evolution can well predict the quasi-periodic behaviors observed by experiments[25],and the cavity cloud collapse induced shock wave and propagation process, during which the newly cavity sheet shorten phenomena has already experimentally observed by Leroux et al.[25], was well predicted. The typical attached cavity formation and growth (a1-a3, a8,b1-b3, b8), attached cavity sheet breakup (a4, b4),residual cavity sheet rolling up and shedding process(a5, a6, b5, b6), U-shaped cavity cloud collapse and newly attached cavity sheet shorten process (a7, b7),are all captured. According to the predicted absolute pressure contour, it can be concluded that attached cavity sheet shorten process is caused by the cavity cloud collapse induced shock wave propagation phenomena, which is highly related to the compressibility characteristics within cavitation region. It is supposed that the shock wave emission and interaction with the cavitating flows is the key for the cavity cycle delay and thus the reduction in cavity evolution frequency.It also indicated that the simulation considering the compressibility effects of both water and vapor will shed light on the cavitation instabilities, in particular the shock wave propagation mechanism involved,which has not been fully understood. In the following,more detailed study on thecavitation instabilities involved in the complex compressible turbulent cavitating flows accompanied by re-entrant jet and shock wave is presented.

Fig. 5 (Color online) Comparisons of experimentally observed cavitation behaviors (left, Ref. [25]) with numerical predicted vapor fraction isosurface contours and absolute pressure contour on the foil surface and the side plane

Fig. 6 (Color online) Top view observations of sheet/cloud cavity evolution and absolute pressure evolution on foil surface during approximately one-and-a-half typical cycles
3. Results and discussion
3.1 Unsteady cavity behaviors
Figure 6 shows the top view of numerically predicted unsteady sheet/cloud cavitation behaviors with the absolute pressure distribution on foil surface and symmetry plane during approximately one-and-ahalf cycles. The cavitation cycle is estimated to be about Tref=258.6 ms according to the numerical unsteady behaviors observations. The numerical Strouhal number St( St=fc/ U), based on the foil chord length c and the inlet velocity U is 0.109. The flow direction is from right to left indicated by the red arrow. The leading edge (LE) and trailing edge (TE)of the foil are labeled. The black declined line indicates the growth of the attached sheet, and the red declined line indicates the shedding of cavity cloud.The red dashed circle shows the re-entrant flow induced attached cavity sheet breakup process. The black dashed line in Fig. 6 indicate the shock wave propagation process which is also marked by the dashed red square frame.

Fig. 7 (Color online) Cavity behaviors observations (αv=0.15) and absolute pressure evolution in the process of cavity cloud collapse and shock wave propagation
As shown in Fig. 6, the cavitation sheet presents quasi-periodic behavior. The cycle can be depicted as following four stages as labeled in numbers: (1) the growth of the attached cavity sheet (t0-t0+9/19Trefand t0+Tref-t0+29/19Tref), (2) development of reentrant flow and attached cavity sheet breakup(t0+9/19Tref-t0+10/19Tref), (3) attached cavity sheet rolling up and cavity cloud shedding (t0+10/19Treft0+14/19Tref), and (4) cavity cloud collapse induced shock wave propagation stage (t0+14/19Tref-t0+Tref).It should be noted that the re-entrant flow develops when the attached cavity reaches certain length(approximately half the chord), and during the re-entrant flow develops, the attached cavity sheet continually grows to its maximum length until the attached cavity breakup near foil leading edge. In the first stage, an attached cavity sheet begins to form near the foil leading edge (LE). The stable attached cavity sheet continually grows as shown by the declined black line. According to the absolute pres-sure contour, it can be found that the wall pressure under the attached cavity is vapor pressure with low values and that outside the attached cavity is water pressure with high value. Due to the unsteady characteristic at the rear of the attached cavity, a relative high pressure value exists there. In the second stage,when the attached cavity sheet reaches certain length,the re-entrant flow which consists of large density fluids develops at the rear of the attached cavity sheet,moving towards the leading edge. The cavity interface becomes wavy and bubbly as indicated by the red dashed circle in the second stage. In the third stage, as shown by the declined red line, when the re-entrant flow arrives at the foil leading edge, it will cut off the attached cavity sheet, causing the attached cavity sheet broken up. Under the convection of the main flow, the broken cavity sheet is rolled up and shed downstream. The shedding cavity cloud is out of the foil surface, continually moves downstream, with the newly cavity sheet initially growing. In the fourth stage, when the shedding cavity cloud is transported into the high pressure region, it will collapse and cause a shock wave, propagating both downstream and upstream. The shock wave propagating upstream will cause the newly generated cavity sheet shorten as seen between t0+15/19Tref-t0+16/19Trefand finally disappear, indicating the inhabitation effects of shock wave on new cavity sheet growth, and thus the cavitation evolution cycle. Following, the shock wave rebound process will further depress the new cycle beginning and more details on the shock wave propagation process will be discussed in the following.

Fig. 8 (Color online) Transient cavity shape, turbulent kinetic energy and turbulence eddy dissipation on the foil mid-plane before and after shock wave
Figure 7 presents the cavity behavior and pressure evolution on foil surface and side symmetry plane in the process of cavity cloud collapse induced shock wave propagation and rebound (t0+0.762Tref-t0+0.955Tref). The pressure wave propagating from trailing edge to leading edge are marked by the dashed square frame. It can be observed that after the large scale cavity cloud collapses, shock wave is emitted and propagates in the flow field. The propagation shock will increase the local pressure and make the attached cavity sheet collapse. Following, two rebound processes are captured as indicated by the dashed red square frame with the magnitude of pressure attenuation. The strength of the shock wave is weaken due to the energy dissipation, and pressure in the third rebound cannot even collapse the new attached cavity. It can be concluded that the cavity cloud collapse induced shock wave propagation and rebound delay the new attached cavity growth,resulting in the cavitation evolution frequency reduction.
Figure 8 shows the instantaneous void fraction,turbulent kinetic energy (k) and turbulence eddy dissipation (ε=Cμk3/2/l )distribution on the midplane at the instances of t0+0.777Tref(before shock wave), t0+0.792Tref(cavity sheet being shorten),t0+0.806Tref(fully collapse) and t0+0.821Tref(after shock wave). It can be observed that the shock wave propagation process will cause the turbulence kinetic and turbulence eddy dissipation change.Before shock wave, the newly attached cavity sheet attaches near the foil leading edge, high value of turbulence kinetic energy and turbulence eddy dissipation exist at around x/ c=0.25 on the foil lifting surface. During the shock wave propagation and the attached cavity sheet fully collapse processes, the attached cavity sheet is shorten towards the leading edge. High value of k and ε extents towards the foil trailing edge. After the shock wave, the newly attached cavity sheet begins to form and separated bubble can be found at the foil leading edge as indicated by the white arrows.
Figure 9 presents the four typical instances of the instantaneous vapor fraction and synchronous transient mass transfer rate distribution during four cavitation stages, respectively. It can be found that abrupt mass transfer exists in the cavitation region,and the mass transfer mainly takes place in the relative low vapor fraction region around the cavity/liquid interface and the cavity leading edge. During the attached cavity development stage at t0+0.311Tref,the condensation from vapor to liquid takes at the cavity/liquid interface and the rear of the attahced cavity sheet, and the mass transfer shows the negative value, the condensation of which is supposed to be caused by the high pressure outside the cavity region.During the re-entrant flow movement stage at t0+0.571Tref, negative value of mass transfer takes place at the front part of the attached cavity sheetand the interface between the cloud cavity and liquid,where the condensation is thought to be mainly caused by the re-entrant flow passing. The positive value of mass transfer is obtained under the attached cavity sheet, which is due to the vapor content entrained by the re-entrant flow. During the cavity cloud shedding process at t0+0.701Tref, negative value of mass transfer is in the cavity cloud region with local positive value, indicating the vapor collaspe. It can be also concluded that the cloud cavity collapse begins at the outer side of the cloud cavity. During the shock wave propagation stage at t0+0.878Tref, due to the high pressure after the shock wave propagation,attached cavity sheet are collapsed and negative mass transfer rate is found at the foil leading edge where the attached cavity sheet is collapsed.
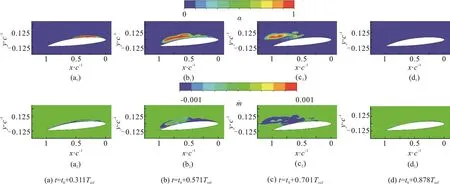
Fig. 9 (Color online) Four typical instances of the transient vapor fraction contour and mass transfer term distribution in the four stages
3.2 Unsteady pressure fluctuations induced by the transient sheet/cloud cavity behaviors
To investigate the pressure fluctuations induced by the unsteady sheet/cloud cavity behaviors, especially in the alternate processes of re-entrant flow induced attached cavity breakup and shedding and the cavity cloud collapse induced shock wave propagation and rebound, comparisons between the experimental[25](red line) and numerical (black line) absolute pressure fluctuations over approximately two cavitation cycles at selected positions on foil surface from x/ c=0.1-0.9, with 0.1c interval, are presented in Fig. 10. The declining dashed black line indicates the growth of the attached cavity sheet and the declining red dashed line indicates the shedding of the cavity cloud. The cavity cloud collapse induced shock wave is marked by the red declining arrow line. The newly generation cavity sheet induced low pressure region is identified by the black vertical arrow line. According to the cavitation behaviors observed in Fig. 6, it can be found that the pressure fluctuates with the cavity evolution and presents quasi-periodic behaviors. The pressure spectral contents at x/ c=0.1, 0.2, 0.3, 0.4,0.5, 0.6, 0.7, 0.8 and 0.9 are shown in Fig. 11. The comparisons show good agreement between the numerically predicted results and the experiment data[25]. However, it should be noted that some differences in pressure evolution exist between the experi-ment[25]and numerical results for 0.08<t<0.16 and the pressure spectral content at x/ c=0.1. The reason for the deviation is that the foil suction side is covered by the unsteady cavity and thus the pressure fluctuations are highly influenced by the transient cavity behaviors, and the accurate prediction of cavitation induced pressure fluctuation in the foil leading edge and the cavity sheet rear part is difficult. The detailed description of the pressure signals in one typical cavity cycle is presented between t0and t0+Trefas shown in Fig. 10.
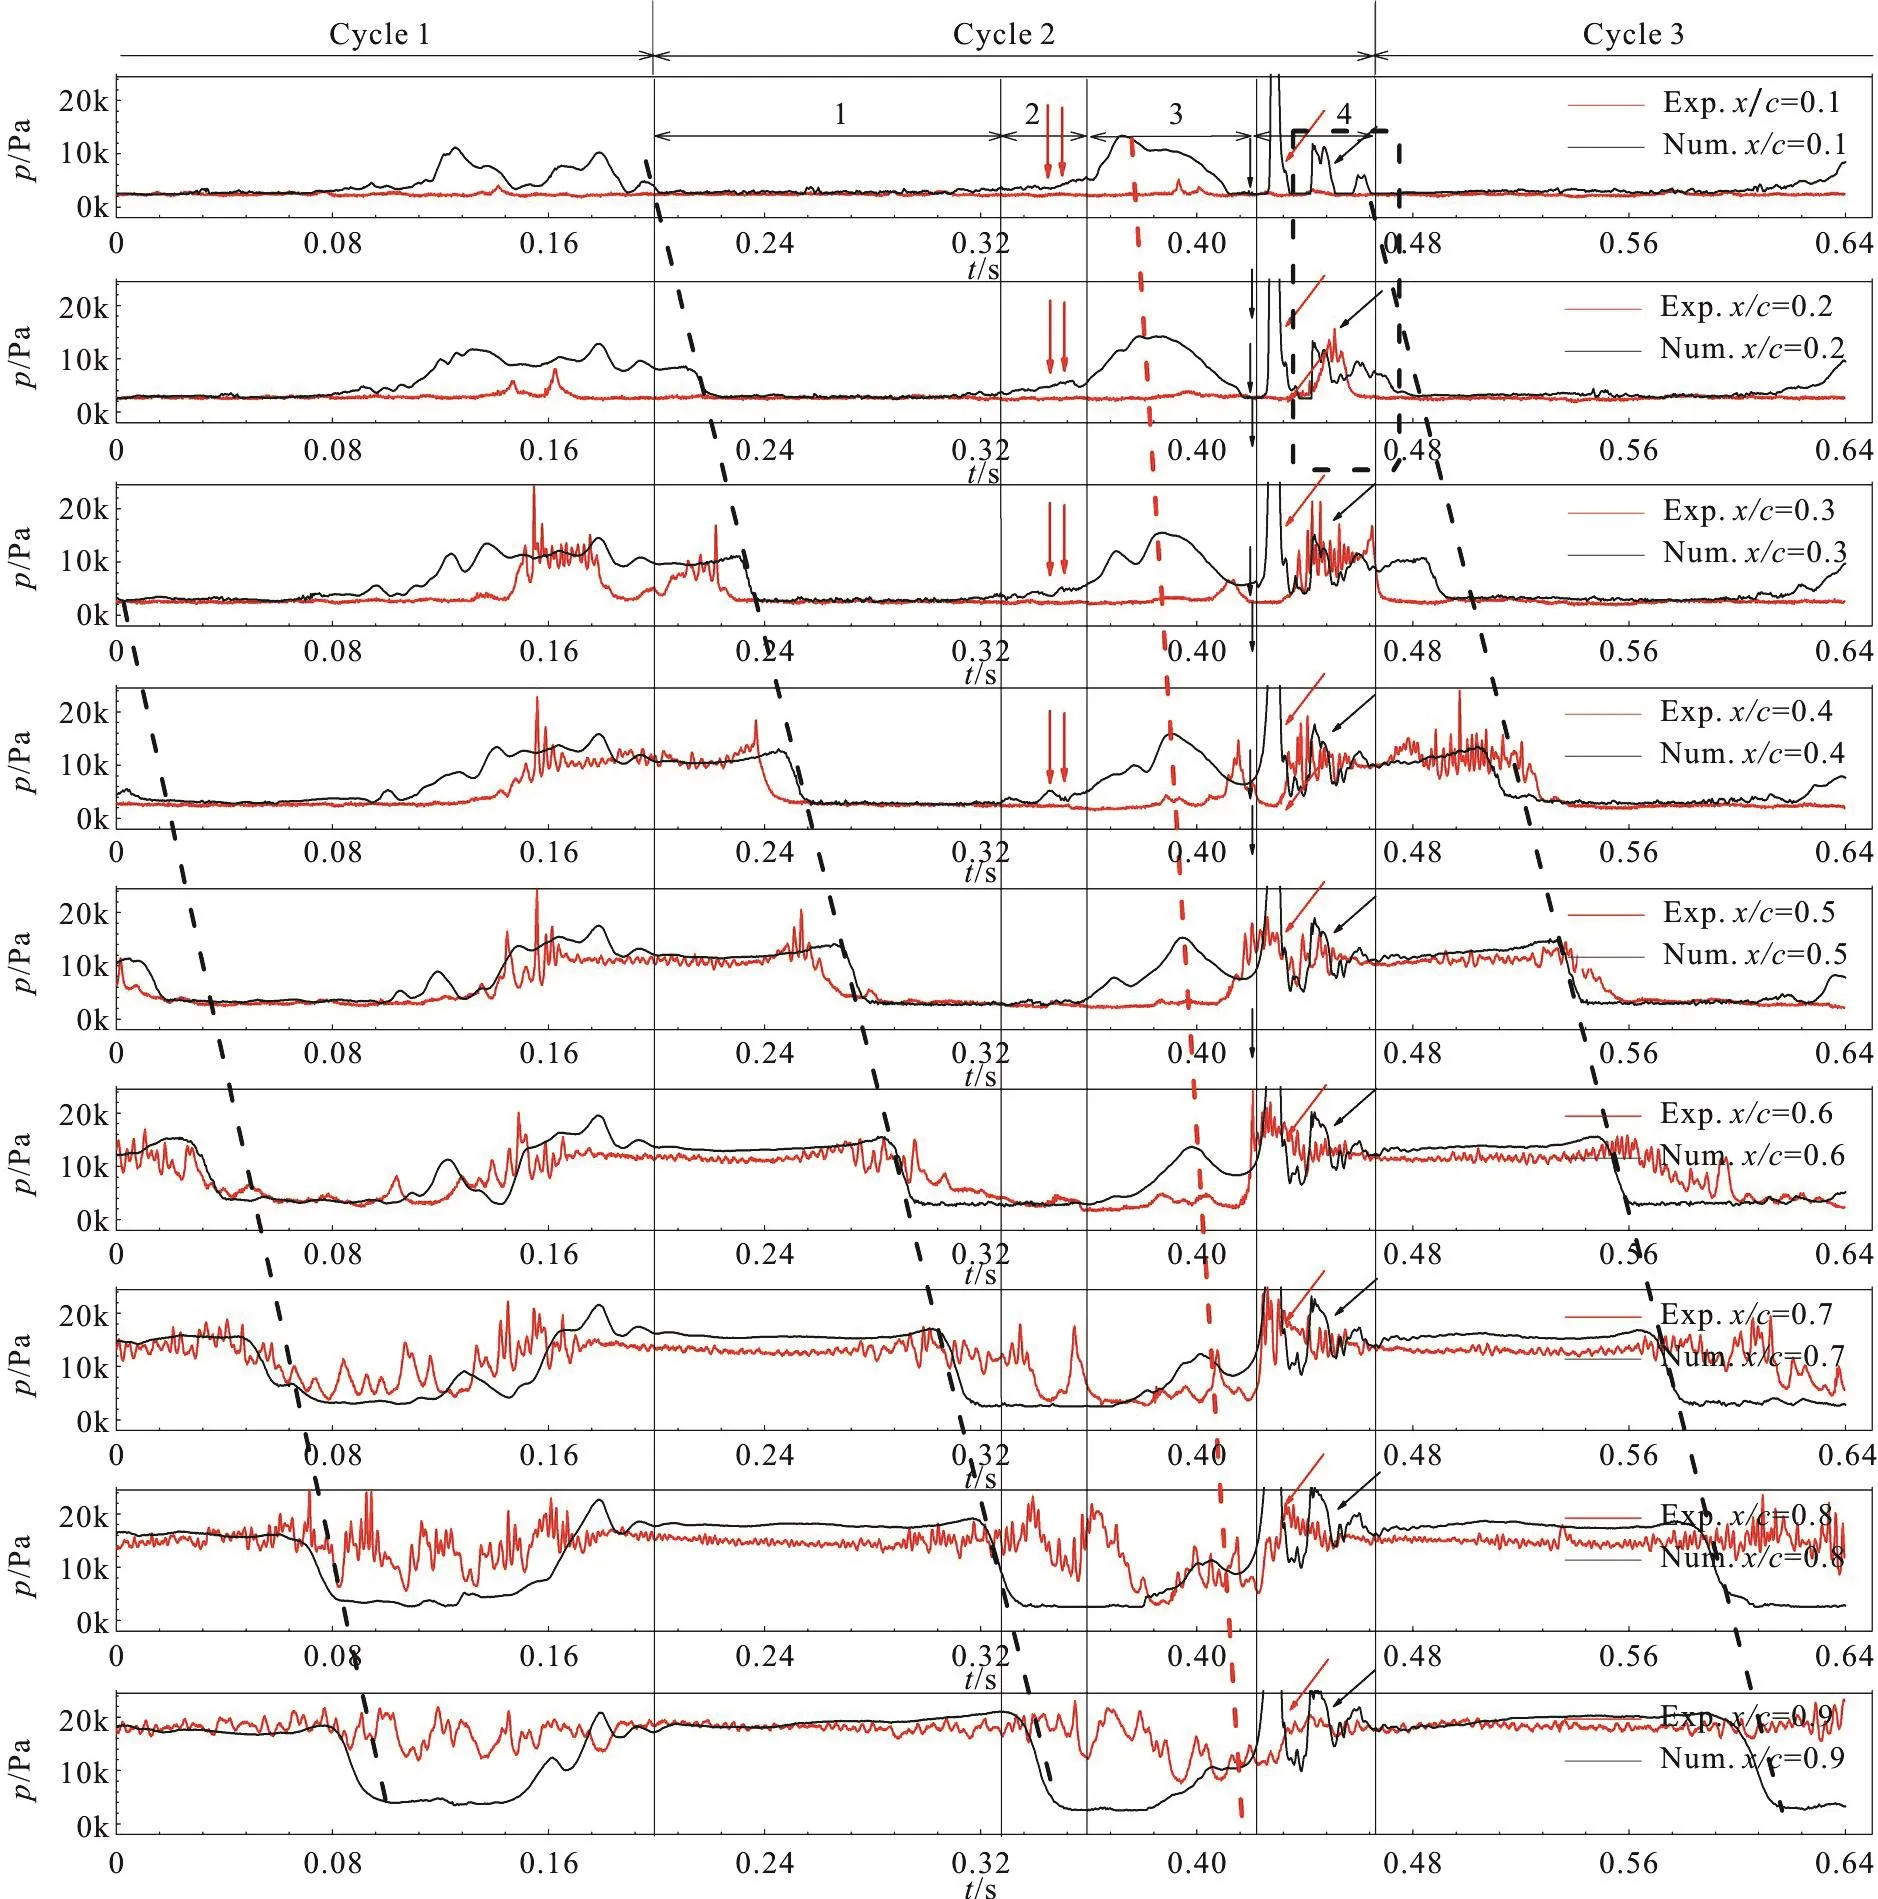
Fig. 10 (Color online) Instaneous pressure signals at x/ c=0.1-0.9 during approximately two cavity growth/destabilization cycles. (The red line indicates the experiment pressure signals[25] and the black line the numerical pressure signals)
During the stage 1, at t=t0, the attached cavity sheet grows to x/ c=0.3, the pressure on the positions x/ c=0.1, 0.2 and 0.3 exists vapor pressure with low value, while others exposed to water pressure with high value. With the development of the attached cavity,vapor pressure exists one-after-another on different monitor positions as illustrated by the dashed black lines. In the stage 2, when the re-entrant flow develops to the foil leading edge, it will break up the attached cavity sheet, causing relatively small pressure fluctuations at the leading edge, as shown by the red double vertical arrows in Fig. 10. In the third stage,with the broken attached sheet being rolled up and transported downstream, foil surface is exposed to water, one-after-another, and high pressure value exists one-after-another from the leading edge to trailing edge, as indicated by the declining red dashed line in Fig. 10. When the shed cavity cloud is out of the foil surface as observed in Fig. 6 and continually being transported downstream, the newly cavity sheet begins to form near the throat. A low pressure as indicated by the black vertical arrows exists at monitor positions x/ c=0.1, 0.2 and 0.3, which is supposed to be induced by the newly cavity sheet growth. In the fourth stage, when the shed cavity cloud collapses in the high pressure region, a shock wave is emitted, propagating towards both downstream and upstream. During the propagation of the shock wave, a pressure peak exists one-after-another on monitor positions from the trailing edge to the leading edge. When the shock wave arrives at the newly thin cavity sheet, it will cause the cavity sheet collapse sharply. After the shock wave propagates away, the attached cavity sheet begins to grow again near the throat, and the vapor pressure are monitored by the positions x/ c=0.1, 0.2 as shown in Fig. 10.After that, the shock wave rebounds as and propagates again upstream, causing the newly sheet collapse. It can be found the alternate vapor pressure and water pressure as indicated by the dashed black square frame in Fig. 10 exist on monitors near the leading edge as indicated by the declining black arrows in Fig.10.

Fig. 11 (Color online) Comparisons between the numerically predicted and experiment measured[25] pressure spectral contents(power spectral density (PSD)) at x/ c=0.1, 0.2, 0.3, 0.4, 0.5, 0.6, 0.7, 0.8 and 0.9 on the foil suction side
To better illustrate the unsteady mass transfer characteristics accompanying with the transient cavity behaviors, the total vapor volume based on the numerical results during approximately two cavity cycles is shown in Fig. 12. The four typical cavitation stages are identified.

Fig. 12 Time evolution of normalized total cavity volume and cavity volume change rates and after shock wave
As illustrated in Fig. 12, both the normalized cavity volume (Vc/Vcmax) and cavity volume rates evolution prese nt typica l peri odic behavio rs, with the transientmasstransfertermdistributionatfourinstances. During the attached cavity development in stage 1, the cavity volume increases, with the cavity volume rate (dVc/dt) increases, and the cavity volume acceleration rate (dVc2/dt2) keep almost constant. During the re-entrant flow development and attached cavity sheet breakup process in stage 2, when the re-entrant flow exists, the cavity volume rate appears small fluctuations as marked by the black dashed square, indicating that re-entrant flow development has little effects on mass transfer process.Before the cavity volume grows to its maximum value,there exists a large and sharp decrease in both dVc/dt and dVc2/dt2to zero at the maximum cavity volume instant. After that, both cavity volume and cavity volume rates continually decrease. During the attached cavity rolling up and cavity cloud shedding process in stage 3, the cavity volume and volume rate evolution can be depicted into three steps as indicated by the three vertical black arrows respectively, namely (1) cavity cloud shedding on the foil, (2) cavity cloud being transported near the trailing edge, and (3) cavity cloud being transported downstream foil. In the first step, cavity volume decreases sharply, with the dVc/dt drops below zero and decrease continually. In the second steps, with the newly cavity sheet growing, the cavity volume slightly increases, and the dVc/dt and dV22c/dt increase. In the third step, when the cavity cloud being transported into high pressure region downstream the foil, the cavity volume decrease sharply, with both the dVc/dt and dVc2/dt2decreases sharply. It can be observed that the decreasing rate is faster than that in the first step. During the cavity cloud collapse and shock wave propagation in stage 4, cavity volume decreases to reach its minimum value firstly and following an increase and decrease exist due to attached cavity sheet growth and collapse by the shock wave rebound. Sharp fluctuations in both cavity volume and cavity volume rates can be observed.During the shock wave propagation and rebound process, gradually weaker cavity volume rates fluctuations are observed until the energy of collapse attenuates and the next cavitation cycle begins as indicated by the declined arrows. The large fluctuations in cavity volume rate indicates huge unsteady mass transfer between fluids. The mass transfer process during one typical cavity cycle illustrates that the shock wave propagation and rebound is supposed to be the major origin of cavitation instabilities, which agrees with the experimental observations by Leroux et al.[25]and Reisman et al.[24].
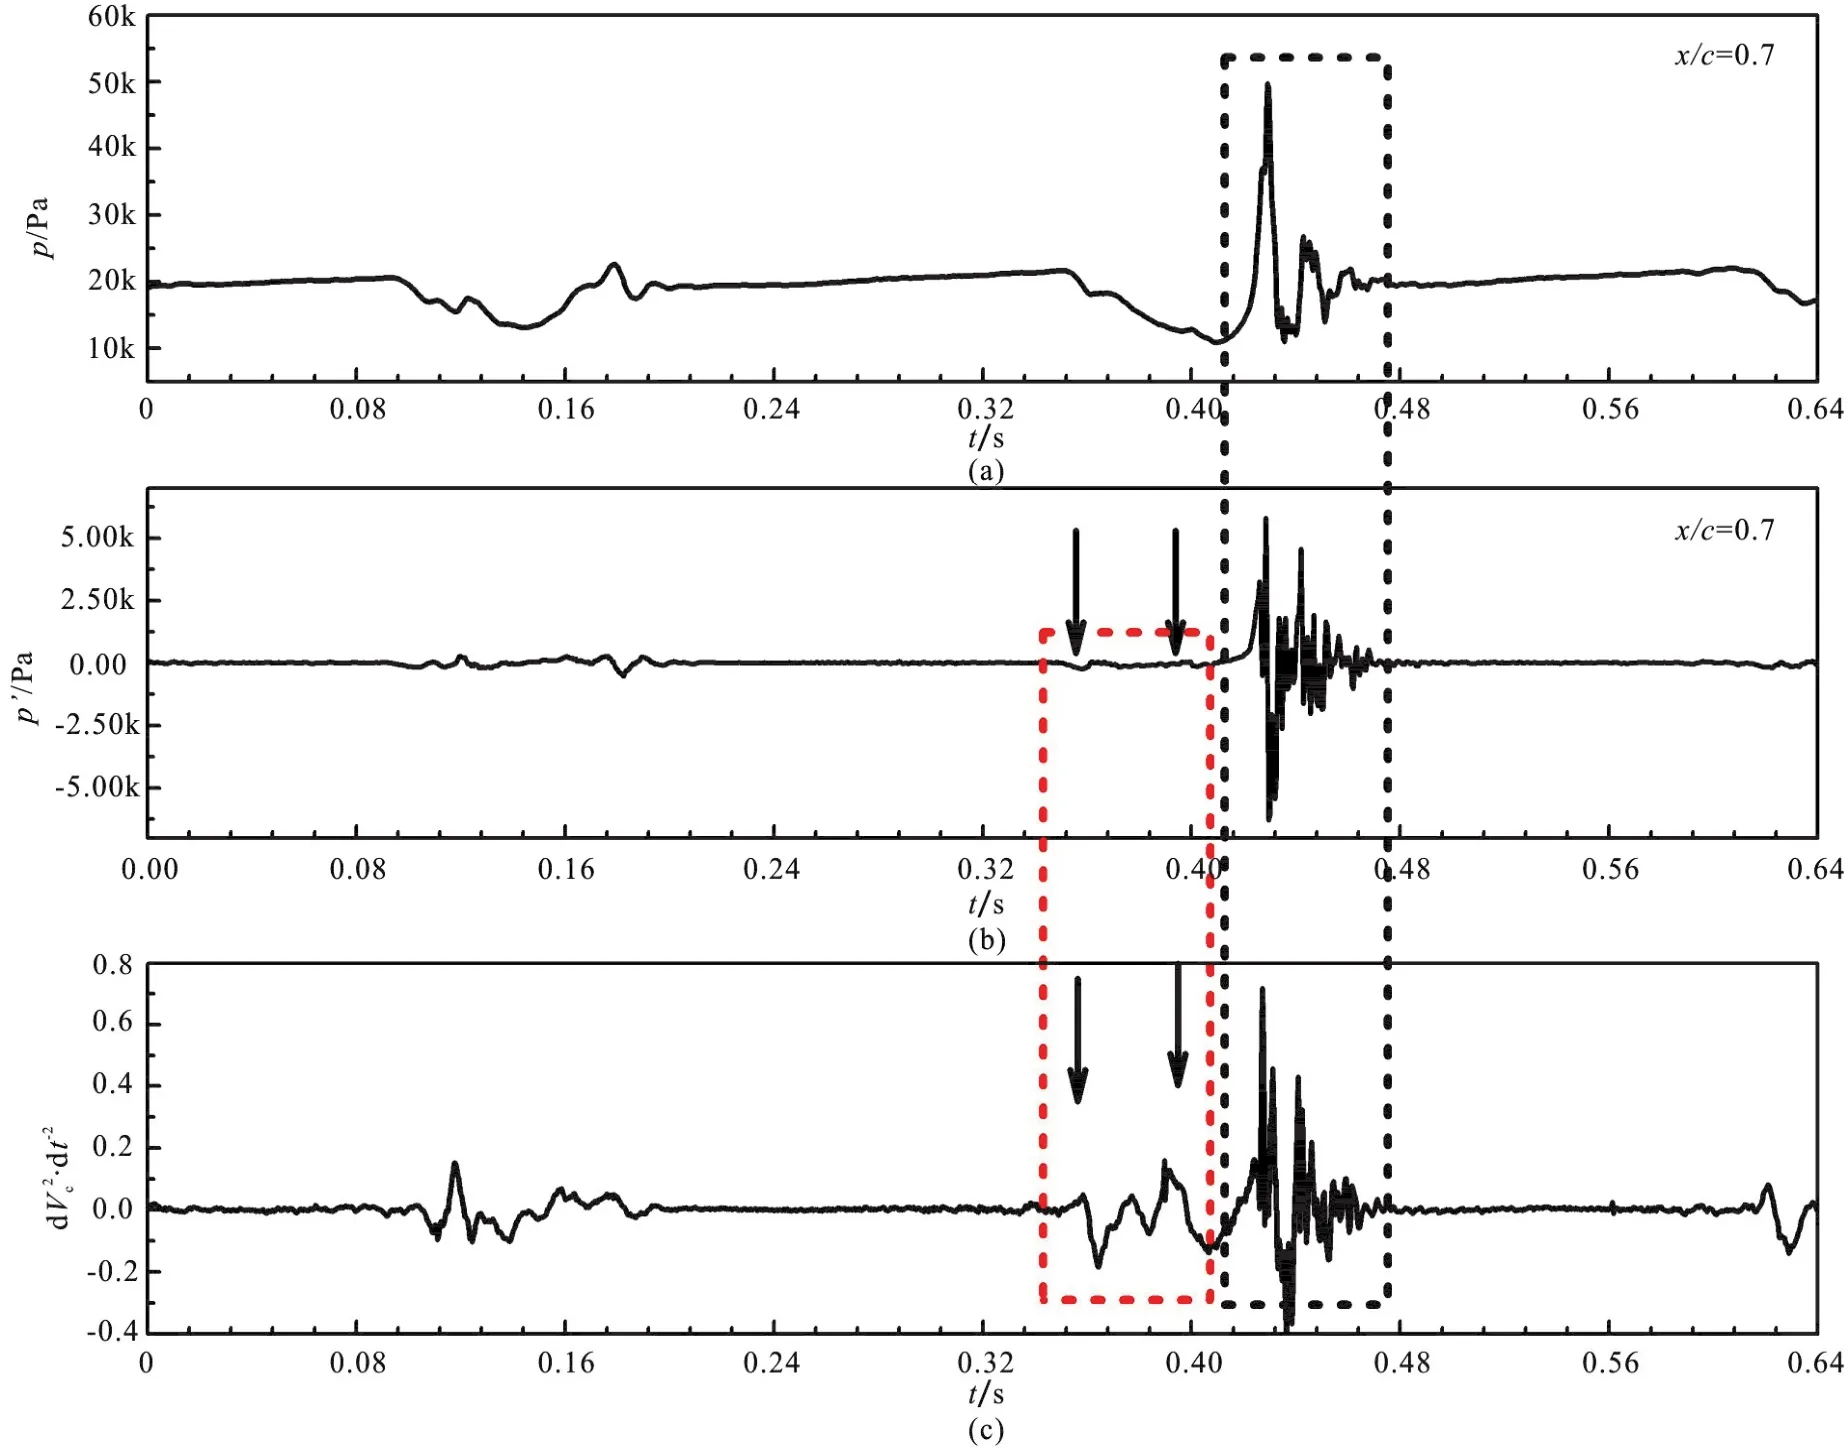
Fig. 13 (Color online) Relationship between the cavity volume and the absolute pressure, pressure fluctuations in the cavity shedding at x/ c=0.7 from the leading edge of the hydrofoil pressure side
Figure 13 shows the relationship between the cavity volume acceleration ratewith the absolute pressure and pressure fluctuations at x/ c=0.7 on the foil preside side, which reflects the far-field characteristics, to illustrate the pressure fluctuations characteristics. It can be observed according to the absolute pressure curve that the absolute pressure evolution is highly related to the unsteady cavity volume behaviors. During the cavity cloud shedding and collapse stage, relative low absolute pressure exist on the foil pressure side. During the shock wave formation and propagation stage, huge fluctuations in absolute pressure are captured,indicating that the shock wave will cause abrupt pressure change in the flow field. The absolute pressure fluctuations analysis illustrated that the pressure fluctuations is in phase with the cavity volume evolution as indicated by the black arrows. During the attached cavity breakup, and shedding process,relative large pressure fluctuations appears, and it can be indicated that the pressure fluctuations is highly related with the cavity volute rateas indicated by the dashed grey square. During cavity cloud collapse and the shock wave generation and propagation process, abrupt pressure fluctuations characterized by relative large magnitude and high frequency are observed as indicated by the dashed black square. This kind of pressure fluctuations are caused by the abrupt change of cavity volume. It can be concluded that cavity volume acceleration rateis one of the major source of pressure fluctuations, except for the cavity interface motion.
4. Conclusions
Numerical results based on open source software OpenFOAM are presented for a NACA66 hydrofoil fixed at the angle of attack of α=6° at σ=1.25,U∞=5.33m/s, Re=7.96× 10⁵. In the numerical simulations, the compressible cavitation governing equations, including mass, momentum and energy equations are solved, with the Tait equation of state for water and ideal gas equation of state for vapor to consider the compressibility effects of both water and vapor. The Saito cavitation model and SST SAS turbulence model is employed to solve the unsteady compressible turbulent cavitating flows. The unsteady hydrofoil cavitating flows accompanying with the re-entrant flow and cloud cavity collapse induced shock wave formation and propagation phenomena is well simulated and compared with the experiments.The main findings include:
(1) The numerically predicted unsteady sheet/cloud cavitation behaviors considering the compressibility effects of both water and vapor agrees well with the experimental results in cavity evolution frequency.A typical quasi-periodic sheet/cloud cavitation development process can be depicted into four stages: (1)the growth of the attached cavity sheet, (2) development of re-entrant flow and attached cavity sheet breakup, (3) attached cavity sheet rolling up and cavity cloud shedding, and (4) cavity cloud collapse and shock wave propagation. The shock wave is emitted in the fourth stage when the cloud cavity is transported into the high pressure region downstream.The cavity cloud collapse induced shock wave phenomena delays the new attached cavity growth,and is responsible for the cavitation cycle increase.The shock wave rebound phenomena will further inhibit the new attached cavity growth. After the shock wave, separated bubble can be found at the foil leading edge.
(2) During the re-entrant flow development process, pressure evolution on the foil surface is relatively smooth. During the shock wave propagation process, pressure peaks in microseconds appears one-after-another from the trailing edge to the leading edge, causing the attached cavity sheet being collapsed. When the shock wave propagates to the throat, the collapse of the newly cavity sheet will cause another shock wave propagation event. During the shock wave rebound process, the magnitude of pressure peaks attenuates.
(3) The cavity volume evolution which indicates the total mass transfer process during a typical cavity cycle shows that the total mass transfer during the shock wave propagation and rebound process is much more violent than that during the re-entrant flow development process, indicating that shock wave has a significant effect on the mass transfer process. The shock wave is supposed to be the major origin of cavitation instabilities.
5. Discussions and future work
Wave dynamics in cavitating flows is a challenging and serious issue, associating with the complex multiphase flow phenomena, such as compressibility,phase change and turbulence. The shock wave dynamics provide a new perspective on the understanding of cavitation instabilities, including pressure fluctuations, vibrations, noise and shedding mechanisms. Further investigation is still necessary for the understanding of wave dynamics in cavitation, using both the experimental and numerical methods.
Cavitating flow in hydrodynamics consists of phase change, compressibility, multiphase and turbulence. In cavitating flows, the flow field is characterized by low Mach number outside the cavitation region in the bulk water flow, where the sound speed is about 1 450 m/s, and high Mach number in cavitation region, where the sound speed drops to 0-10 m/s. Shock wave in cavitating flow has different patterns, including the bubbly shock wave, the cavity cluster collapse induced shock wave and water hammer like shock wave. As for the bubbly shock wave, it is closely related to the low sound speed in vapor/water mixture. The low sound speed value makes it possible for cavitating flow to reach sonic and supersonic flow even when the bulk liquid flow is at very low Mach number, providing the possibility of the shock wave formation. Bubbly shock wave in vapor/water mixture is characterized by void fraction differences across the shock wave front as observed by Ganesh et al.[26]using X-ray densitometry. The cavity cluster collapse induced shock wave is associated with the abrupt mass transfer between water and vapor, which is another feature of cavitating flows. The abrupt collapse of cavity cluster will release huge energy stored in the cavity, during which strong shock wave emission is possible. This kind of shock wave is successfully simulated in the present work by considering the compressibility effects of both water and vapor. The water hammer like shock wave is caused by the sharp inhomogeneous sound speed distribution in the cavitating flows. Considering the wide range variation of sound speed (~1450 for water and 0-10 m/s for water/vapor mixture) in and outside the cavitation region, the shock wave propagation speed in the field must experience an abrupt stop when the shock wave impinges on the attached cavity, causing the water hammer like shock wave in attached cavity sheet. In the future, the differences in morphology and physics of different shock wave patterns involved in the cavitating flows in hydrodynamics and that in high speed aerodynamics are necessary to be further investigated. The detailed observation and measurement of the bubbly shock, the cloud cavity collapse induced shock wave and water hammer like shock wave requires new experiment and numerical methods, such as X-ray densitometer and endoscope technique in experiment and the cavitation computation method should consider the compressibility of water and vapor. The shock wave dynamics of the cavitation instabilities need be further investigated. The bubbly shock is supposed to be the most common shock wave phenomena in multiphase flow[50], however, the bubbly shock in cavitating flows is rarely observed and studied owing to the high speed complex multiphase flow features and requires further research. The detailed investigation of shock wave is expected to further promote cavitation dynamics.
Cloud cavitation is supposed to be the most destructive form of cavitation and the mechanism of cloud cavitation is still unsolved. Experiment has identified two cavity shedding mechanism, namely re-entrant flow mechanism and shock wave mechanism. The re-entrant flow mechanism has been fully investigated and understood, while research on shock wave mechanism is not enough. The study of shock wave characteristics such as, the formation, propagation, the parameters across the shock wave front and the interaction between the shock wave and cavity will promote the cavitation dynamics understanding.The relationship between the shock wave dynamics and cavitation erosion will have significant engineering applications and needs long-term efforts contributed by academic people and industries.
Besides, cavitation noise is one of the main concerns in marine propeller and attracts very much attention. The mechanism of cavitation noise is still an open problem. Many research has been conducted on the cavitation noise related to the single bubble collapse dynamics in cavitating flows. However, the cavitation noise associated with the shock wave dynamics induced by large scale cavity cluster collapse which is much more energetic than single bubble, or bubbly water/vapor mixture characteristics such as high Mach number, is rarely understood. The shock wave dynamics induced noise is supposed to be stronger and should be further investigated. Further,considering the low sound speed and high compressibility in vapor/water mixture, which makes the shock wave dynamics more complex, the coupling between the cavitation noise and compressibility is necessary to be studied.
Owing to the high pressure fluctuations in the shock wave dynamics, which will induce large vibrations and noise, the control of shock wave in cavitating flow has practical significance in the engineering application and need be further studied.The experiment by Ganesh et al.[26]shows that the obstacle placed on the path of the bubbly shock propagation is not sufficient for the bubbly shock suppression and the non-condensation air injection[28]can significantly reduce the shock wave formation and propagation. Based on the physics involved in shock wave dynamics, more effective control methods are necessary to be developed.
Acknowledgements
This work was supported by the Open Foundation of State Key Laboratory of Ocean Engineering,Shanghai Jiao Tong University, the Graduate Technological Innovation Project of Beijing Institute of Technology (Grant No. 2017CX10017).
猜你喜欢
青少年科技博览(中学版)(2022年11期)2023-01-07
绿色天府(2022年7期)2022-08-16
思维与智慧·上半月(2022年4期)2022-04-08
阅读与作文(小学高年级版)(2021年9期)2021-09-09
趣味(语文)(2020年5期)2020-11-16
小学生(看图说画)(2020年10期)2020-10-29
大众投资指南(2020年10期)2020-07-24
红领巾·萌芽(2020年2期)2020-05-07
NBA特刊(2018年21期)2018-11-24
好孩子画报(2018年2期)2018-04-14

- 水动力学研究与进展 B辑的其它文章
- Call For Papers The 3rd International Symposium of Cavitation and Multiphase Flow(ISCM 2019)
- A well-balanced positivity preserving two-dimensional shallow flow model with wetting and drying fronts over irregular topography *
- Determination of epsilon for Omega vortex identification method *
- Transient curvilinear-coordinate based fully nonlinear model for wave propagation and interactions with curved boundaries *
- Tracer advection in a pair of adjacent side-wall cavities, and in a rectangular channel containing two groynes in series *
- On the nonlinear transformation of breaking and non-breaking waves induced by a weakly submerged shelf *