
Identification of prognostic markers by integrating the genome and transcri ptomics in ovarian cancer
2019-11-01 03:01XinWuDongXinTangXiaNanSangKuiLongWangMinHaoGangCao
TMR Modern Herbal Medicine 2019年4期
Xin Wu, Dong-Xin Tang,Xia-Nan Sang,Kui-Long Wang,Min Hao,Gang Cao*
1College of Pharmaceutical Sciences,Zhejiang Chinese Medical University,Hangzhou,Zhejiang,China.
2First Affiliated Hospital of Guiyang College of Traditional Chinese Medicine,Guiyang,Guizhou,China.
Abstract
Keywords:Ovarian cancer,TCGA,GEO,5-gene signature,Prognostic marker
Background
Ovarian cancer is one of the common malignant tumors that seriously threaten the physical and mental health of women.Early ovarian cancer is so hidden that patients often do not have obvious symptoms or signs.Most patients are already at an advanced stage of cancer when they find themselves have ovarian cancer.In recent years,there has been no substantial reduction in the incidence and mortality of ovarian cancer[1].Therefore,the early diagnosis and treatment of ovarian cancer has become a topic of widespread concern.At present,the first-line treatment of ovarian cancer is tumor cell reduction and platinum-based chemotherapy[2].Although most patients are sensitive to the initial treatment,more than 60%of the patients still have tumor recurrence,metastasis and eventually die of ovarian cancer after the initial treatment[3].In order to improve the prognosis of ovarian cancer,a growing number of researchers shift their research focus to molecular biomarkers,such as genetic mutations and immune checkpoints,expecting to achieve early detection and treatment of ovarian cancer[4,5].
In recent years,researchers have conducted many studies related to ovarian cancer biomarkers by using mass spectrometry and other techniques,and have found a large number of biomarkers[6].For example,CA125 is a conventional serum marker for ovarian cancer,but its specificity is limited.It is commonly used to monitor treatment responses and detect disease recurrence[7].Pratet al[8]evaluated the prognostic effect of the lowest value of CA125 within the reference range(<35U/ml).After initial treatment,the absolute value of CA125 increase≥5U/ml,which is a strong predictive indicator of ovarian cancer recurrence.Human epididymis 4(HE4)is also one of the common biomarkers of ovarian cancer.A study by Anastasiet al[9]shows that in patients with ovarian cancerrecurrence,the expression of HE4 increases in 5 to 8 months before CA125,suggesting that HE4 could be a good early marker for monitoring ovarian cancer recurrence.Kuket al[10]first reported in 2010 that Nidogen-2 was a new serum biomarker for ovarian cancer that can be used for early diagnosis.They studied 100 patients with ovarian cancer,100 patients with benign gynecological diseases and 100 healthy control samples.The results show that the average levels of serum Nidogen-2 in normal control group and benign gynecological disease group are 13.2mg/L and 12.1 mg/L,respectively.There was no significant difference between the two groups.However,the average concentration of serum Nidogen-2 in patients with ovarian cancer was 18.6 mg/L,which was significantly different from that in normal control group or benign gynecological disease group(P<0.001).In all samples,CA125 and Nidogen-2 concentrations were found to be closely related(p<0.001).This suggested that serum Nidogen-2 may be a new serum marker of ovarian cancer.
Although hundreds of biomarkers have been found to be associated with ovarian cancer,the challenges for early diagnosis of ovarian cancer remain due to the limited sensitivity and specificity ofsingleovarian cancer markers.Their use in early diagnosis has not yet been determined [11].High throughput multi-omics sequencing data has laid a solid foundation for the identification of genes related to cancer prognosis.Multi-omics data analysis can reveal the mechanism of cancer occurrence and development from many aspects[12,13].Based on genomics data of GEO database,Li,Zhi[14]found that four gene signatures were closely related to the drug sensitivity of paclitaxel in the treatment of breast cancer through logistic regression,cox regression and correlation analysis with bootstrapping.In short,it is pretty important to integrate multi-omics data in bioinformatics to identify the gene signature associated with the prognosis of ovarian cancer.
Therefore,in this paper,we propose a method to integrate multi-omics data to identify biomarkers related to ovarian cancer.First,gene expression data,single nucleotide mutation and copy number variation data of ovarian cancerpatientsare obtained from TCGA(https://www.cancer.gov/tcga) and GEO(https://www.ncbi.nlm.nih.gov/gds/) databases.The 5-gene signature,internal test set and external verification set,most relevant to prognosis,have been obtained through the screening ofintegrated genomics and transcripto me data,which have proved their ability to predict the prognosis of patients.5-gene signature shows a strong clinical independence.The results of GSEA analysis also show that the pathway of 5-gene signature enrichment is significantly related to the pathway and biological process of the occurrence and development of ovarian cancer.It suggests that the model has potential clinical application value and can provide potential therapeutic targets for the diagnosis of clinical patients.
Methods
Data download and preprocessing
We download RNA-Seq data of TCGA,clinical follow-up information and copy number variation data of SNP6.0 chip from UCSC cancer browser(https://xenabrowser.net/datapages/).The mutation annotation file(MAF)is downloaded from the GDC client.The GSE17260 expression profile data and clinical follow-up information are downloaded from the GEO database.We obtain the TCGA training set and the test set,and scale the samples.The TCGA training set contains 189 samples,the test set contains 189 samples,and the GSE17260 contains 110 samples.We obtain the specific distribution of patient age,survival status,staging,lymphatic invasion,venous invasion and Tumor Stage in three data sets(Supplement Table 1).
Univariate Cox proportional risk regression analysi s
As Jin Chenget al[15]did a univariate Cox proportional risk regression analysis of each immune gene,we screen out the genes that are significantly related to the patient OS in the training data set.p<0.01 is selected as the threshold.
Analysis of copy number variation data
GISTIC is widely used and detects both broad and focal(potentially overlapping)recurring events.We use the GISTIC 2.0 [16]soft wareto identify genes with significanta mplification or deletion.The parameter thresholdsare the fragments with amplification or deletion length greater than 0.1 and p<0.05.
Gene mutation analysis
In order to identify the significantly mutated genes,we use the Mutsig 2.0 software to identify the significantly mutated genes in the maf file of the TCGA mutation data,with a threshold of p<0.05.
Construction of prognostic immune gene signature
We choose the genes that are significantly related to patient’soverallsurvival(OS)and genes thatare amplified,deleted,and mutated.Random survival forest algorithm is further used to rank the importance of prognostic genes [17].We use R package random Survival Forest[18]to screen genes,setting Monte Carlo iterations to 100 and forward steps to 5.The genes with relative importance greater than 0.4 are identified as feature genes.The multivariate Cox regression analysis is further carried out,and the following risk scoring models are constructed:

In the formula,N represents the number of prognostic immune genes.Expk represents the expression value of prognosticimmune genes,which istheestimated regression coefficient of immune genes in the multivariate Cox regression analysis.
Functional enrichment analysis
Gene Ontology(GO)and Kyoto Encyclopedia of Genes and Genomes(KEGG)pathway enrichment analysis are performed using the R package clusterprofiler[19],to identify over-represented GO terms in three categories(biological processes,molecular function and cellular component),and KEGG pathway.Inthisanalysis,FDR < 0.05 is considered to have statistical significance.
GSEA analysis
GSEA[20]analysis is performed by the JAVA program(http://software.broadinstitute.org/gsea/downloads.jsp)
using the MSigDB[21]C2 Canonical pathways gene set collection,which contains 1320 gene sets.Gene sets with the false discovery rate(FDR)value less than 0.05 after performing 1000 permutations are considered to be significantly enriched.Statistical analysis
The Kaplan-Meier(KM)curve is drawn when using the median risk score in each dataset as cutoff to compare the survival risk between high-risk group and low-risk group.Multivariate Cox regression analysis is performed to test whether genetic markers are independent prognostic factors.The significance is defined as P<0.05.All of these analyses are carried out in R 3.4.
Results
Prognostic genes obtained from preliminary analysi s of multi-omics data
For the samples of TCGA training set,we establish the relationship between patients’overall survival(OS)and gene expression with univariate regression analysis,identifying 2097 genes of univariate cox regression with p value less than 0.05 as candidate prognostic genes.The first 20 genetic information of the 2097 candidate prognostic genes are shown in Table 1.

Table 1.Information of top 20 prognosis-related genes

Gene HR coefficient Z-score P-value ENSG00000114742 0.6710 -0.3990 -3.7834 0.0002 ENSG00000064270 0.6529 -0.4263 -3.7722 0.0002 ENSG00000276612 1.3696 0.3145 3.7371 0.0002
Copy number variation data analysis
For the copy number variation data in TCGA,we use GISTIC 2.0 to identify the genes with significant amplification ordeletion.Parame terthresholds are fragments with amplification or deletion lengths greater than 0.1 and p<0.05.The significantly amplified fragments of ovarian cancer genome are shown in Figure 1A.Supplement Table 2 records the genes that are significantly amplified on each fragment.For example,CCNE1 on 19q12 is significantly amplified(q value=2.06E-98),KRAS on the 12p12.1 issignificantly amplified(q value=2.64E-18),and CD7 on 17q25.3 is significantly amplified(q value=0.00080632).A total of 447 geneshavea mplification.The fragmentswith significant deletion in the ovarian cancer genome are shown in Figure 1B.Supplement Table 3 records the genes that have significant deletion on each fragment.For example,there is a significant deletion of CCNB1 on 5q13.3(q value=2.44E-58),a significant deletion of RB1 on 13q14.2(q value=2.06E-10),and a significant deletion of CDKN2A on 9p21.3(q value=0.04325).A total of 1069 genes have gene deletions.

Table 2.Five genes significantly associated with the overall survival in the training set

Figure 1.A:Significantly amplified fragments in the ovarian cancer genome;B:Significantly deleted fragments in the ovarian cancer genome
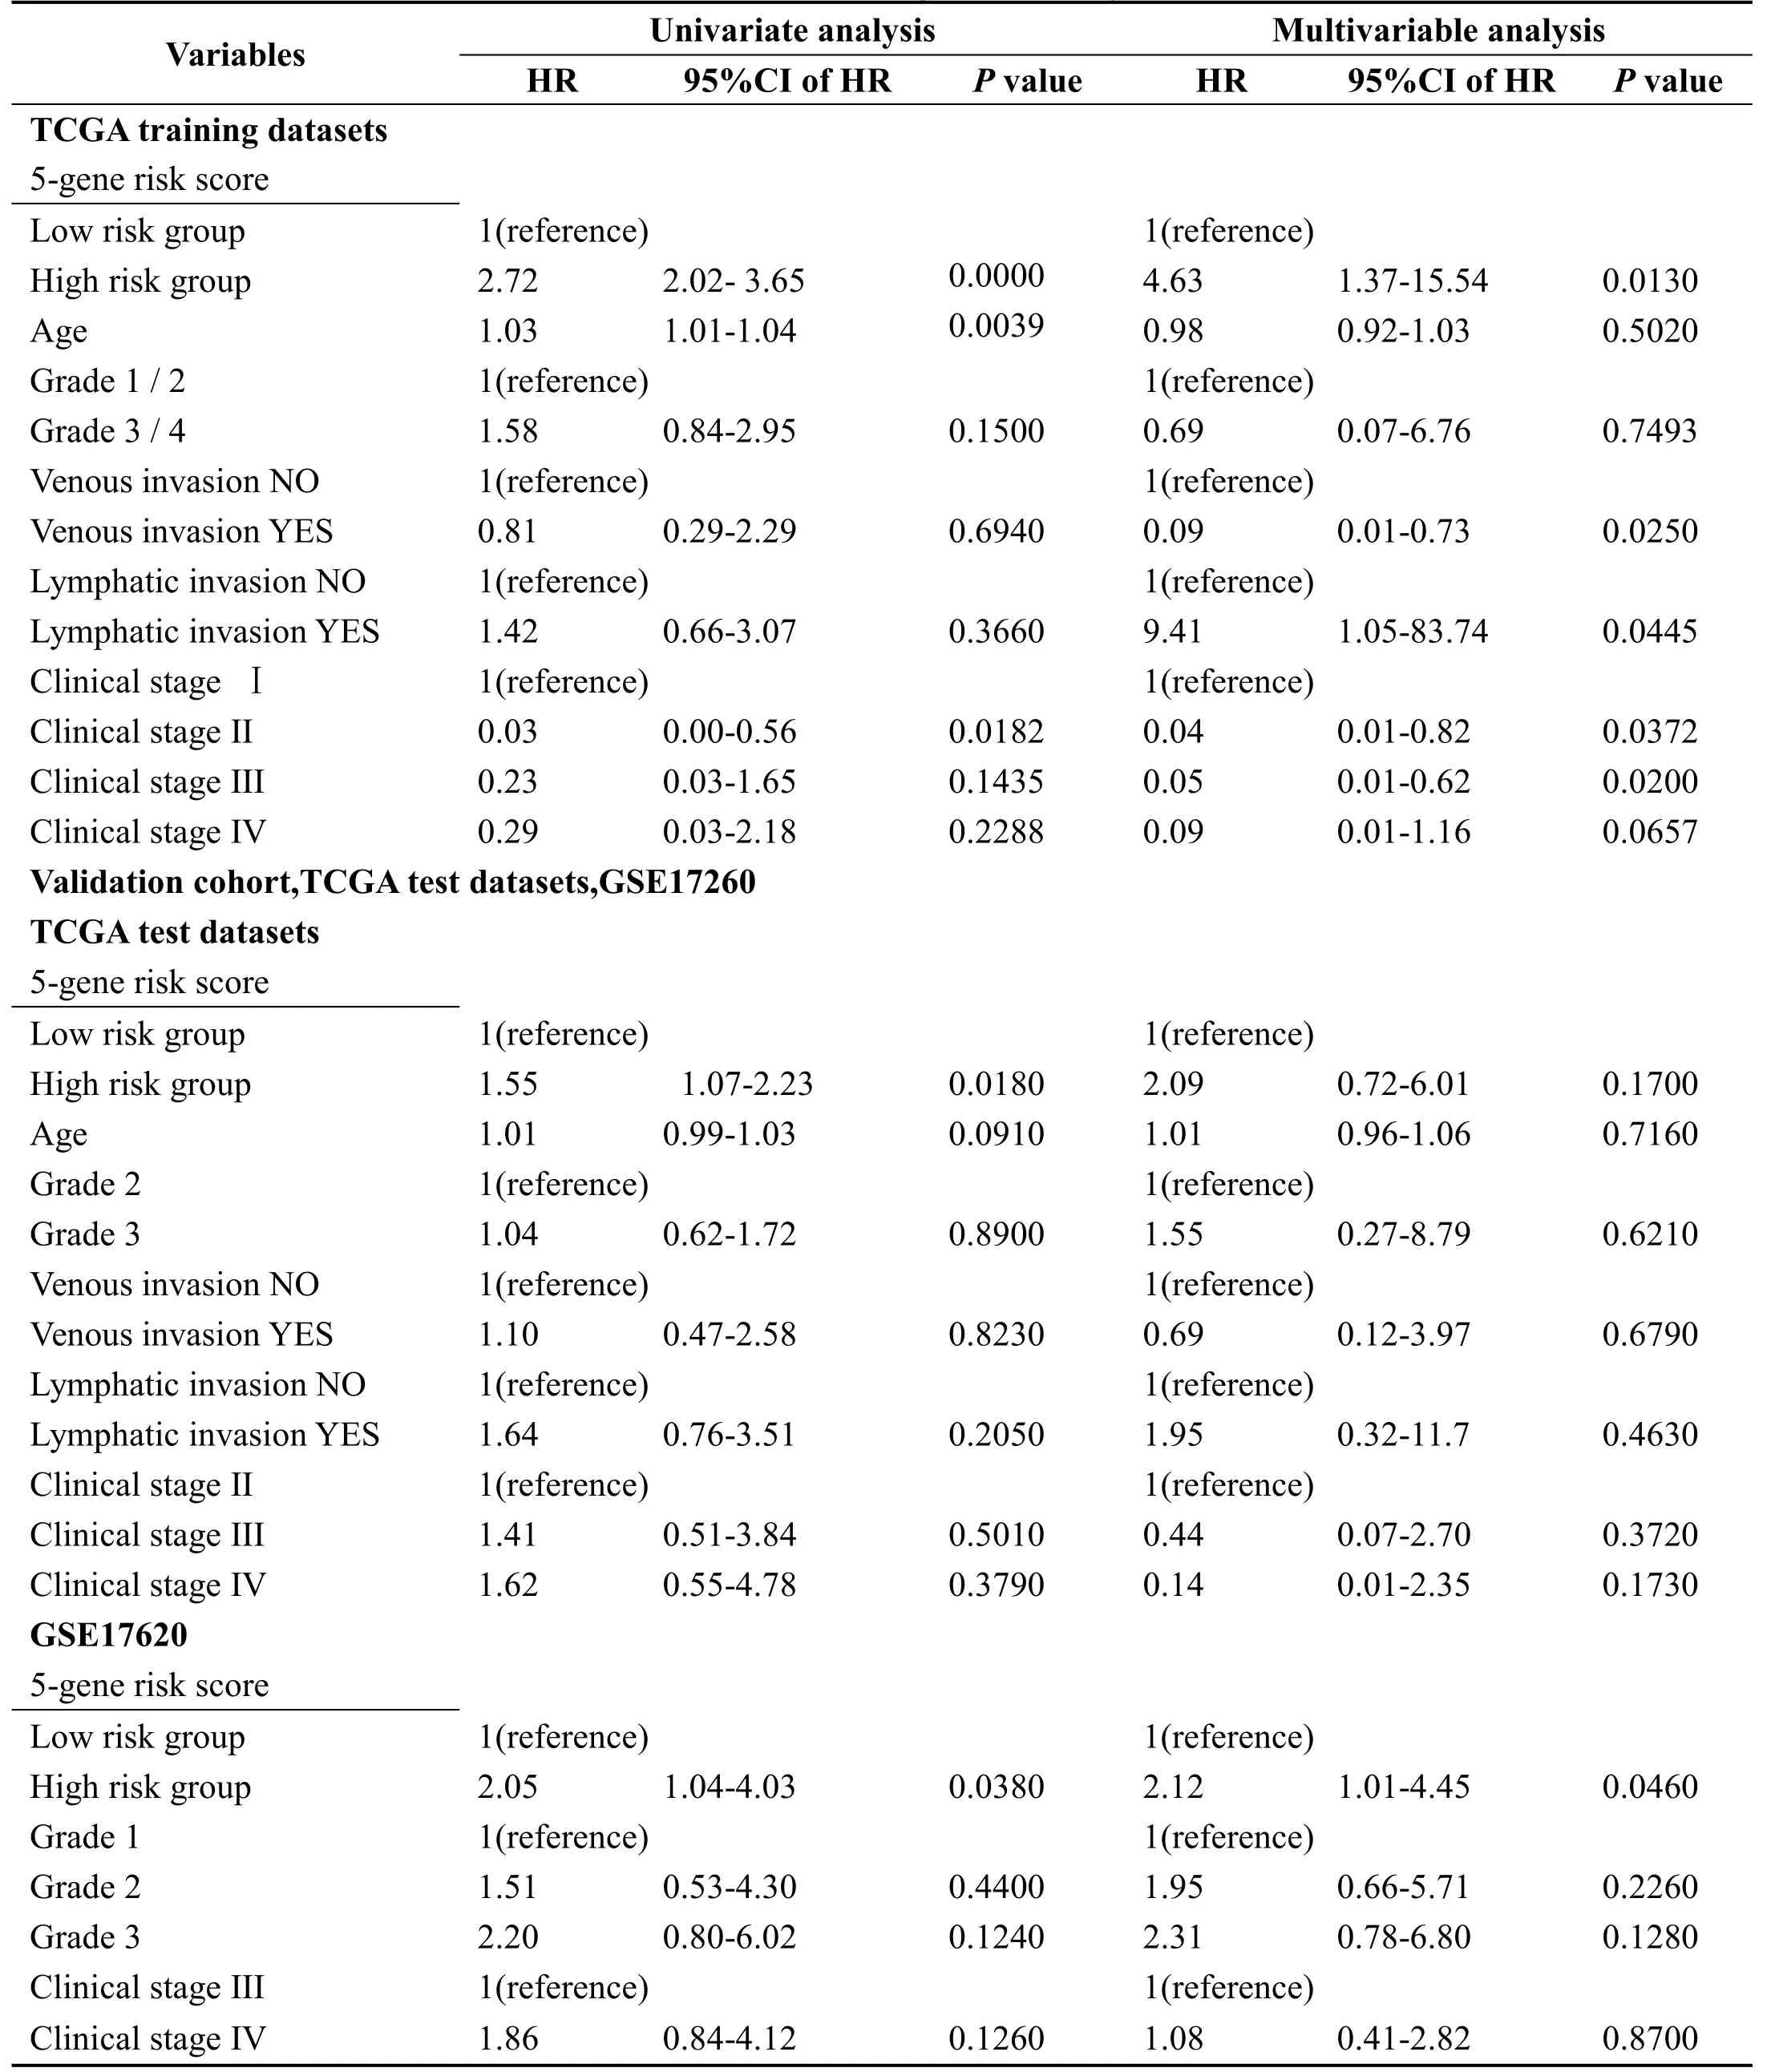
Table 3.Identification of clinical factors and clinical independence associated with prognosis by univariate andmultivariate COX regression analysis
Mutation Data analysis
For the mutation annotation data of TCGA,we use Mutsig2 to identify the genes with significant mutations,selecting p<0.05 as a threshold.A total of 654 genes are obtained which have significant mutation frequencies,as shown in mutation_gene.txt.Figure 2 shows the distribution of synonymous mutations,missense mutations,frame insertion or deletion,frame movements,nonsense mutations,shear locis,and other non-synonymous mutations in the 50 genes with the most significant p values in TCGA ovarian cancer samples.We identify that some of the 654 genes are closely related to the previous studies that have been reported to be related to the occurrence and development of cancer,such as RB1,TP53,BRCA1,and CDK12 etc.
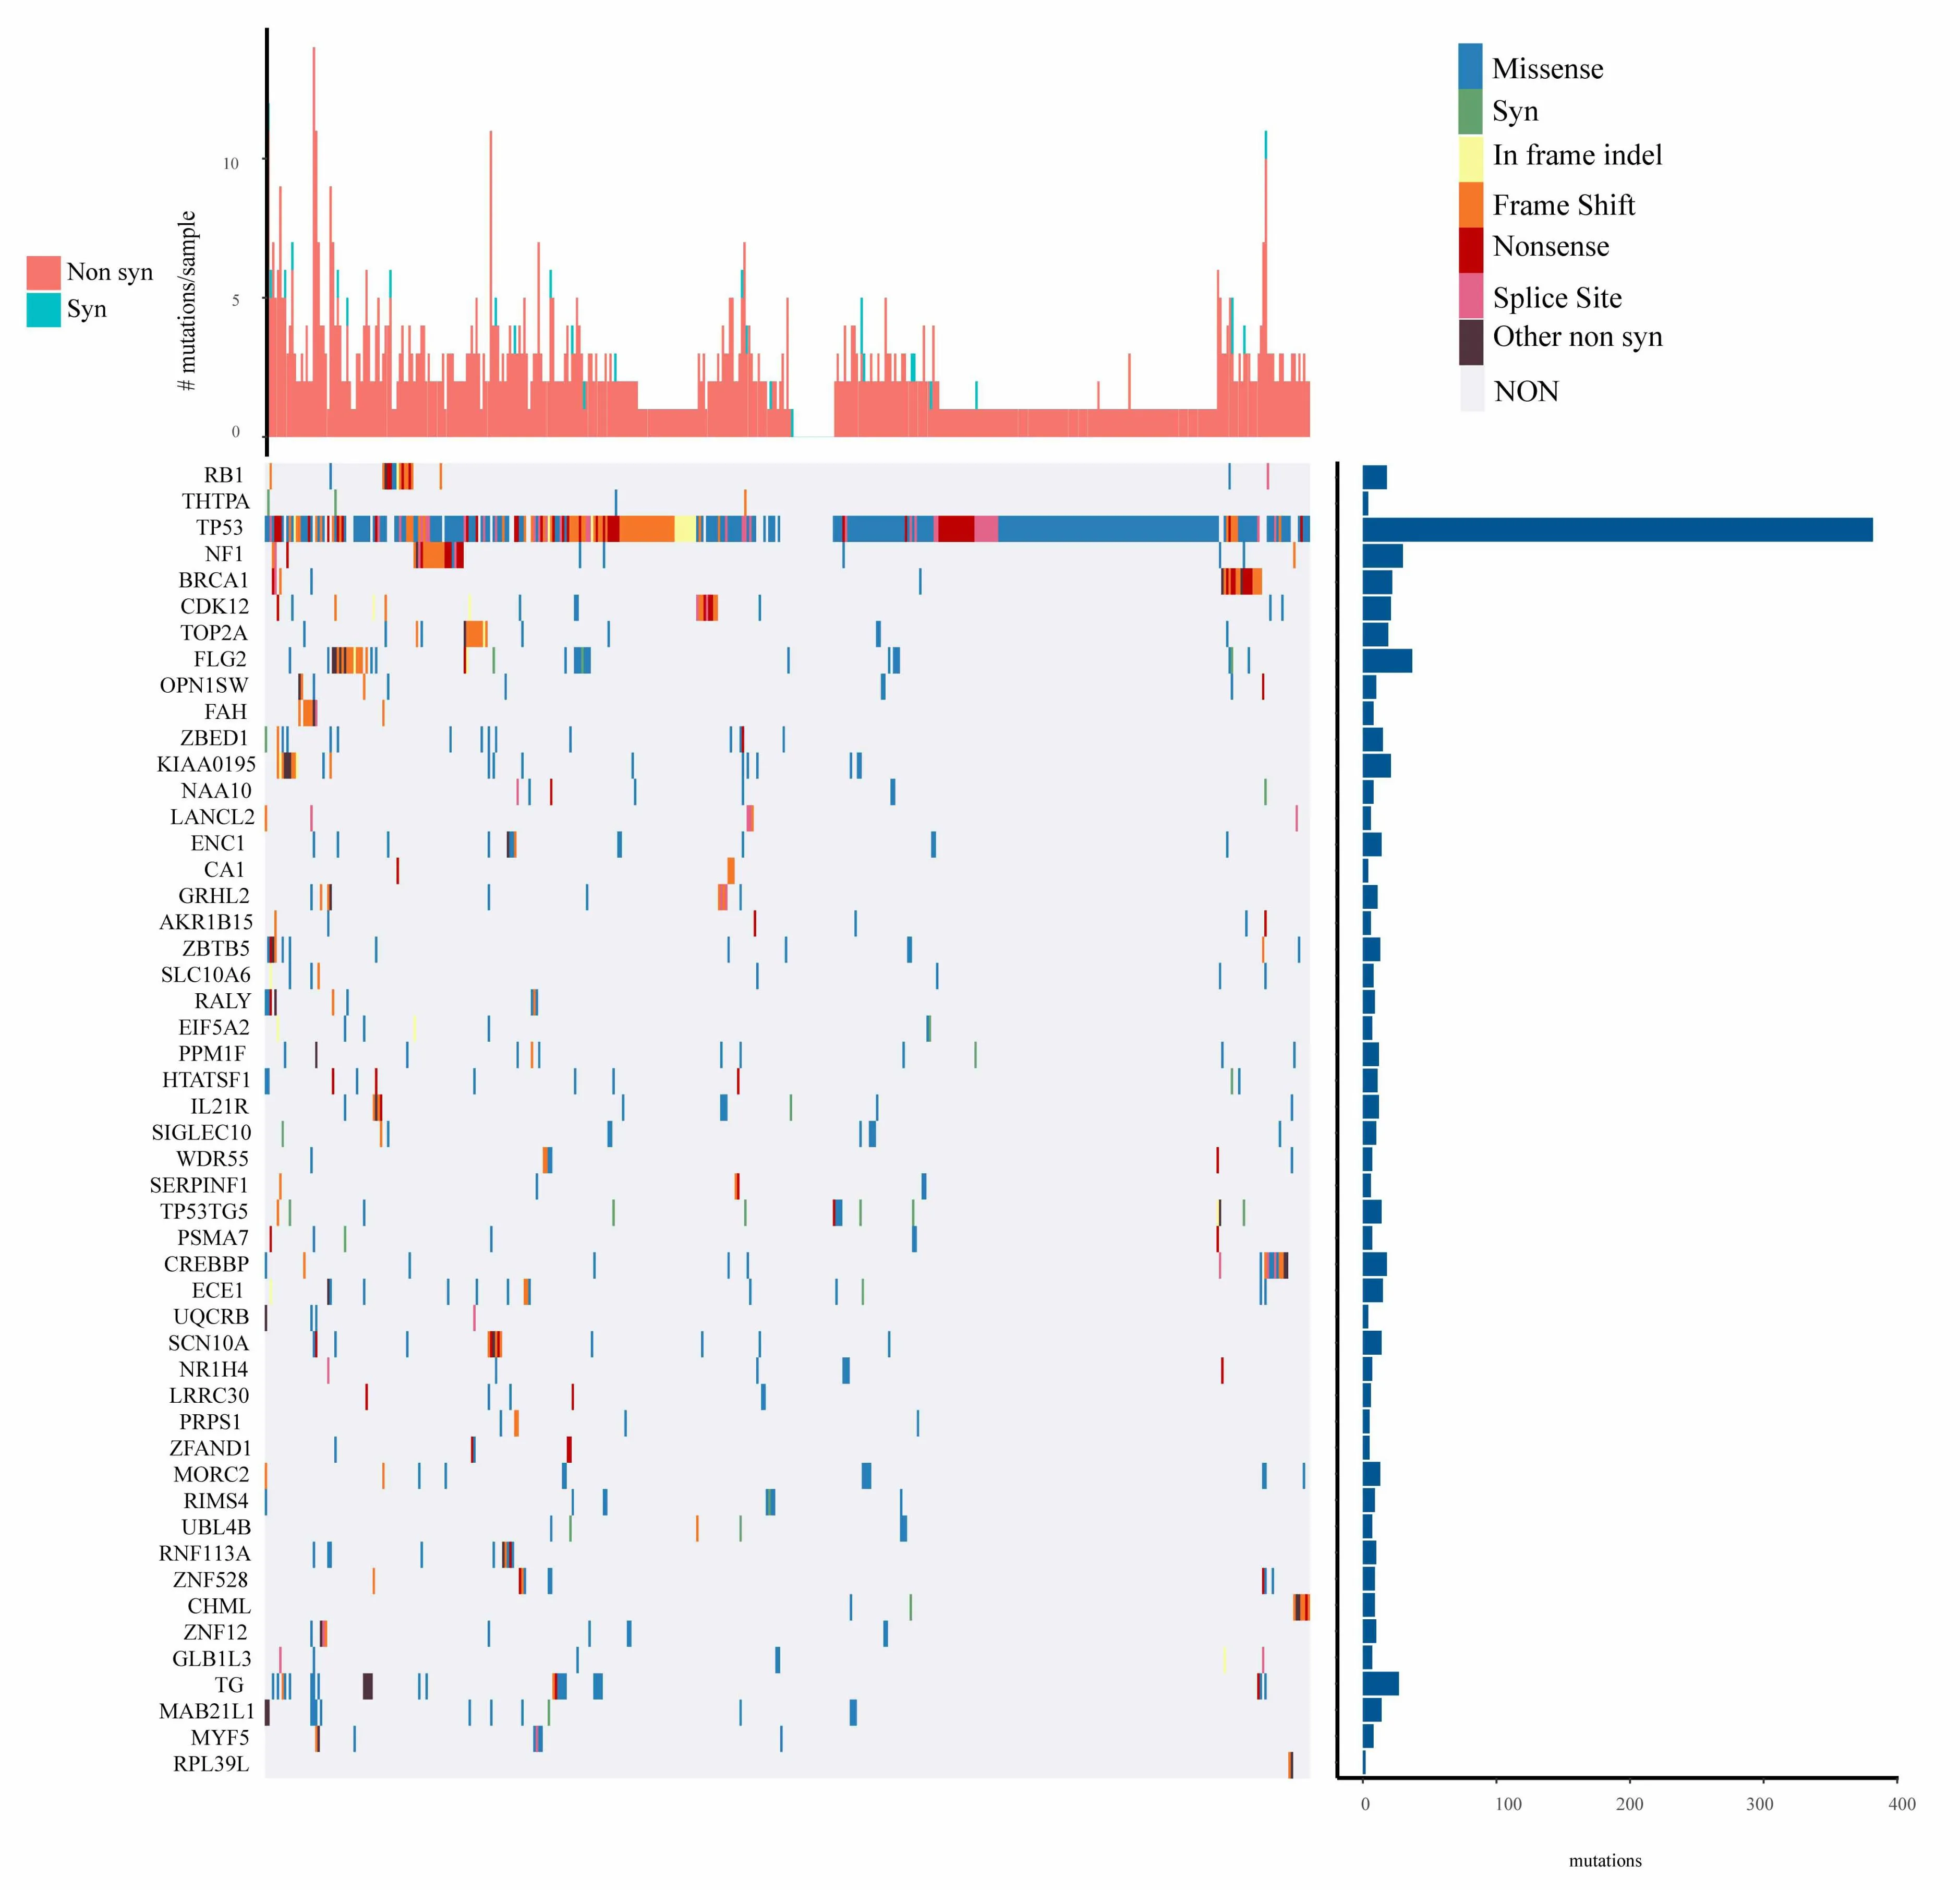
Figure 2.Distribution of 50 genes with the most significant P value in patients with ovarian cancer
Pathways and biological processes involved in copy number variation genes and mutant genes
By identifying amplification and deletion genes with TCGA copy number variation,as well as mutant gene integration,we identify a total of 1946 genes involved in biological processes and pathways.In Figure 3A,1946 genes are significantly enriched in the pathways of occurrence and development of cancer,including Hepatocellular carcinoma,Prostate cancer,Chronic myeloid leukemia,and B cell receptor signaling pathway.In Figure 3B,1946 genes are significantly enriched in developmental process,positive regulation of biological process,positive regulation of cellular process,regulation of signal transduction and other biological processes related to the occurrence and development of cancer.
Prognostic genes sequencing of the importance of random survival forest
We identify 2097 candidateprog nosticgenes with amplification,deletion and mutation,and obtain 158 genes.We use random survival forest algorithm to rank the importance of prognostic genes (R package random Survival Forest),setting parameter as nrep=100 and nstep=5,which means that the Monte Carlo iteration is 100,and forward step is 5.We identify the genes with a relative importance greater than 0.5 as the final signature.Figure 4A shows the relationship between error rate and the number of classification trees.Figure 4B shows the importance sequencing of the first five genes out-of-bag.

Figure 3.A.KEGG pathways participated by 1946 genes with copy number variation and mutation;B.Biological processes involving 1946 genes with copy number variation and mutation

Figure 4.A.The relationship between error rate and the number of classification trees;B.Importance sequencing of the first five genes out-of-bag
Establishment of 5-gene signature to divide sample s in TCGA training set
As for the identified 5-gene signature mentioned above,Table 2 lists the HR,Z score and p value of univariate regression,as well as the importance and relative importance of the first five genes out-of-bag.
Then,the 5-gene signature is established using the multivariate COX regression analysis method.The model is established as follows:

The scoring formula for each sample is the sum of the*ordinal numbers of the above gene expression values.Then we select the median score of thesample-0.0002004649 as cutoff,to divide the samples into high-risk group and low-risk group.Figure 5A shows the classification effect in the TCGA training set.95 patients are divided into the low risk group and 94 patients are divided into the high risk group.There are significant differencesbet ween the two groups.Log-rank p=5.977197e-07.Figure 5B shows the ROC curve,in which the AUC is 0.75.Figure 5C shows that the survival time of death samples decreases significantly as the patient's risk score increases.High-risk group has more death samples.The expression changes offive different signature genes with the increase of risk value show that the high expression of PSMB1,COL6A6,and SLC22A2 is related to high risk of them.These three genes are risk factors.The high expression of KLHL23 and CD3G is related to the low risk of them.These two genes are protective genes.
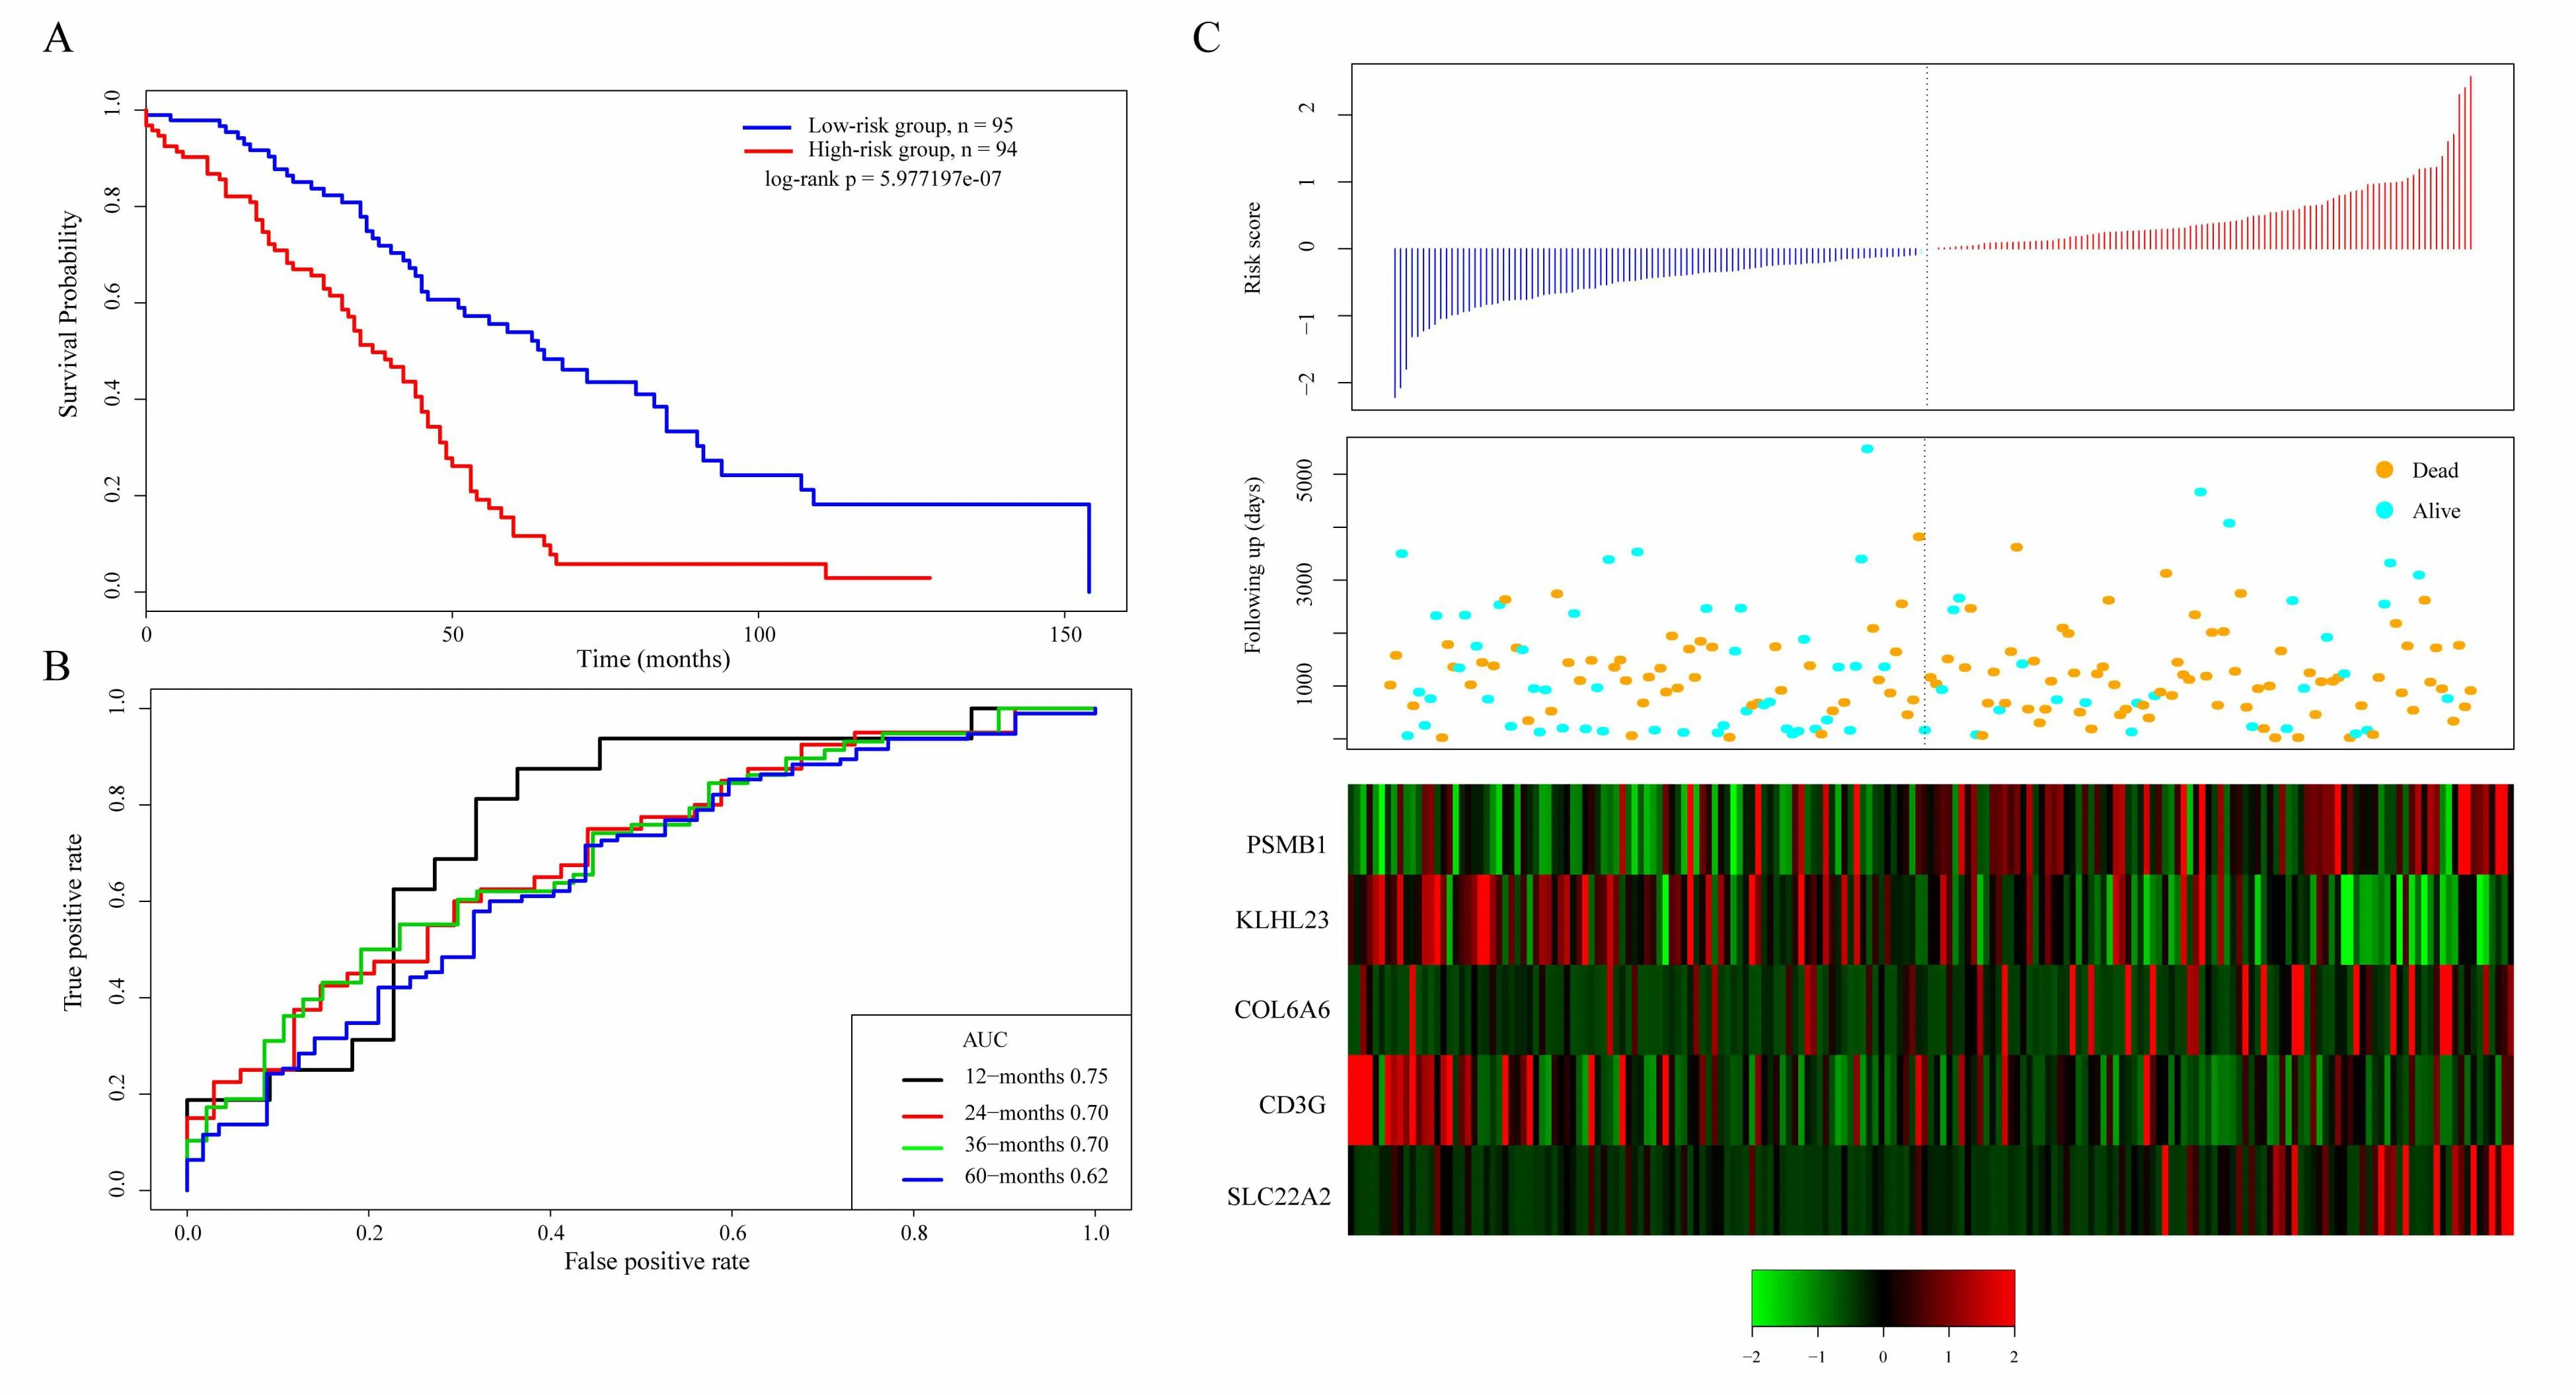
Figure 5.A.KM survival curve distribution of 5-gene signature in TCGA training se;B.ROC Curve and AUC of 5-gene signature classification;C.The risk score,survival time,survival status,and the expression of five genes in TCGA training set
Robustness detection of 5-gene signature in TCGA test set
In order to determine the robustness of the model,we use the same model and the same cutoff as the TCGA training set,and conduct verification in the TCGA test set.Figure 6A shows the classification effect in TCGA test sets.100 patients are divided into the low risk group and 89 patients are divided into the high risk group.There are significant differences between the two groups.Log-rank p=0.01690201.Figure 6B shows the ROC curve,in which the AUC is 0.68.Figure 6C produces results similar to the TCGA training set that the survival time of death samples decreases significantly as the risk value increases.High-risk group has more death samples.The expression changes of five different signature genes with the increase of risk value show that the high expression of PSMB1,COL6A6,and SLC22A2 is related to high risk of them.These three genes are risk factors.The high expression of KLHL23 and CD3G is related to the low risk of them.These two genes are protective genes.
Verifying the robustnessof5-gene signature in external independent dataset GSE17260
Similarly,we verify the robustness of the model in the external independent dataset GSE17260 using the same model and the same cutoff as the TCGA training set.Figure 7A shows the classification effect in GSE17260.44 patients are divided into the low risk group and 37 patients are divided into the high risk group.There are significant differences between the two groups.Log-rank p=0.03500249.Figure 7B shows the ROC curve,in which the AUC is 0.68.Figure 7C produces results similar to the TCGA training set that the survival time of death samples decreases significantly as the risk value increases.High-risk group has more death samples.The expression changes of five different signature genes with the increase of risk value show that the high expression of PSMB1,COL6A6,and SLC22A2 is related to high risk of them.These three genes are risk factors.The high expression of KLHL23 and CD3G is related to the low risk of them.These two genes are protective genes.
Analysis of clinicalin dependence of the 5-gene signature model
In order to identify the independence of 5-gene signature model in clinical application,we have used univariate and multivariate COX regression to analyze the relevant HR,95%CI of HR,and p value in the clinical information carried by TCGA training set,TCGA test set and GSE17260 data.We systematically analyze age,stage,lymphatic invasion,venous invasion,tumor stage and grouping information Table 3 of the 5-gene signature of patients recorded in TCGA and GSE17260.
In the TCGA training set,univariate COX regression analysis has found that high risk group,age,and clinical stage II are significantly related to survival.However,the corresponding multivariate COX regression analysis has showed that only high risk group(HR=4.63,95%CI=1.37-15.54,p=0.013),venous invasion YES(HR=0.09,95%CI=0.01-0.73,p=0.025),Clinical stage II(HR=0.04,95%CI=0.001-0.82,p=0.0372)and clinical stage III(HR=0.05,95%CI=0.004-0.62,p=0.02)have clinical independence.
In the TCGA test set,univariate COX regression analysis has found that high risk group is significantly related to survival.However,the corresponding multivariate COX regression analysis has found that none of the factors have clinical independence.High risk group corresponds to HR=2.094,95%CI=0.72-6.01,and p=0.170.
In GSE17260,univariate COX regression analysis has found that high risk group is significantly related to survival.The corresponding multivariate COX regression analysis shows that high risk group(HR=2.12,95%CI=1.01-4.45,p=0.046)has clinical independence.
The above conditions suggest that our 5-gene signature model is a prognostic indicator independent of other clinicalfactors,which has independent predictive performance in terms of clinical application.
Figure 6.A.KM survival curve distribution of 5-gene signature in TCGA test set;B.ROC Curve and AUC of 5-gene signature classification;C.The risk score,survival time,survival status,and the expression of five genes in TCGA training set
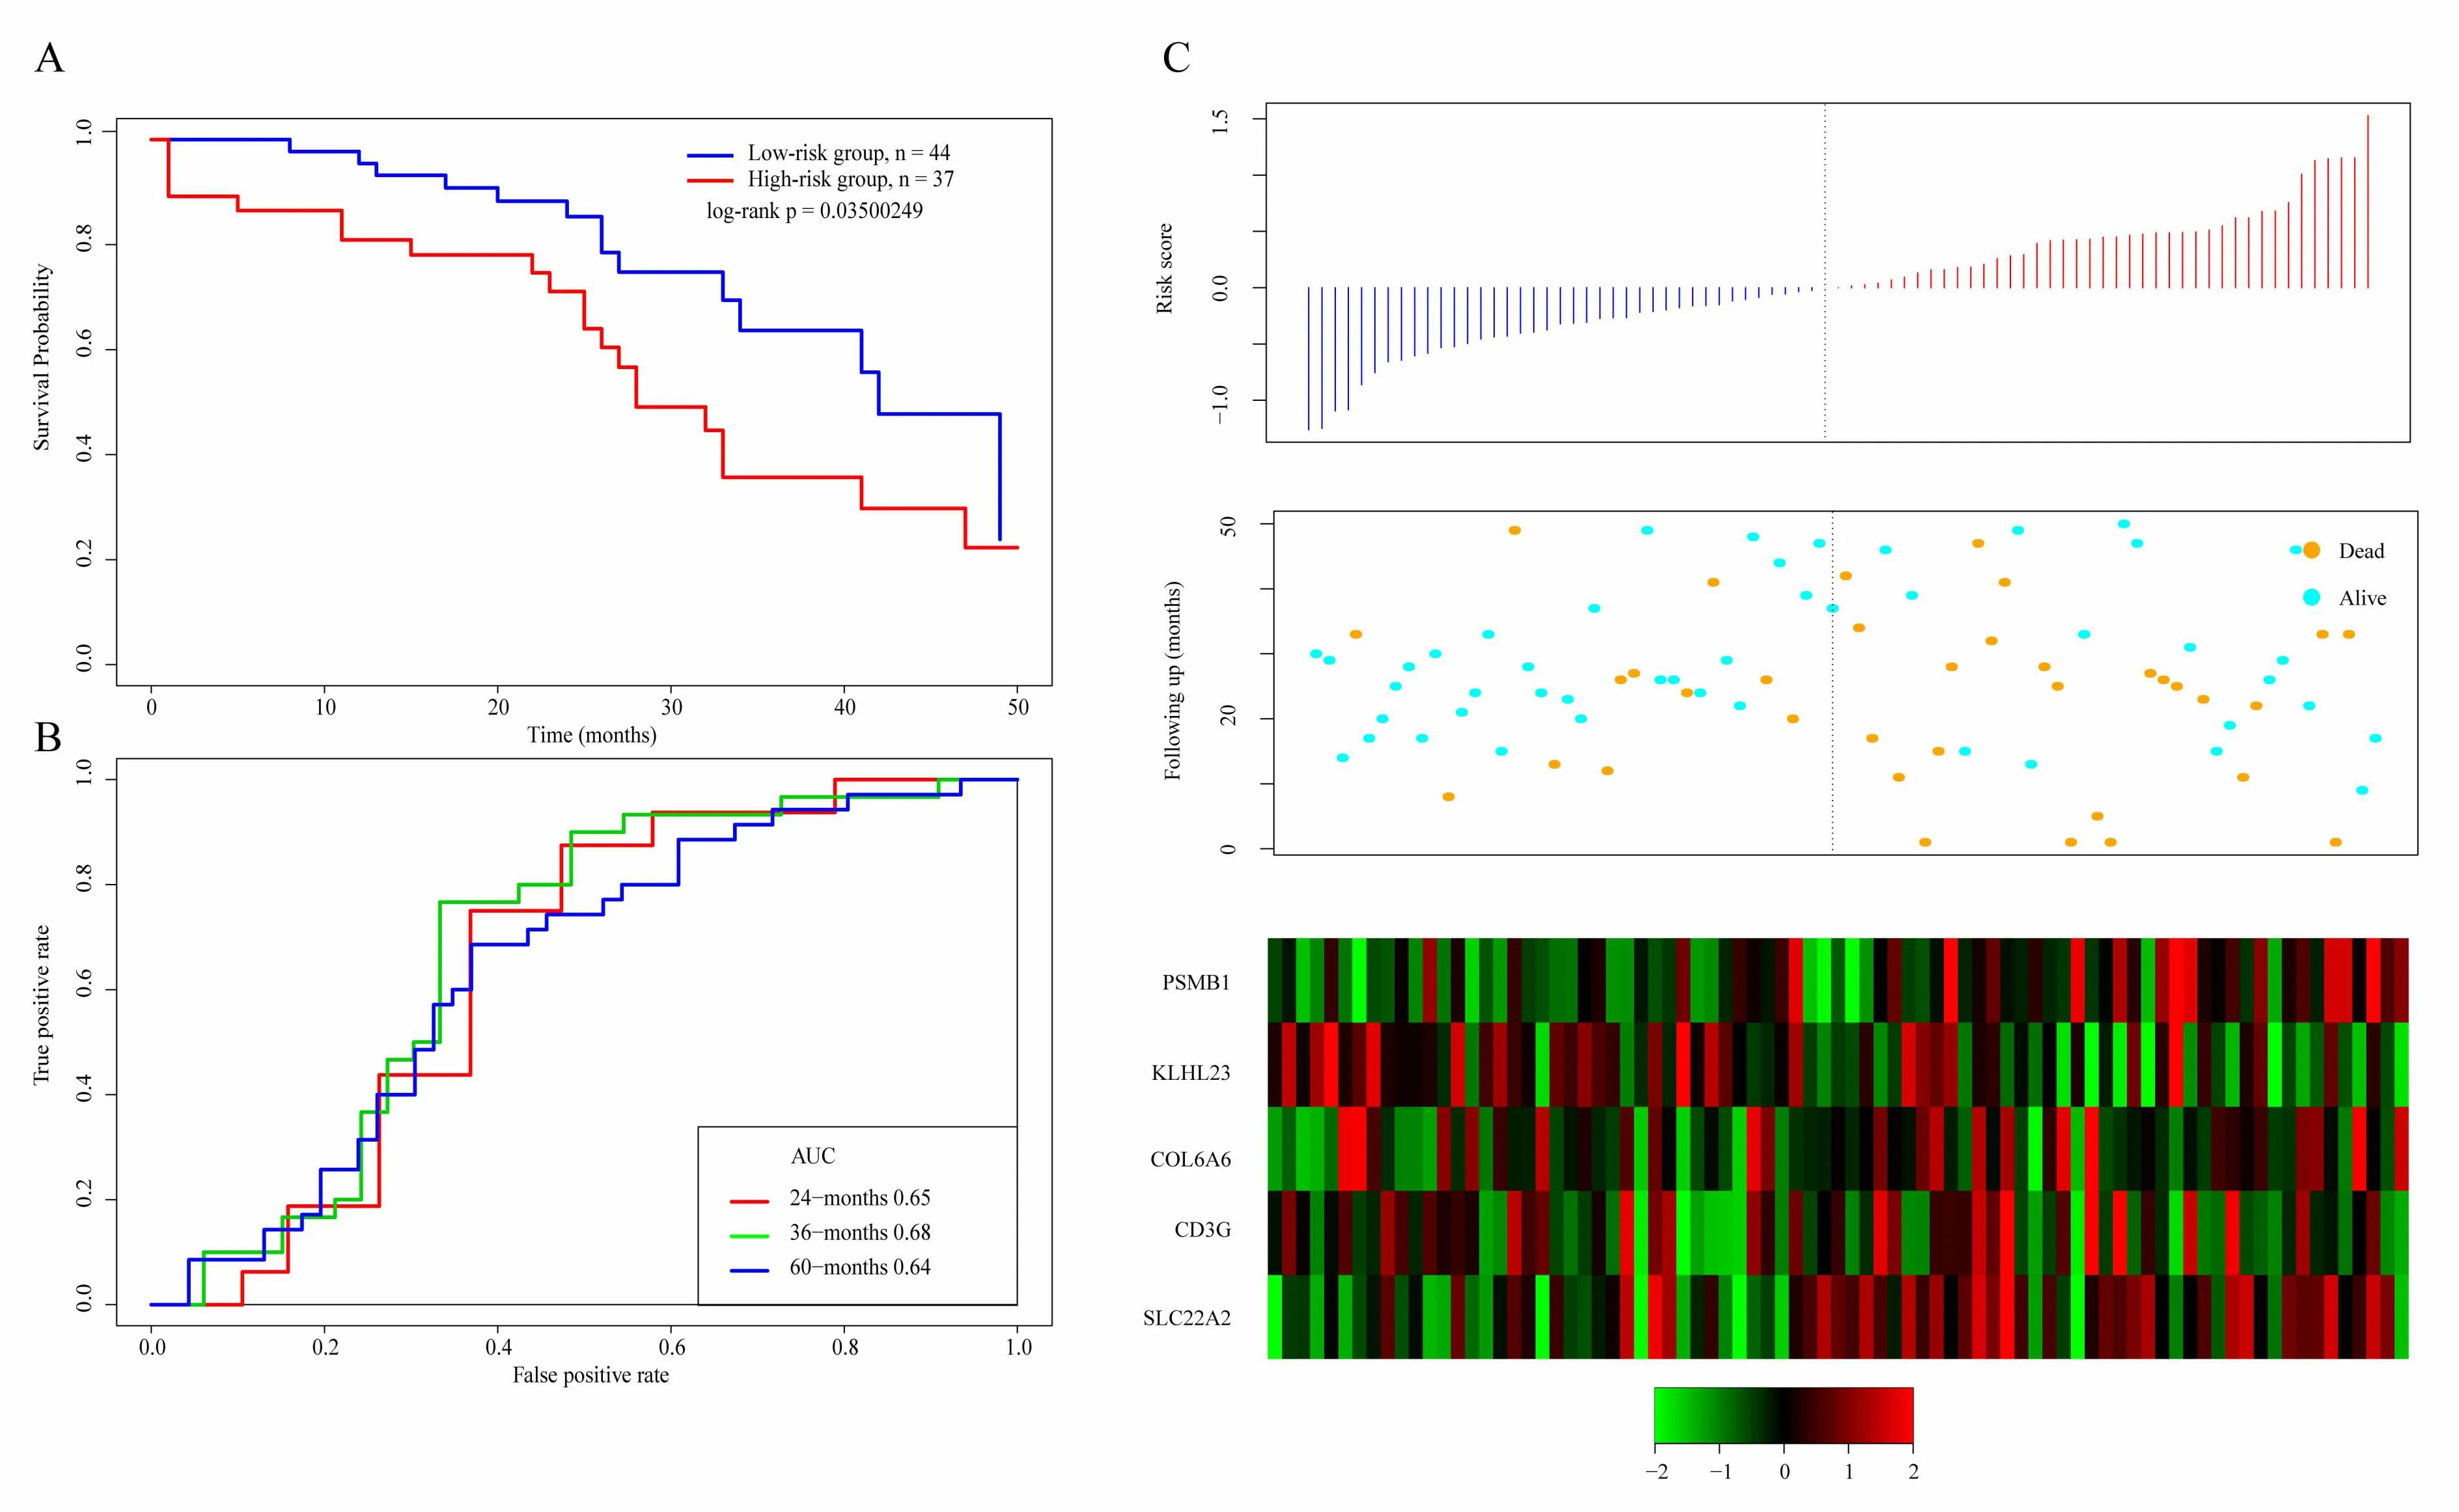
Figure 7.A.KM survival curve distribution of 5-gene signature in GSE17260;B.ROC Curve and AUC of 5-gene signature classification;C.The risk score,survival time,survival status,and the expression of five genes in GSE17260
Analysisofpathwaysenriched in high-risk and low-risk groups using GSEA
We use GSEA in TCGA training set to analyze the significantly enriched pathways in high-risk and low-risk groups.The selected gene set is c2.cp.kegg.v6.0.symbols,which includes the pathway of KEGG.The GSEA input file contains the standardized expression profile data of the TCGA training set.The sample label marked by 5-gene signature marks the sample as a high-risk group and a low-risk group.The selected threshold for enriched pathway is 0.05.Then we get the significantly enriched pathway(Table 4).
Forexample,KEGG COLORECTALCANCER,KEGGNOTCH SIGNALINGPATHWAY,KEGG SMALL CELL LUNG CANCER,and KEGG OXIDATIVE PHOSPHORYLATION,which are significantly enriched in the high-risk group in Figure 8,are significantly related to the occurrence,development and metastasis of ovarian cancer.

Table 4.GSEA analysis of significantly enriched KEGG pathways in high-risk and low-risk groups
Discussion
Ovarian cancer is a highly heterogeneous disease in prognosis.Different types of ovarian tumors,which occur in different populations,may have significant differences in prognosis[22,23].It involves the pathology type of tumor,biochemical function,drug tolerance,migration ability and invasion ability,which has a great influence on the treatment choice and prognosis of patients.Therefore,screening prognostic biomarkers that fully reflect the biological characteristics of ovarian cancer is of great significance for individualized prevention and treatment of ovarian patients[24-26].In this study,we have analyzed the expression profiles of 488 ovarian cancer samples from TCGA database and GEO database.We identify five gene signatures associated with prognosis and they have showed strong clinical independence.
At present,gene signature has been used in clinical research.For example,Liu,Ronget al[27]analyzed the lncRNA expression profile of 258 ovarian cancer patients in TCGA database,predicting the long non-coding RNA expression characteristics of platinum-based chemotherapy sensitivity in ovarian cancer patients,which is used to explore the biomarkers associated with drug resistance of ovarian cancer.These results have shown that screening new prognostic markers in cancer with gene expression profiles has become the most promising method for high-throughput molecular identification.Meng,Xu[28]used multi-omics data,including protein-coding genes,long non-coding RNA and small RNA data to identify disease-related genes to identify prognostic markersassociated with ovarian cancer.It was found that the maximum area under the ROC curve(AUC)constructed by prognostic genes was 0.69 in the training group and 0.62 in the test group.The AUC of our 5-gene signature in both the training set and the verification set is close to 0.70.In addition,our 5-gene signature based on multi-omics data recognition has strong robustness.It has been proved to have a stable prediction performance in the data sets of different platforms such as TCGA and GEO.The five gene signatures have strong clinical independence,which can maintain stable clinical independence under the influence of many clinical factors.
Among the 5 gene signatures,PSMB1,COL6A6,and SLC22A2 are risk factors,and KLHL23 and CD3G are protective factors.It has been reported that high COL6A6 expression level is significantly correlated with the early pathological stage of breast cancer(P=0.003)[29],and the KLHL23 expression level is closely related to gastric cancer[30].Huang,Poyin [31]established a risk assessment model using six genes,including KLHL23,to predict the molecular genetic characteristics and prognosis of non-small cell lung cancer.It has been reported that CD3G is a potential biomarker of colorectal cancer risk[32],and the genetic polymorphism of CD3G may be associated with susceptibility to liver cancer[33].These genes are closely related to the risk or prognosis of tumors.PSMB1 and SLC22A2 have not been reported to be associated with tumors,while in this study they are found as new prognosis markers for ovarian cancer for the first time.At the same time,our GSEA analysis shows that the enriched pathways in the high and low risk groups obtained by 5-gene signature are significantly related to the occurrence and development of ovarian cancer.These resultsshow thatthemodelhaspotentialclinical application value,which can provide potential therapeutic targets for the diagnosis of clinical patients.

Figure 8.The enriched pathways in the high risk group obtained by 5-gene signature
Although we can identify potential candidate genes for tumor prognosis based on multi-omics data through bioinformatics,we should pay attention to some limitations of this study.First,this study has high requirements for the amount of sample data.Although TCGA,GEO and other databases provide data support for our research,only some cancers can obtain sufficient data such as gene expression data,single nucleotide mutation,and copy number variation data etc.There are also problems,such as insufficient sample size,when it is used in other diseases.Secondly,the results obtained only through bioinformatics analysis are inadequate,requiring follow-up pharmacological experiments to further confirm them.Last but not least,this study has high requirements for bioinformatics and other professional knowledge.There are still some technical difficulties in its promotion in clinical use.
In conclusion,we propose a method to integrate multi-omics data to identify biomarkers related to ovarian cancer in this paper.We finally identify 5-gene signature,and construct a prognostic assessment model for patients.The model has a good AUC in both test sets and external independent datasets.5-gene signature shows strong clinical independence.Compared with clinical characteristics,the model can better predict the survival risk of patients,which proves its potential clinical application value and provides new biomarkers for the diagnosis of clinical patients.
Conclusion
In conclusion,weproposeamethod to integrate multi-omics data to identify biomarkers related to ovarian cancer in this paper.We finally identify 5-gene signature,and construct a prognostic assessment model for patients.The model has a good AUC in both test sets and external independent datasets.5-gene signature shows strong clinical independence.Compared with clinical characteristics,the model can better predict the survival risk of patients,which proves its potential clinical application value and provides new biomarkers for the diagnosis of clinical patients.
 TMR Modern Herbal Medicine2019年4期
- TMR Modern Herbal Medicine的其它文章
- Compatible stability study of XingNaoJing injection based on physical-chemical properties analysis
- Similarity measurement of Chinese medicine ingredients for cold-hot nature identificatio n
- Effect of Xuebijing injection on hematopoietic homeostasis of LPS induced sepsis in mice
- Bio-characteristic profiling related to clinic:A new technology platform for quality evaluation of Chinese materia medica
- Network pharmacology based method for mechanistic investigation of the Compound Xintahua in the treatment of atherosclerosis