
Uranium measurements using laser-induced breakdown spectroscopy in lithium chloridepotassium chloride salt of pyroprocessing
2020-07-09 04:20SeulKiHANSeHwanPARKandSeongKyuAHN
Plasma Science and Technology 2020年7期
Seul-Ki HAN,Se-Hwan PARK and Seong-Kyu AHN
Korea Atomic Energy Research Institute,Yuseong-gu,Daejeon 34057,Republic of Korea
Abstract
Keywords:LIBS,uranium(U),safeguards,LOD
1.Introduction
Pyroprocessing is a high-temperature process to change physical or chemical form,and the pyroprocessing has been developed to treat spent nuclear fuel from pressurized water reactors and produce metal products,which can be used in a fast nuclear reactor [1,2].One of the main processes of the pyroprocessing is an electro-refining (ER) process,in which U is recovered from molten LiCl–KCl salt.
International safeguards have to be implemented in a pyroprocessing facility to verify that nuclear material diversion or facility misuse does not occur,and it is essential to quantitatively measure or monitor nuclear material in the ER salt in a timely manner [3–5].
Analytical methods that can be used to analyze this type of salt are limited due to the high temperatures(about 500°C)and high radiation doses in the operating conditions.Generally,salt samples can be taken and measured via chemical analysis such as inductively coupled plasma mass spectrometry (ICP-MS) [6].The processes of sampling,material transfer and the subsequent pretreatment steps associated with ICP-MS,unfortunately,are cumbersome and can cause significant delays between the sampling step and obtainment of the compositional results [7].
Laser-induced breakdown spectroscopy (LIBS) is an alternative or supplement to the traditional analytical methods.LIBS,a type of atomic emission spectroscopy,mainly consists of a highly energetic laser pulse to generate plasma and a spectrometer to collect the characteristic emission spectrum necessary to analyze sample compositions qualitatively or quantitatively.LIBS has a number of unique features,such as applicability to any type of sample,practically no required sample preparation steps,remote sensing capabilities,and short analysis time [8–12].
Several investigations into the use of LIBS with ER salt have been carried out.Weisberg et al measured the lanthanide concentrations in molten eutectic LiCl–KCl salts [13].Williams et al measured the U concentration in UCl3–LiCl–KCl salt using the molten-salt aerosol LIBS method[14].Williams et al also used a vacuum extraction method to draw molten salt(CeCl3–GdCl3–LiCl–KCl),using LIBS to measure the Ce and Gd concentrations in frozen-solid salt [15].
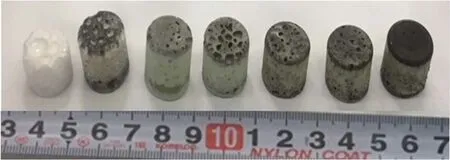
Figure 1.Salt samples used in present work.
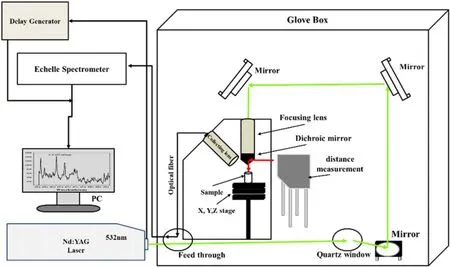
Figure 2.Schematic diagrams of LIBS system for U quantitative analysis in glove box.
Within the scope of our investigation on the previous researches,there was no LIBS measurement of U in actual ER salt of the pyroprocessing treating the nuclear spent fuel,which contains various rare earth elements.The reported results of the previous works are measurement of surrogate material of U or U in pure LiCl–KCl salt,in which various rare-earth elements were not contained.Since a LiCl–KCl salt contained various rare earth elements and U to simulate the ER salt of the pyroprocessing in the present work,we can explore the effect of rare earth elements on LIBS measurement.Since the LiCl–KCl salt of the pyroprocessing contains a certain amount of U during the process,the important issues related to the LIBS analysis of U in the ER salt are (1)whether we can measure U lines,(2) which U lines can be used for the analysis,and (3) what is the accuracy of the U analysis.These issues are explored in the present work.
2.Materials and methods
In this experiment,additional elements were added to LiCl–KCl salt to simulate the ER salt of the pyroprocessing.Thesalts employed in this work were 81.5LiCl–KCl Eutectic salt(Alfa,99.95%),3.0LaCl3(Junsei Chemical Co.,Ltd,95%),5.7CeCl3(Junsei Chemical Co.,Ltd,98%),0.4BaCl2(Alerich,99.9%),1.0PrCl3(Alfa,99.99%),5.7NdCl3(Alfa,99.9%),0.9YCl3(Alfa,99.9%) and 1.0SmCl3(Alfa,99.9%).Depleted uranium trichloride (UCl3) was included in the salt.The concentrations of the UCl3were varied.The U concentrations of the salt were in the range of 1.5 wt% to 6.8 wt%,which weredetermined by analyzing by using inductively coupled plasma optical emission spectroscopy (ICP-OES) after LIBS measurement.Fe was also added to the salt during the UCl3fabrication.The salt mixtures were prepared by weighing the required amounts of salts and mixing them by grinding to achieve homogeneity.Each salt mixture was put in a glassy carbon crucible,and the glassy carbon crucibles were heated to 650 °C for 90 min in a furnace.This temperature was maintained for two hours,after which the salt mixtures in the glassy carbon crucibles were slowly cooled to room temperature to make samples.Figure 1 shows a photo of the samples fabricated for our measurement.The black spot corresponded to U,and the black-colored sample surface was analyzed with LIBS.The sample fabrication and LIBS measurements were conducted in a glove box with an atmosphere of Ar gas due to the deliquescence of the salt.The moisture and the oxygen content of the glove box were kept below 100 ppm.
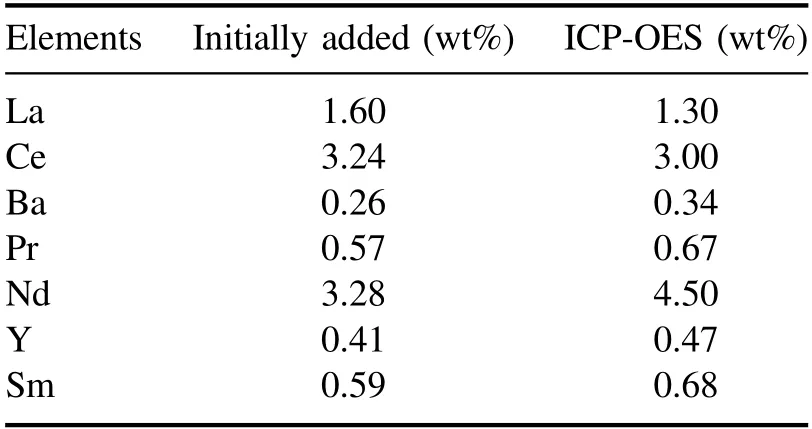
Table 1.Concentrations of rare-earth elements as determined by ICP-OES.
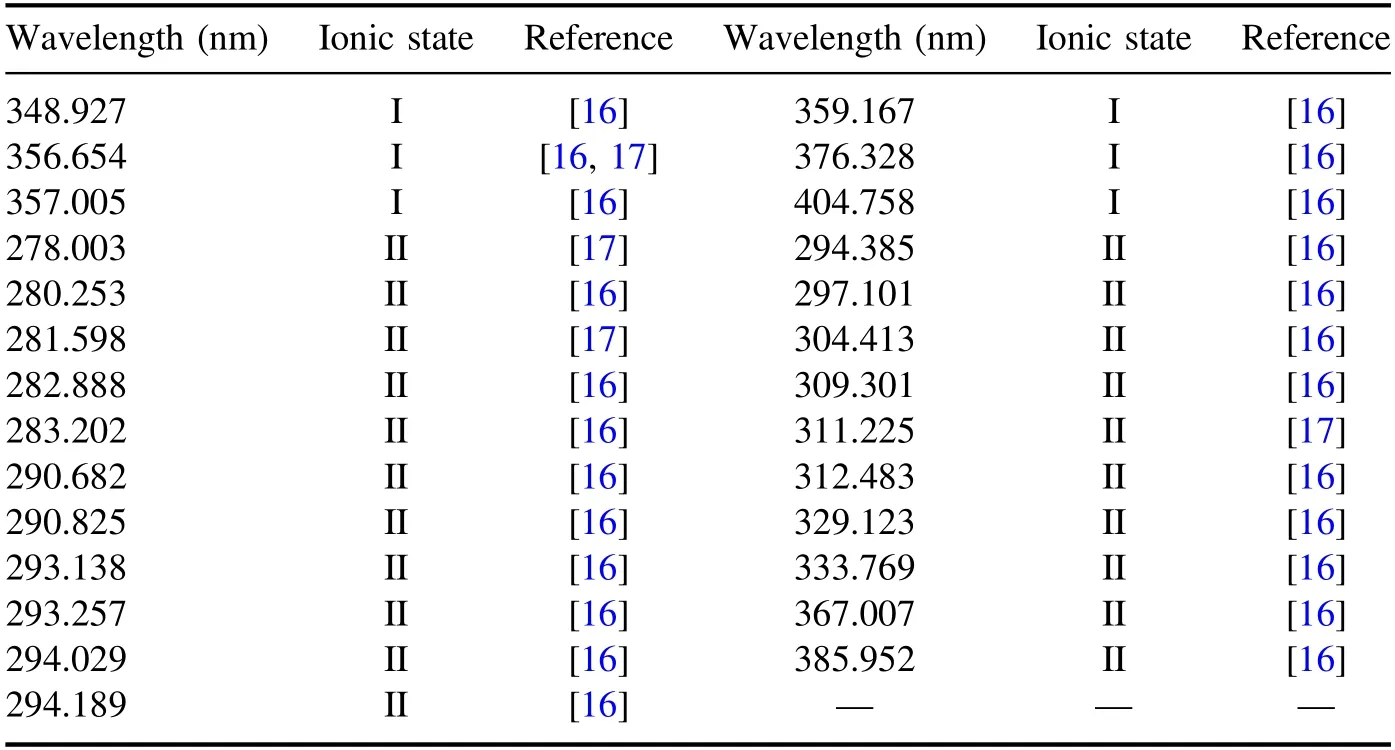
Table 2.Observed U lines in present work.
A schematic diagram of the experimental setup is shown in figure 2.A Q-switched Nd:YAG pulsed laser (Brilliant B,Quantel) with wavelength of 532 nm was placed outside the glove box.Laser pulse from the Q-switched Nd:YAG laser was injected through a light transfer port of the glove box.The direction of the laser pulse was changed by means of optical mirrors,and the laser pulse was incident on a sample surface to generate plasma.The laser pulse was focused by using a focusing lens with a focusing length of 100 mm.The energy of the laser pulse in the present work was ~11.5 mJ,and the frequency of the laser pulse was 10 Hz.The sample was positioned on an XYZ translation stage with automatic control.Laser beam from a laser-based distance measuring equipment (KEYENCE,LK-G150) was reflected by a Dichroic mirror,and incident on the sample surface,which was the same position as the incident pulse position of the Nd:YAG laser.The distance between the focusing lens and the incident pulse position on the sample surface was measured with the distance measuring equipment.Optimum distance was determined as a distance when the emission intensity from the plasma was maximized,and the optimum distance was maintained automatically in all the measurements by automatically moving the sample vertically.The emission light from the plasma was received by a focal lens with focusing length of 100 mm and transmitted through an optical fiber.Echelle spectroscopy with a resolving power of 20 000(λ/Δλ) was used in conjunction with an intensified chargecoupled detector to detect the plasma emission.The spectrometer gate delay and gate width were set to 800 ns and 50 μm,respectively.The emission lines from U and the other elements were measured in the wavelength region of 200–410 nm using the spectrometer,the energy of which was calibrated with a mercury light source.100 points on the sample were measured by moving the sample horizontally,and the measured data were averaged to obtain a data point for each sample.
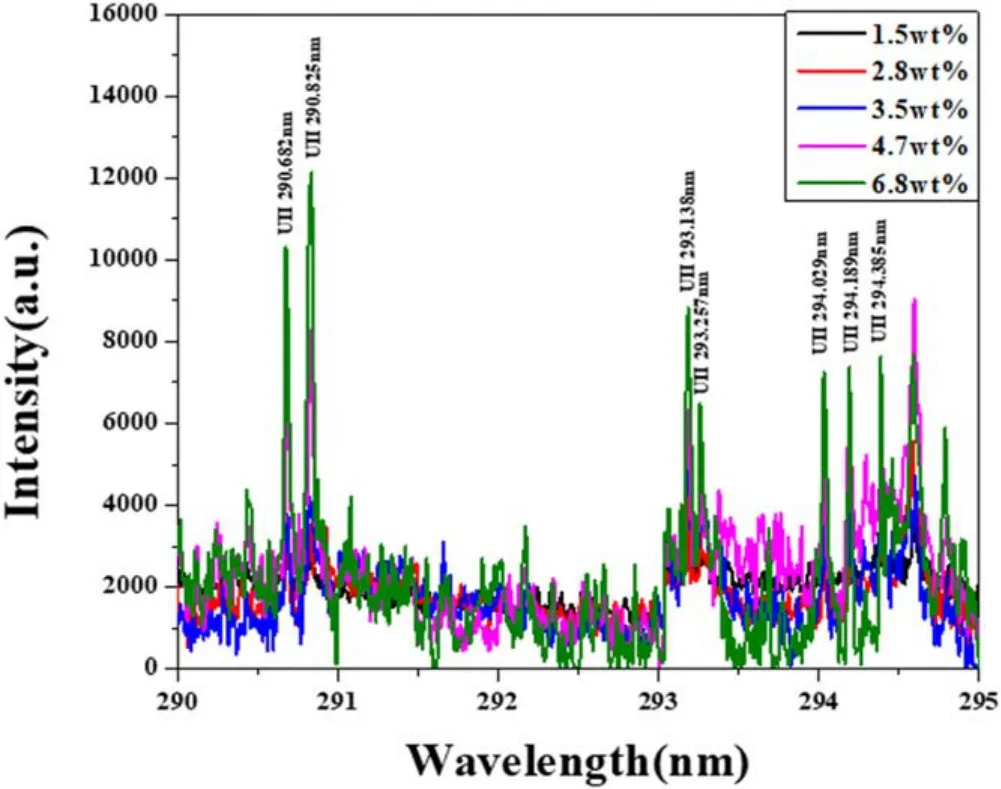
Figure 3.LIBS spectra of U in salt in different-concentration regions from 290 to 295 nm.
3.Results and discussion
In this study,selection of the U peak without interference from rare-earth peaks is important when U is mixed with various elements.Therefore,ICP-OES analysis was performed to confirm the RE in the prepared sample,which are shown in table 1.
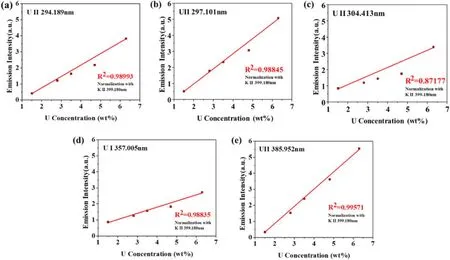
Figure 4.Univariate calibration curves constructed using ICP-MS concentration data for U:(a) 294.189 nm line,(b) 297.101 nm line,(c) 304.413 nm line,(d) 357.005 nm line,(e) 385.952 nm line.
Subsequently,LIBS analysis was performed to obtain the U-emission line in samples containing rare-earth elements.As a result,a total of 27 emission lines in the wavelength range of 200–410 nm were identified as shown in table 2,using the NIST atomic spectra database [16]and Kurucz databases[17].Figure 3 is a graph of the intensity according to U concentration in the region of the 290–295 nm spectrum where many U peaks would be expected to be detected.The higher the concentration of U,the higher the intensity.Strong peaks of Li,K and Cl were expected,because those were the major elements in the samples.However,the only identified strong K line was 399.180 nm,which was due to the overlap with other element lines.
Peak intensity measurements were used in the analysis.For this purpose,the background intensity was subtracted from the U-peak intensities as well as from the K 399.180 peak intensity.The U-peak intensity was normalized with the K 399.180 nm peak intensity.Figure 4 plots the univariate calibration curves of the five high-intensity U lines.Each point therein corresponds to the average of 100 measurements,and the error bars indicate the standard error.The peak intensity curves show linear trends in the relationship according to the U concentration by ICP-OES.The best R2value was 0.99571 for the U 358.952 nm line.However,this line was slightly overlapped with the Fe 385.991 nm line,as shown in figure 5.The spectrum is somewhat broadened,which was mainly caused by Doppler broadening [18,19].Doppler broadening is primarily due to the plasma temperature and the atomic mass of emitting species [20,21].Considering the above-mentioned causes and literatures,the Doppler broadening width in the present work is estimated to be about 0.030 nm,which is thought to affect the overlap of two lines in the figure 5.Thus,the best R2value other than that for U 358.952 nm was 0.9899 at the U 294.189 nm line.
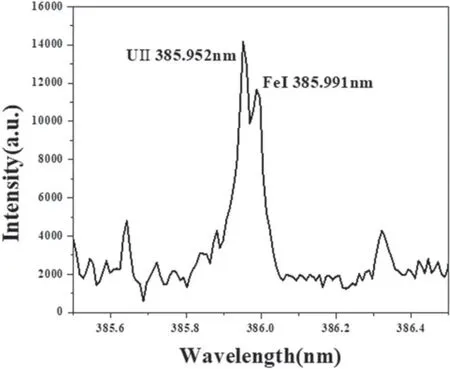
Figure 5.LIBS spectra of spectra showing 385.952 nm.
Table 3 shows the linearity,error and limit of detection(LOD) of the U calibration curves.The root means square deviation (RMSE),which evaluated the suitability of fit for a regression line,was calculated using the equation [15]
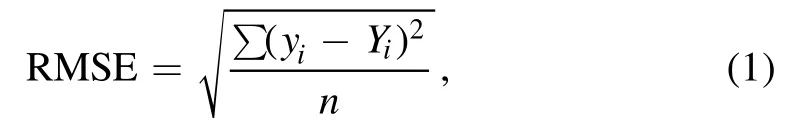
whereyistands for the mean intensity of the data points,Yifor the intensity of the regression line corresponding to the data points,and n for the number of data points.The best RMSE except that at U 358.952 nm was 0.104 98 at the U 357.005 nm line.
The root means square error of calibration(RMSEC)also was calculated,via
wherexi,LIBSrefers to the concentration of data points predicted from the calibration curve,andxi,DAis the known concentration of the sample as obtained from Destructive Analysis.The best RMSEC except that for U 358.952 was 0.3285 wt% at the U 357.005 nm line,and the average RMSEC of the 5 lines was 0.4707 wt%.
The LOD was calculated using the standard IUPAC definition of
where m is the slope of the calibration curve and σ is the standard deviation of the points with the lowest U concentration therein.The lowest and highest LODs were 0.942 wt%at the U 297.101 nm line and 0.2907 wt%at the U 304.413 nm line,respectively.The rather high LOD value may have been due to the surface roughness of the sample as well as the background increase incurred by the gate delay and gate-width setting when increasing the U-counting number.
Partial least-squares (PLS) regression modeling also was conducted to obtain a multivariate calibration curve.The PLS modeling was carried out using the commercial software package PLS toolbox (Unscrambler X,CAMO) [22].The average spectra over 10 spectra for each sample were used in the modeling.Only the spectrum region near the five U lines and one K line was included in the modeling.The RMSEC values as a function of the number of the latent variables are plotted in figure 6(a).It is shown that the RMSEC values were saturated over seven latent variables.Therefore,these seven latent variables were selected for modeling,and the PLS calibration curves for the U calculated using them are plotted in figure 6(b).The RMSEC was 0.415 wt% U,which is smaller than the average value from the univariate analysis.
In the results of this work,the differences between the univariate and PLS calibration methods were similar.The univariate analysis can provide slightly better results if an appropriate line is selected.The present work demonstrated that despite the spectral overlap between U and the rare-earth elements and Fe,quantitative U analysis is possible.
4.Conclusions
The U concentration in LiCl–KCl salt was analyzed with LIBS to demonstrate the possibility of using LIBS as a safeguard measure in pyroprocessing.Especially,rare-earth elements (La,Nd,Ba,Ce,Pr,Sm,Y),and Fe were added to the salt samples to determine the effect of peak overlap in the LIBS analysis.The U concentrations in the samples ranged from 1.5 wt%to 6.8 wt%,and the achieved values of RMSEC and LOD were 0.1031 wt% and 0.0942 wt%,respectively.Although the sampling procedure and its uncertainty has to be considered in estimating the applicability of LIBS to real situations,our results are promising with respect to the potential safeguarding application of LIBS.Between the univariate and the PLS analysis,the univariate approach showed better results.The benefit of PLS grows as the spectrum becomes complex,and PLS analysis will certainly play an important role in the analysis of spent-fuel contents in processed salt.
Acknowledgments
This work was supported by a grant from the National Research Foundation of Korea(NRF)funded by the Korean government(MSIP) (No.NRF-2017M2A8A5015084),and was partly supported by the Nuclear Safety Research Program through the Korea Foundation of Nuclear Safety(KoFONS)using financial assistance granted by the Nuclear Safety and Security Commission (NSSC) of the Republic of Korea (No.1903014).
 Plasma Science and Technology2020年7期
- Plasma Science and Technology的其它文章
- Influence of target temperature on femtosecond laser-ablated brass plasma spectroscopy
- Spectral characteristics of underwater laserinduced breakdown spectroscopy under high-pressure conditions
- A novel strategy for quantitative analysis of soil pH via laser-induced breakdown spectroscopy coupled with random forest
- Quantitative analysis of the content of nitrogen and sulfur in coal based on laserinduced breakdown spectroscopy:effects of variable selection
- Geographical authenticity evaluation of Mentha haplocalyx by LIBS coupled with multivariate analyzes
- Quantitative analysis of saindha salt using laser induced breakdown spectroscopy and cross-validation with ICP-MS