
Laser-induced plasma generated by a 532nm pulsed laser in bulk water:unexpected line-intensity variation with water temperature and the possible underlying physics
2020-07-09 04:19SandeepKUMARJeongPARK朴頂SangHoNAM南相好SongHeeHAN韓宋姬andYonghoonLEE勇勳
Plasma Science and Technology 2020年7期
Sandeep KUMAR,Jeong PARK (朴頂),Sang-Ho NAM (南相好),3,Song-Hee HAN (韓宋姬) and Yonghoon LEE (李勇勳),3
1 Department of Chemistry,Mokpo National University,Jeonnam 58554,Republic of Korea
2 Division of Navigation Science,Mokpo National Maritime University,Jeonnam 58628,Republic of Korea
3 Authors to whom any correspondence should be addressed.
Abstract
Keywords:laser-induced breakdown spectroscopy,liquid analysis,laser-produced bubble
1.Introduction
Laser-induced breakdown spectroscopy (LIBS) is an elemental analysis technique that uses optical emission spectra recorded for laser-induced plasmas.In typical LIBS analysis,a pulsed laser beam is focused on the surface of a solid sample,and this generates micro-plasmas by vaporizing and ionizing the atoms within the focused laser spot and the nearby ones.The plasmas dissipate energy they receive from the laser pulses mainly through optical emission in several tens of microseconds.The emitted light is accompanied by characteristic atomic and ionic lines that contain the information of the elemental composition of sample materials[1,2].It should be noted that materials in any phase such as solid,liquid,gas,and aerosol can be directly analyzed by LIBS.However,the analytical performances of LIBS for the liquid,gas,and aerosol samples,are inferior to those of the solid samples.In spite of relatively poor performances,the direct analysis capability of LIBS is still attractive for liquid or gaseous samples since it expands the applications of LIBS.There are LIBS applications to direct the analysis of liquid samples performed by focusing a pulsed laser beam on the air–liquid interface [3–6].However,in this configuration,splashes and aerosols are produced.They scatter the incident laser beam,interfere in the collection of optical emissions,contaminate focusing and collection optics,and change the height of the air–liquid interface.To mitigate these effects,liquid samples are prepared in other forms such as jets,laminar flows,and droplets [7–9].Also,the performance can be remarkably improved by transforming liquid samples to solid ones.Various absorbing media and supporting solids have been used for this purpose[10–13].However,the liquidto-solid sample transformation requires additional sample preparation works.
Another means of analyzing liquids by using LIBS is focusing a pulsed laser beam on the liquid samples.This type of LIBS application can be categorized into two groups,one is the analysis of dissolved ions or dispersed particles in the liquid matrix and the other is that of submerged solid samples[14,15].Herein,the discussion is focused on the former.Yun et al [16]applied LIBS to analyze europium (III) oxide and hydroxide in bulk water.This indicated that LIBS can be used to detect rare earth or radioactive elements in water with a minimized sample treatment.The direct analysis capability of bulk water has also been applied for a high-pressure CO2-water mixture[17–19].This demonstrates the feasibility of LIBS as a groundwater quality monitoring tool particularly for the water into which CO2gas leaks from geologic carbon storage such as deep saline aquifers.However,in this configuration,a relatively larger laser energy than that used for the LIBS analysis performed in open air is necessary to ignite the plasma [14].Much of the focused laser energy is consumed in vaporizing the liquid,forming bubbles,and then letting the bubbles expand against the ambient liquid.The bubbles can scatter the incident laser beam to reduce the effective energy delivered to the plasma ignition point.As a result,the plasma temperature is relatively low and fluctuates and deteriorates the precision of the analysis.Double-pulse(DP) LIBS has been found to be effective in improving the analytical performance of bulk water samples.At the early stage of developing LIBS,Cremers et al [20]demonstrated the capability of DP-LIBS in detecting Li,Na,K,Rb,Cs,Be,Mg,Ca,B,and Al in aqueous solutions.Typically,it uses two sequential pulses,the leading pulse vaporizes the liquid to form a gas bubble and the following one ignites plasma[21].However,if a single-pulse (SP) LIBS configuration provided an adequate performance,this would be advantageous to develop a simple and rapid methodology for liquid analysis based on LIBS.
It should be noted that the direct analysis capability of LIBS for bulk water enables LIBS to be utilized as an in situ analysis tool for ocean water.Guo et al [22]applied a compact SP-LIBS spectrometer to analyze deep seawater down to ~1800 m below the sea surface.Thornton et al[23]developed a unique SP-LIBS spectrometer using a long-pulse laser (>150 ns) and demonstrated field analysis of both seawater itself and submerged solid matters such as hydrothermal deposits between 0 and 1000 m below the sea surface.The long-pulse laser has been found to be effective in improving the LIBS performance for the analysis of solid targets submerged in water [24].Recently,the effect of ambient water pressure on laser-induced plasma has been studied in detail [25–28].This has been largely motivated by the potential application of LIBS in deep-sea exploration.Also,the effects of the concentration of sodium compounds,the configuration of the focusing laser beam,and the usage of DP-LIBS have been investigated so far [26,29–34].However,for the temperature of the liquid samples,studies of its effect on the LIBS performance are very rare.Michel et al[25]found that temperature had no effect on the Ca I line intensity measured for an aqueous solution over the temperature range of 27 °C–99 °C.Recently,Li et al [35]observed an increasing trend in emission intensity as the temperature of an aqueous solution increases,and this was correlated to the variation of plasma temperature and electron density with ambient temperature.The results reported previously do not seem to be consistent with each other.This implies that the influence of the liquid temperature on the plasma properties may be nonlinear and the temperature-dependent liquid property changes a few plasma parameters,not a single one,responsible for the observed variation of optical emission intensities.
In this work,we investigated the effect of liquid temperature on emission intensities detected for a laser-induced plasma generated in the bulk aqueous solution of CaCl2.The Ca I and II line intensities were recorded at liquid temperatures ranging from 7 °C–70 °C.Both the Ca I and II lines showed maximum intensities at ~18 °C.This is well correlated to the plasma temperature variation.An underlying mechanism responsible for this observation is suggested based on plasma temperature,electron density,scattered light intensity from the plasma center,and plasma ignition threshold energy.Scattering the incident laser beam by the laser-produced bubbles can have a significant influence on the plasma’s thermodynamic property.This process was found to depend strongly on the temperature of the aqueous solution.The bubbles became too abundant at the higher temperatures to deliver the incident laser beam to the plasma ignition point without scattering an significant amount of laser energy.However,bubble formation is the inevitable prerequisite process for igniting plasma in bulk liquid.As the temperature of the aqueous solution increased,the plasma ignition threshold energy decreased.This might be due to the consumption of a larger amount of energy to form bubble cavitation prior to plasma ignition at the lower temperature.Our results indicate that the liquid temperature should be considered as an important factor that affects the performance of LIBS analysis of bulk water.

Figure 1.Experimental setups for (a) recording LIBS spectra,(b) measuring the scattered He-Ne laser intensity,and (c) taking pictures of laser-produced bubbles.
2.Experimental method
Figure 1(a) shows a schematic diagram of the experimental setup.A laser beam from a flash-lamp-pumped Q-switched Nd:YAG laser (LS-2131M,LOTIS TII) was focused in the aqueous solution of CaCl2through a plano-convex lens with a 1 inch diameter and 70 mm focal length.The concentration of the CaCl2compound was set to 3000 ppm,which is equivalent to 1083 ppm of Ca.Wavelength,pulse duration,repetition rate,diameter,and pulse energy of the laser beam were 532 nm,~10 ns,10 Hz,5 mm,and 50 mJ/pulse,respectively.The aqueous solution of CaCl2was contained in a 100 ml cylindrical glass container.To cool the aqueous solution,cold water was circulated between the iced water reservoir and the bath in which the lower part of the sample container was immersed.To heat the solution,a temperaturecontrolled heating plate was used.Above 70 °C,water vapor was generated and condensed on the nearby optics within the measurement time.Below 7 °C,water vapor in the air began to condense on the glass container within the measurement time.Thus,the experiments were performed at water temperatures ranging from 7°C–70°C.Optical emission from the plasma was imaged on the optical fiber’s end surface using two plano-convex lenses with a 1 inch diameter.The lens placed near the plasma center has a focal length of 70 mm and the other has one of 30 mm.Herein,a linear-to-linear optical fiber bundle was used.It has seven optical fibers with a 105 μm diameter in series.The length of the series of seven fiber cores is 0.9 mm.This linear optical fiber bundle is effective to collect the optical emission from the plasma in a linear shape.The other end of the fiber bundle was fed into a Czerny–Turner type spectrometer (50 cm focal length,DM-500i,Dongwoo Optron) coupled with an intensified chargecoupled device (ICCD) camera (1024×512 pixels,iStar,Andor Technology).A grating with 1200 grooves per millimeter blazed at 300 nm was installed in the spectrometer.The spectral resolution of the spectrometer (Δλinstrument) was estimated to be less than 0.1 nm from the full width at half maximum (FWHM) of the Hg I emission line.The ICCD detection gate with a 10 μs width was synchronized with the Q-switching of the laser with a delay of 0 μs.LIBS spectra were recorded in the wavelength region between 389 and 430 nm,where relatively strong Ca I and II emission lines were observed.For recording each LIBS spectrum,optical emissions generated by every 1000 laser pulses were accumulated.In order to get relatively accurate intensity values in the wavelength region,the sensitivity of the ICCD camera was corrected by using a halogen lamp calibrated for the absolute irradiance(HL-3 plus,Ocean Optics).Light intensity scattered from the area of laser-induced plasma and acoustic wave spectra were also measured along with the LIBS spectra(figure 1(b)).For the scattered light measurement,a continuous-wave He-Ne laser beam (11.3 mW,632.8 nm,HRP120-1,Thorlabs) was fed through the center of the plasma.Using the same collection lenses used to record LIBS spectra,scattered light at 632.8 nm was detected through an optical fiber (200 μm core diameter) by a hand-held CCD spectrometer (USB4000,Ocean Optics).In front of the optical fiber entrance,a long-pass filter (λcut-off=600 nm) was placed to cut off the strong scattered Nd:YAG laser beam.The bubbles produced by a single laser pulse were observed using a digital microscope(5 M pixels,30 frames per second,AM7013MT Digital Microscope Premier,Dino-Lite).A video was recorded through the long-pass filter by the digital microscope to observe the generation of bubbles by the focused laser beam and to estimate the lifetime of the bubbles(figure 1(c)).

Table 1.Spectroscopic parameters of the observed Ca I and II emission lines.

Figure 2.LIBS spectra recorded at t=7°C,20°C,and 70°C.The Ca II lines at 393.366 and 396.847 nm and the Ca I lines at 422.673,428.301,428.936,and 429.899 nm are indicated.
3.Results and discussion
3.1.Line-intensity variation
Figure 2 shows the LIBS spectra recorded at different temperatures of the sample solution,t=7°C,20°C,and 70°C,in the wavelength region between 389 and 430 nm.Ca II lines at 393.366 and 396.847 nm and Ca I lines at 422.673,428.301,428.936,and 429.899 nm were indicated in the LIBS spectra.These assignments were based on the NIST Atomic Spectra Database [36].The spectroscopic parameters of the observed Ca I and II lines are listed in table 1.Aijis the Einstein coefficient which is the probability of spontaneous emission from the upper level to the lower level.Eiand Ejrepresent the energy values and giand gjare the statistical weights.i and j indicate the upper and lower levels involved in the spontaneous emission,respectively.It is clearly visible that both Ca I and II lines at t=7 °C and 70 °C are weaker than the corresponding lines observed in the LIBS spectrum recorded at t=20 °C.To explore this behavior,we have studied the LIBS spectra at the intermediate temperatures.
Figures 3(a) and (b) show the intensity variations of the Ca II lines at 393.366 and 396.847 nm and the Ca I line at 422.673 nm with t ranging from 7 °C–70 °C.Each intensity value was estimated by taking the peak area after subtracting the baseline.The error bars in figures 3(a)and(b)represent a standard deviation,σ,of intensity values from three repeated measurements.Both the ionic and atomic lines show similar intensity variations.In each intensity profile,the maximum value is observed at t=~18 °C.From the maximum value,the intensity becomes weaker as t is increased or decreased.This reveals the existence of temperature-dependent phenomena that affect the properties of the plasma generated in the bulk liquid solution.The relative standard deviations(RSDs) estimated from the three repeated measurements are plotted with respect to t in figure 3(c).It is shown that the intensity fluctuation also depends on the aqueous solution temperature.The RSDs are less than 20% at t < 50 °C.However,they increase further as t goes higher.
3.2.Plasma temperature
Plasma temperature and electron density were estimated to find the underlying physical process responsible for the observed t-dependent intensity variation.The plasma temperature was calculated using the Boltzmann-plot method based on the following equation where k,Iij,ns,T,and Us(T)are the Boltzmann constant,the observed intensity,the number density of a species,s,which is herein Ca I or Ca II,the plasma temperature,and the partition function of the species at T,respectively.

Plotting ln(Iij/giAij)as a function of Ei,the temperature T can be determined from the slope of the line,-1/kT.Herein,the three Ca I lines at 422.7,428.3,and 428.9 nm were employed to estimate T.The spectroscopic parameters of those Ca I lines can be found in table 1.Figure 4 shows the variation of T with t and the uncertainties of T,ΔT,which is a standard deviation of T values estimated from three repeatedly recorded LIBS spectra.The ΔT/T ratios are in the range of 0.02–0.13.The correlation between T and t is not linear in our experiment.The variation of T looks very similar to those of ICaIIand ICaIas shown in figure 3.The maximum T was observed at t=~19 °C.This is very close to t at which the strongest Ca I and II emissions were observed.
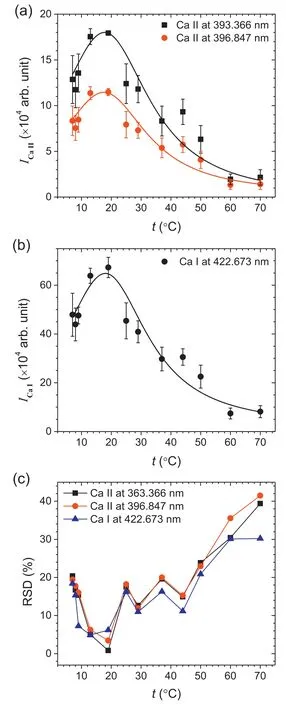
Figure 3.Intensity values of (a) the Ca II lines at 393.366 and 396.847 nm,(b) the Ca I line at 422.673 nm,and (c) RSDs at different temperatures ranging from 7 °C–70 °C.The error bars in panels (a) and (b) represent the 1σ value of the three repeated measurements.

Figure 4.Plot of plasma temperature,T,as a function of the solution temperature,t(lower),and the standard deviation of T,ΔT estimated from three repeatedly measured LIBS spectra (upper).
3.3.Effect of refractive index
Figure 5(a) shows a change in the focusing angle when the laser beam propagates from air to water assuming that the laser beam enters water directly.The refractive index of water,nwater,for the wavelength of 532 nm was calculated from 0 °C–100 °C using the Cauchy formula (figure 5(b))[37].The nwatervalues at 7 °C,18 °C,and 70 °C are 1.3390,1.3383,and 1.3305,respectively.From this calculation,only~0.6%of the refractive index(0.0085)is found to be changed by increasing t from 7 °C–70 °C.Li et al [35]reported that the change in the refractive index of water from 0°C–60°C is less than 2%for a 1064 nm laser and this has little correlation with the plasma morphology and emission intensity.Based on Snell’s law,nairsinθair=nwatersinθwater[38],the focusing angles in the water,θwater,were calculated and plotted in figure 5(b).The θwatervalues at 7 °C and 70 °C are 1.5280°and 1.5374°,respectively.The distance between the focusing lens (f=70 mm) to the air–water interface is 55 mm.Thus,the laser beam diameter decreases from 5–1.1 mm at the air–water interface.Considering the different θwatervalues at 7°C and 70 °C,the distance from the air–water interface to the focal point is estimated to be 20.62 and 20.49 mm,respectively.This indicates that the focusing condition was not significantly affected by the refractive index change due to the different t.Also,the difference,0.13 mm,is smaller than the width of the linear optical fiber bundle (0.9 mm),so the collection efficiency was almost constant from t=7 °C–70 °C.

Figure 5.(a) Laser beam propagation from air to water and (b) nwater and θwater.
3.4.Electron density and self-absorption effect
Electron density in the plasma generated at each t was estimated from the broadening of the Ca I line at 422.673 nm.The observed line width,Δλobserved,was contributed by the Stark broadening,ΔλStark,and the limitation of the spectrometer’s resolution,Δλspectrometer; Δλobserved=ΔλStark+ Δλspectrometer.Δλspectrometerwas limited by the width of the slit-type optical fiber bundle,200 μm,because the entrance slit of the spectrometer was opened more widely than that.Under this condition,Δλspectrometerwas estimated to be 0.2 nm by recording the emission spectrum of a mercury lamp.Thus,ΔλStarkcan be obtained by subtracting Δλspectrometer=0.2 nm from Δλobservedwhich was taken as the FWHM of the Ca I line at 422.673 nm.Then,the electron density in cm-3can be estimated using the following equation [39]:
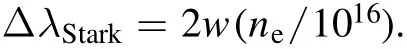
In the above equation,ΔλStarkis in nanometers and w and nerepresent the electron impact parameter and the electron density,respectively.The w values of the Ca I line at 422.673 nm at each plasma temperature were obtained based on those at T=5000 K and 10 000 K [40].Figure 6(a) shows the variation of newith t.At the t higher than ~18°C,nedecreases monotonously.This is similar to those of ICaI,ICaII,and T(figures 3 and 4).The decrease in neindicates that the ionization temperature follows T,the electronic excitation temperature.However,at the lower t,the variation of neseems different from those of ICaI,ICaII,and T.To reveal the cause,a precise timeresolved study on the bubble’s dynamics before ~10 μs and its effect on the thermodynamic properties of the laser-induced plasma is in progress.
If the Ca I line at 422.673 nm was significantly affected by self-absorption,its line profile would be distorted.Then,the estimation of nebased on Δλobservedmay not be reliable.Self-reversal,the central dip in the emission line profile,can be observed due to strong self-absorption.The Ca I line profiles are shown in figure 6(b).Any discernible traces of self-reversal cannot be found in those profiles.To check whether the Ca I line was affected by self-absorption or not,ICaIvalues were measured for the solutions with 3000 and 1500 ppm CaCl2.In the case that the intensity ratio of the ICaIline measured for the solution with 3000 ppm CaCl2,ICaI(3000 ppm CaCl2),and that measured for the solution with 1500 ppm CaCl2,ICaI(1500 ppm CaCl2),is much lower than 2,the decrease in sensitivity can be attributed to the selfabsorption effect.If the ratio of ICaI(3000 ppm CaCl2)/ICaI(1500 ppm CaCl2) is close to 2,then the self-absorption can be regarded to be negligible.The Ca I line profiles were observed for the solutions with 3000 and 1500 ppm CaCl2at t=10 °C,25 °C,and 60 °C and they were fitted using the Lorentzian function to get the peak area values.The Ca I line profiles recorded at t=25 °C and their Lorentzian fits were shown in figure 6(c).The ICaI(3000 ppm CaCl2)/ICaI(1500 ppm CaCl2) values are plotted in figure 6(d).At t=10 °C,25 °C,and 60 °C,the ratios were obtained to be 2.266 ±0.016,2.058 ± 0.014,and 1.942 ± 0.017,respectively.From this result of ICaI(3000 ppm CaCl2)/ICaI(1500 ppm CaCl2),which is close to 2,we can find that the profiles of the Ca I line at 422.673 nm is not significantly affected by selfabsorption.
3.5.Light scattering by bubbles
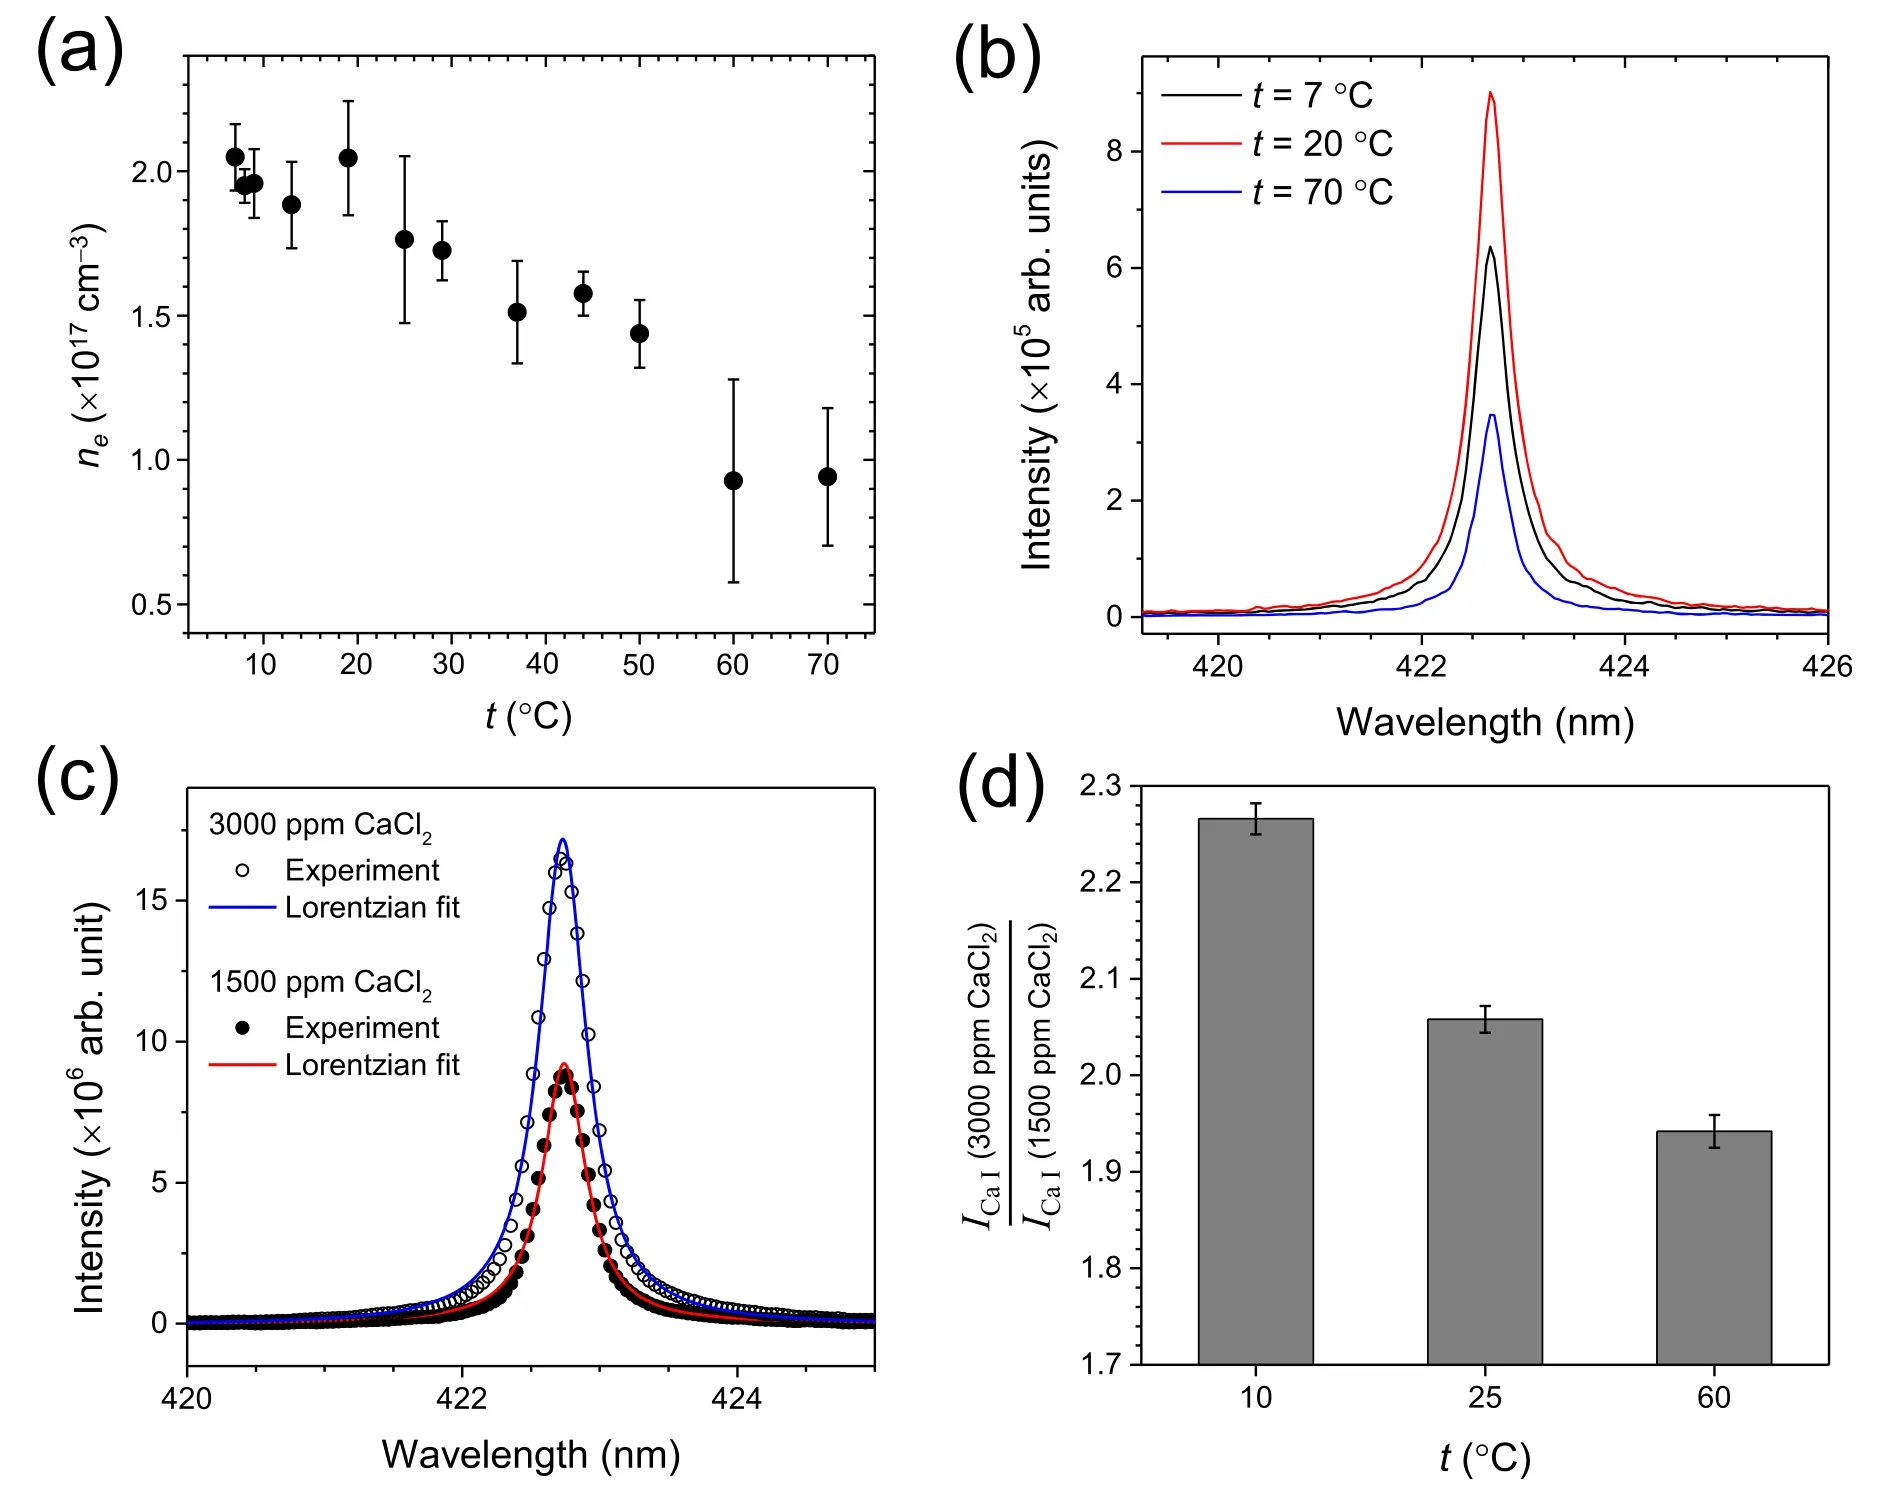
Figure 6.(a)Electron density variation with t,(b)line profiles of the Ca I line at 422.673 nm observed at t=7°C,20°C,and 70°C,(c)the Ca I line profiles observed for the solutions with 3000 ppm and 1500 ppm CaCl2 at t=25°C and their Lorentzian fits,and(d)the ratios of ICaI measured for the solution with 3000 ppm CaCl2 and that for 1500 ppm CaCl2 at t=10°C,25°C,and 60°C.The error bars represent 1σ of three repeated measurements.
The t-dependent process that decreases the incident laser pulse energy prior to igniting the plasma might be light scattering by laser-produced bubbles.Feeding a separate continuous-wave He-Ne laser through the plasma center,the spectra of scattered light were recorded at different solution temperatures.The scattered light was collected using the same optics used for recording the LIBS spectra.Thus,the measured intensity at 632.8 nm was due to the scattering at the plasma center.The scattered light spectra are shown in figure 7(a).When the plasmas were not generated by blocking the pulsed laser beam,the intensity at 632.8 nm was negligible (see the bottom panel in figure 7(a)).However,with generating the plasmas,the intensity at 632.8 nm increased as t was elevated from 7°C–65°C.The integrated peak areas at 632.8 nm measured at t=7°C,24°C,40°C,and 65°C are compared in figure 7(b).This observation can be attributed to the more effective production of bubbles by the pulsed laser at the higher t.The formation of a cavitation bubble is an essential prerequisite to ignite the plasmas in the liquid.The plasma is then generated inside the cavitation bubble.
Typically,the lifetime of plasmas produced in bulk water is in the range from a few to ten microseconds.However,the bubbles’ lifetime is longer than that,and they diffuse and accumulate in the solution.To check how long the laserproduced bubbles survive,a single laser pulse with 50 mJ was focused in the aqueous solution at t=20 °C and a digital video was taken using the experimental setup shown in figure 1(c).An LED lamp was used for illumination.Eight images were taken from the video and are shown in figure 8 along with the time delay from the moment when the image in figure 8(a) was taken.The focal plane of the digital microscope was set at the horizontal plane on which the laser beam propagated.Figure 8(a) shows an image of the aqueous solution before the laser was operated in the SP mode.The image in figure 8(b) shows the laser beam propagating from the lower right to the upper left side.The bright yellow spots in the laser beam path are the laser-produced bubbles,which did not exist before the laser stroke (see figure 8(a)).After the generation of the bubbles,one of them is traced (see the yellow spot indicated by the arrows in figures 8(c)–(h)).The traced bubble is found to survive at least for 2.6 s.Most of the other bubbles could still be observed as shown in figure 8(h).This observation indicates that the lifetime of the laser-produced bubbles is a few seconds in our experimental condition.The pulsed laser was operated at 10 Hz in this work.The bubbles’lifetime is longer than the interval between the laser pulses(0.1 s).Thus,the bubbles produced by a laser pulse were accumulated to scatter the following laser pulse.
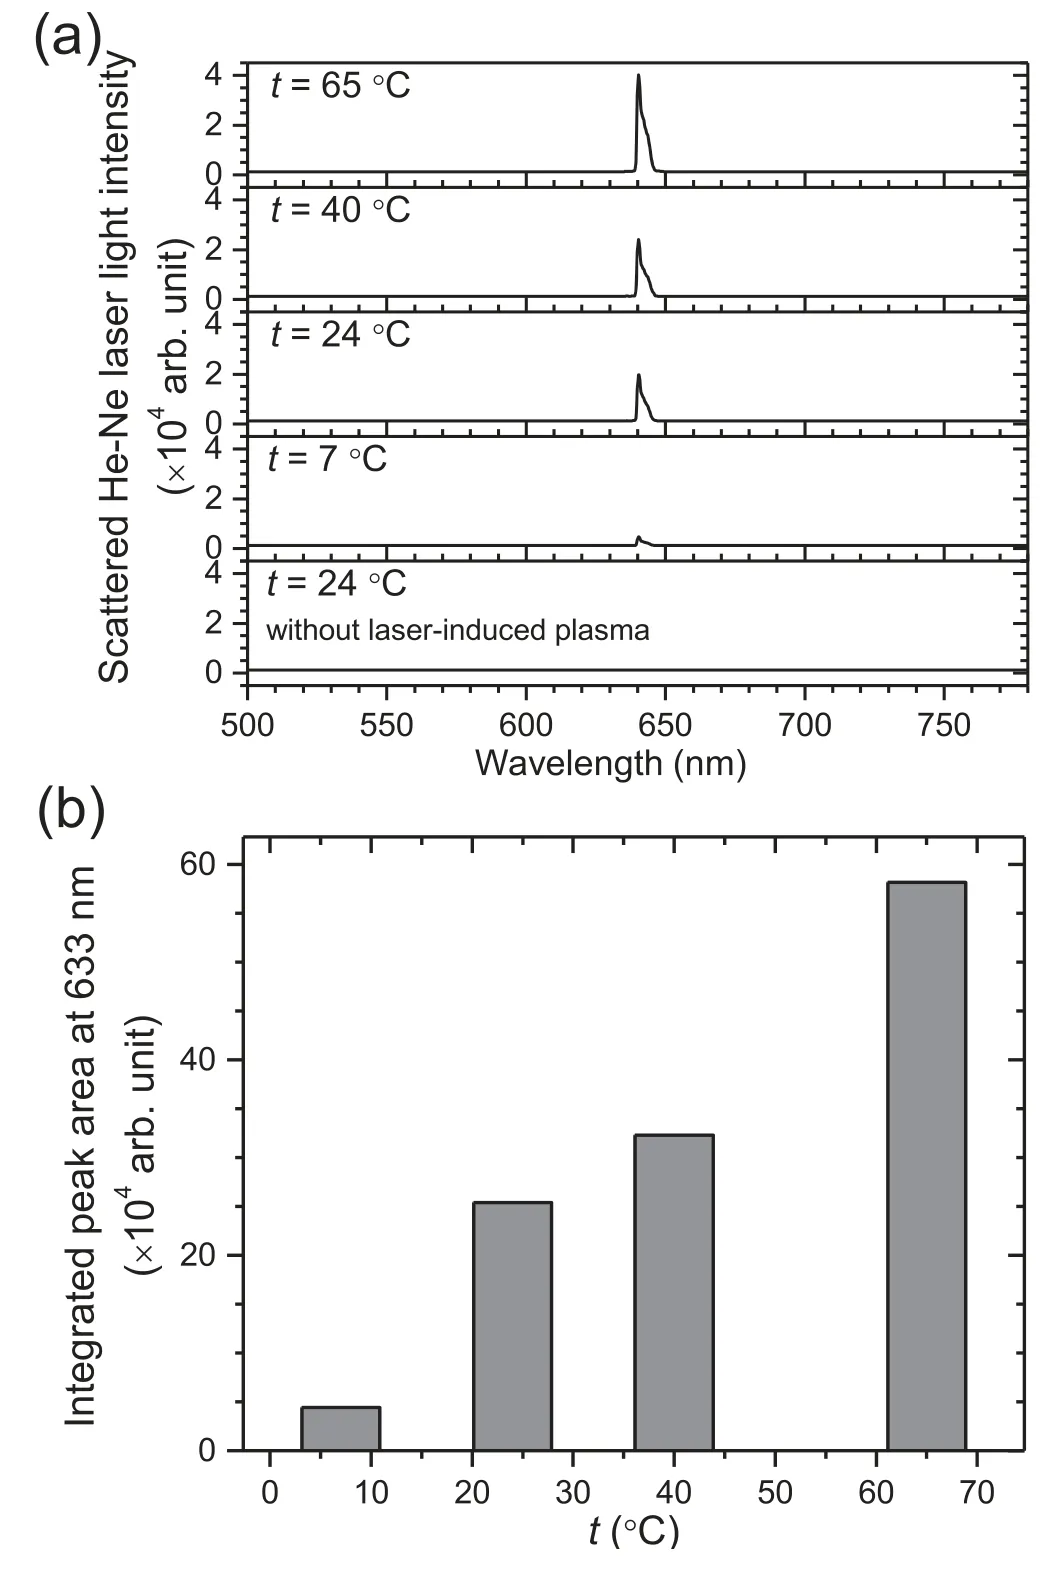
Figure 7.(a) Spectra of the scattered He-Ne laser light recorded at t=7°C,24°C,40°C,and 65°C during the generation of plasmas and(b)integrated areas of the peak at 633 nm observed in the spectra in (a).In (a),the bottom panel shows the spectrum recorded at t=24 °C without generating plasmas.
Figure 9 shows digital microscope images of the long plasma channels formed in the aqueous solution at t=7 °C,25 °C,and 70 °C.In each panel of figure 9,the plasma channel is indicated by a rectangular box and a scale bar is inserted for a rough estimation of the plasma length.The signal collection area (2.1 ×0.25 mm2) was estimated by considering the magnification of the two-lens collection optics and the core size of the linear fiber bundle and is indicated by the smaller box in figure 9(a).In the images taken at t=7°C and 25°C,a few bubbles diffused from the plasma area are indicated by the arrows(figures 9(a)and(b)).However,in the image taken at t=70 °C,plenty of bubbles are discernible.Consequently,the pulsed laser beam focused in the aqueous solution produces relatively more bubbles at the higher t,which accumulate nearby the plasma and effectively scatter the following laser pulses to be used for the plasma ignition.As well as the decrease in intensity values,the larger fluctuation of the intensity at the higher t can be attributed to the light scattering by the abundant bubbles(see figure 3(c)).
3.6.Plasma ignition threshold
The decrease in ICaI,ICaII,and T from t=18°C–70°C can be rationalized on the basis of the scattering of an incident pulsed laser beam by bubbles formed more effectively at the higher t.However,the behaviors of ICaI,ICaII,and T below t=18 °C seem to be different from this trend.Those rather decrease as t decreases,although the scatterers (the laserproduced bubbles) are less abundant at the lower t.As above mentioned,the bubble formation is the first indispensable process to generate laser-induced plasmas in the bulk liquid.The opposite trend in the lower t region can be explained by the amount of laser pulse energy consumed by plasma ignition.The ICaIIvalues measured at t=5°C,18°C,and 60°C are compared in figure 10.These measurements were performed in the vicinity of the plasma threshold energy.For each solution temperature,t,the lowest ICaIIvalue is indicated by an arrow in figure 10.From the comparison of the lowest ICaIIvalues,it is found that the plasma ignition threshold energy is lowered by elevating t even though the bubbles would be more abundant and thus the scattering loss of the incident laser pulse energy could be more effective at the higher t.This observation indicates that a larger amount of laser pulse energy is consumed to ignite the plasma at the lower t.The formation of bubble cavitation probably demands more energy at the lower t.Consequently,a bubble is found to play two opposite roles in the generation of laser-induced plasmas in the bulk liquid,one is a scatterer of incident laser beam and the other is a cavitation in which the plasma is ignited.Both effects are however dependent on the liquid temperature in opposite ways.
It should be noted that the order of emission line intensities measured at t=5°C,18°C,and 60°C using the lower laser energy (figure 10)is different from that measured using the higher laser energy,50 mJ/pulse (figure 3).When the laser energy of 50 mJ/pulse was used,the order of emission intensities was ICaII(and ICaI)at 18°C > ICaII(and ICaI)at 5 °C > ICaII(and ICaI) at 60 °C.However,using the lower laser energies of a 15.9 and 12.4 mJ/pulse,ICaIIat 5 °C became lower than that at 60°C,and a further decrease in the laser energy made ICaIIat 60°C stronger than the others.This observation indicates that the emission intensity is mainly dominated by the plasma ignition threshold energy that depends on the aqueous solution temperature,t.
4.Conclusions
Laser-induced plasmas were generated in the aqueous solution of CaCl2at different solution temperatures,and the emission line intensities of Ca I and II were measured.The intensity variation with the solution temperature showed a strong correlation with the plasma temperature.This indicated that the coupling efficiency between the laser pulse energy and the plasma is affected significantly by a certain temperature-dependent process.Formation of cavitation bubbles and their scattering of incident laser light were suggested for the underlying physics of the observed intensity variation.Forming bubbles by focusing a laser beam in water is a temperature-dependent process.However,the two roles of the bubbles have opposite effects on the laser-induced plasmas.Bubble formation is the indispensable precedent step to ignite plasmas and consumes a significant amount of laser pulse energy.This reduces the laser pulse energy to be delivered to the plasma.In the other way,bubbles act as scatterers of the incident laser beam to decrease the laser pulse energy to be delivered to the plasma.These two roles depend on the water temperature in opposite ways.Consequently,the observed intensities were maximized at a certain temperature,herein~18 °C.
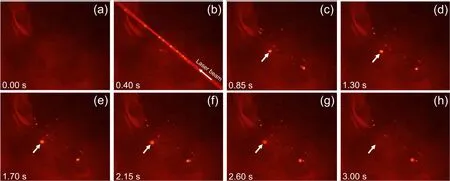
Figure 8.Images taken from a video recorded by a digital microscope.The time delay from the moment when the image in(a)was taken is noted in each panel.In(b),the laser propagation direction is indicated by the arrow.In(c)–(h),one of the laser-produced bubbles is traced by the arrows.
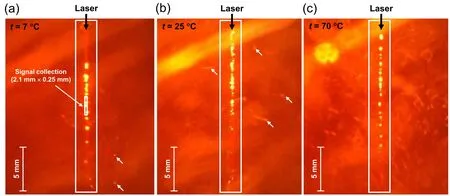
Figure 9.Digital microscope images of the plasma channels generated at t=7 °C (a),25 °C (b),and 70 °C (c).In each panel,the plasma channel is indicated by the rectangular box,a scale bar is inserted for a rough estimation of the plasma length,and the laser propagation direction (from the top to the bottom of the image) is indicated by the black arrow.In (a),the smaller rectangular box indicates the signal collection area(2.1 ×0.25 mm2).In(a)and(b),a few bubbles diffused from the plasma area are indicated by the white arrows.In(c),the image taken at t=70 °C shows plenty of bubbles.
The temperature at which the energy coupling efficiency from laser to plasma is maximized probably depends on the configuration of the focusing optics.Therefore,the LIBS intensity could show either an increasing or a decreasing trend with elevating the water temperature.In this work,a single plano-convex lens with f=70 was used as a focusing optics and may not be the optimum configuration to suppress the energy consumption by bubble formation.By optimizing the focusing optics,a simple increase in the LIBS emission intensity could be observed as the temperature goes higher.Herein,the laser beam at the wavelength of 532 nm was used to ignite the plasma in the aqueous solution.However,a 1064 nm laser is more widely used in underwater LIBS studies because the higher plasma temperature and electron density,the longer the plasma lifetime,and the better signalto-noise ratios are attainable with a 1064 nm laser than those with a 532 nm laser [33].Therefore,it should be noted that the temperature effect observed with a 532 nm laser may be different from that with a 1064 nm laser.The absorption coefficient of water is minimized around 532 nm,and increases as the wavelength becomes longer.The absorption coefficient at 1064 nm (14.5 m-1) is greater than that at 532 nm(0.043 m-1)by a factor of ~340[41].Thus,the laser energy coupling efficiency would be better at 1060 nm in comparison with that at 532 nm.This may also lead to different behaviors of emission variation between the plasmas generated 532 and 1064 nm laser beams.
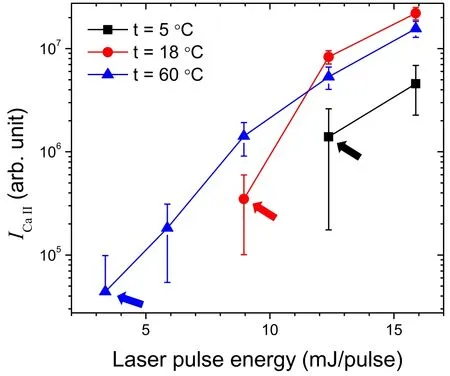
Figure 10.Variation of ICaII with a laser pulse energy close to the plasma ignition threshold at t=5 °C,18 °C,and 60 °C.The weakest ICaII value is indicated by the arrow for each solution temperature t.
Acknowledgments
This work was supported by the Korea Basic Science Institute(KBSI) National Research Facilities & Equipment Center(NFEC)grant funded by the Korean government(Ministry of Education) (No.2019R1A6C1010005).The authors thank Ms.Lindsay Ross for her careful proofreading.
 Plasma Science and Technology2020年7期
- Plasma Science and Technology的其它文章
- Influence of target temperature on femtosecond laser-ablated brass plasma spectroscopy
- Spectral characteristics of underwater laserinduced breakdown spectroscopy under high-pressure conditions
- A novel strategy for quantitative analysis of soil pH via laser-induced breakdown spectroscopy coupled with random forest
- Quantitative analysis of the content of nitrogen and sulfur in coal based on laserinduced breakdown spectroscopy:effects of variable selection
- Geographical authenticity evaluation of Mentha haplocalyx by LIBS coupled with multivariate analyzes
- Quantitative analysis of saindha salt using laser induced breakdown spectroscopy and cross-validation with ICP-MS