
Improvement in classification accuracy of stainless steel alloys by laser-induced breakdown spectroscopy based on elemental intensity ratio analysis
2020-07-09 04:20SunghoSHINYoungminMOONJaepilLEEEunsungKWONKyihwanPARKandSunghoJEONG
Plasma Science and Technology 2020年7期
Sungho SHIN,Youngmin MOON,2,Jaepil LEE,Eunsung KWON,Kyihwan PARK and Sungho JEONG
1 School of Mechanical Engineering,Gwangju Institute of Science and Technology,1 Oryong-dong Buk-gu Gwangju 500-712,Republic of Korea
2 Engineering Solution Research Group,Research Institute of Industrial Science and Technology,67 Cheongam-ro Nam-gu Pohang-si Gyeongsangbuk-do,Republic of Korea
Abstract
Keywords:laser-induced breakdown spectroscopy(LIBS),stainless steel,classification,intensity ratio
1.Introduction
According to the International Stainless Steel Forum,worldwide stainless steel consumption in recent years has been steadily increasing [1].Stainless steels are iron-base alloys containing a minimum of about 12% chromium to enhance corrosion resistance and are classified into various types and grades depending on composition and microstructure [2].Because stainless steels contain valuable raw materials like chromium,nickel,manganese and molybdenum,and their production is costly,recycling is strongly required at the end of the useful life of stainless steel products.For example,a study for recycling by Johnson et al[3]reported that if stainless steels were to be produced solely from scrap,energy consumption and environmental pollution would be reduced by approximately 70%.Furthermore,since stainless steels are produced in various types and grades,depending on elemental compositions[4],sorting by type and grade is necessary for effective recycling of stainless steel scrap.It has been reported that scrap from end-of-life vehicles has been treated as a steel resource rather than more valuable chromium or nickel resources[5],likely due to the difficulty in sorting stainless steels by type and grade.
Currently,there is no available technique to classify stainless steel alloys by type.Since most stainless steels are non-magnetic,magnetic sorting is not applicable.Furthermore,although different types of stainless steel have significant variations in elemental concentrations and properties,their color and appearance are similar.Thus,manual sorting of different stainless steels is not possible either.Therefore,accurate sorting of stainless steels by type and grade is possible only by measuring their compositions.In recent years,laser-induced breakdown spectroscopy(LIBS)has received much attention as a technique for rapid classification of scrap metals based on chemical analysis[6,7].LIBS is a technique to predict the elemental composition of a target by measuring the spectrum of a lasergenerated plasma.When a target is irradiated by a pulsed laser at an appropriate intensity,a small amount of the material can be ablated,forming a plasma.By examining the wavelength and intensity of plasma emission,the elemental composition of the target can be predicted qualitatively and quantitatively [8].Since LIBS is a fast,multielemental and in-air analysis technique,it is especially suitable for industrial applications,such as process or product monitoring on manufacturing lines [9],slag analysis[10]and metal sorting [7,11].In the context of stainless steel analysis using LIBS,Kashiwakura et al [5]reported that the concentrations of six types of stainless steel could be predicted quantitatively at the level of several thousands of ppm and correctly sorted based on the measured concentrations of chromium,nickel,and molybdenum.Similarly,Goode et al [12]reported that the classification accuracy of seven different types of stainless steel standard reference materials by LIBS was 93% when multivariate analysis was applied.In addition,Kong et al [13]reported that 100% classification accuracy of 27 steel samples,including six stainless steel samples,could be achieved using intensive spectral partitions.
For the sorting of stainless steels by LIBS in an industrial scale,scrap metal is typically shredded and fed on a conveyor for continuous sorting.The scraps are in a variety of shapes and sizes that depend on the shredding process and the source products from which the scrap piece originated.The irregularity of scrap size and shape can cause significant fluctuation of the measured LIBS signal intensity because the lens-to-sample distance can vary widely depending on the height of the scrap [14].As the lens-to-sample distance varies,the scrap surface can move out of the focal region,which results in the loss of signal intensity due to reduced laser irradiance and collection efficiency of the optics that collect and transport plasma emission to the spectrometer.Earlier studies on the effects of lens-to-sample distance on the LIBS signal reported that the emission intensity was highest at the focal point but showed a decrease for both increasing and decreasing lensto-sample distance from the focus [15,16].Furthermore,for an industrial LIBS sorting system,the scraps are randomly located over the width of a conveyor belt,which causes the incidence angle of the laser beam to change between a scrap in the middle of the conveyor and one at the edge.
In this work,we report the results of LIBS elemental analysis and classification of stainless steel alloys under severely changing focusing conditions.Due to the large fluctuation of LIBS signal intensity by varying focusing conditions,spectral intensity ratios of different elements are used for classification.A new method to select proper line pairs for intensity ratio calculation is proposed on the basis of elemental concentration and upper level of emission lines.It is demonstrated that the classification accuracy can be improved significantly by the proposed method.
2.Materials and methods
2.1.LIBS-based metal sorting system
A three dimensional (3D) model of the LIBS-based scrap metal sorting system under development is shown in figure 1.The scrap metal pieces are fed into a conveyor belt and pass through the 3D shape detection module to measure their shape and size.The shape detection module consists of a line laser and a charge coupled device(CCD)detector and detects the altitude (that is,cross-sectional) profile using a triangulation method [17].By adding the cross-sectional profiles measured along the moving direction,the 3D shape of a scrap can be constructed.From the 3D geometry of a scrap produced by the shape detection module,a relatively flat area on the surface is identified by calculating the slope of the neighboring points.The flat area of each scrap found in this manner is then passed to the LIBS module for laser irradiation and LIBS signal measurement.The LIBS module consists of a nanosecond pulse laser and a widerange CCD spectrometer and is described in detail in section 2.3.The analysis of the LIBS spectra and determination of metal type are completed in real time(<10 ms)by an algorithm based on multivariate analysis.At the end of the conveyor,the target metal scraps are sorted using a pneumatic system.
2.2.Samples
The samples used in this study were certified reference materials (CRMs) of nine different kinds of austenitic stainless steel,purchased from the National Institute of Standards and Technology of the Brammer Standard Company Incorporation [18,19].The elemental compositions of the CRM samples for each class of stainless steel are shown in table 1.Since the CRMs are composed of the same alloying elements,except the trace elements of N and Ti,and the concentrations of constituent elements vary only slightly,for example,less than 1.0 wt%in the cases of 301 and 304B,the classification of these metals requires an accurate detection of minor changes in the LIBS spectra of the constituent elements.
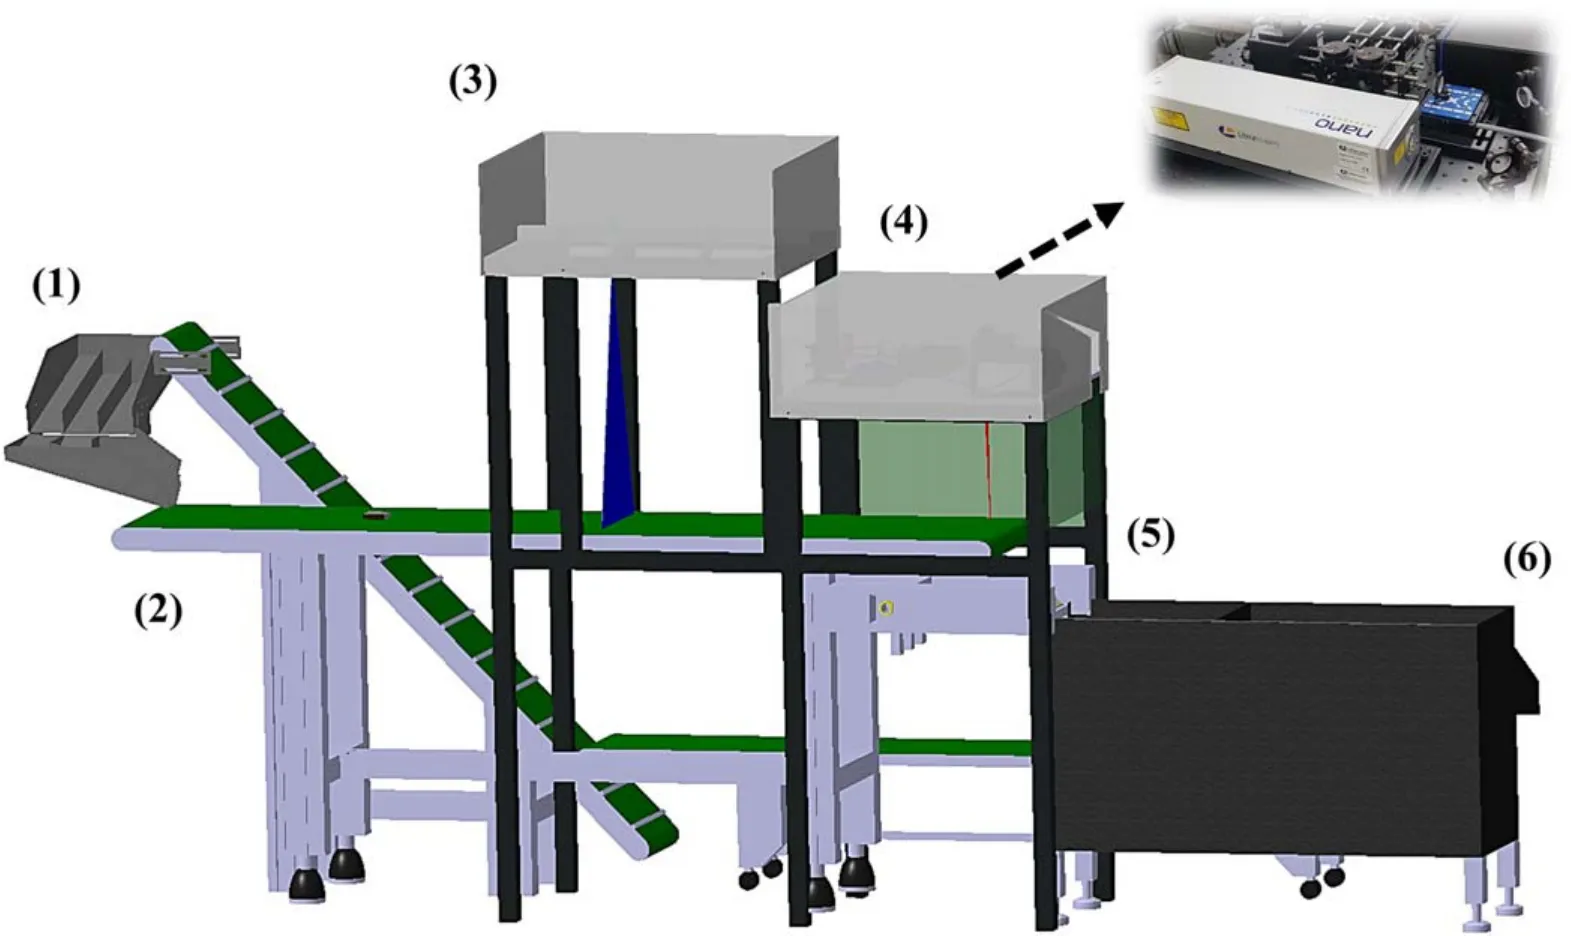
Figure 1.Three-dimensional (3D) model of the prototype laser-induced breakdown spectroscopy (LIBS)-based metal sorting system:(1)feeder,(2) conveyor belt,(3) 3D geometry detection module,(4) LIBS module,(5) air-knife sorter,(6) sorting box.
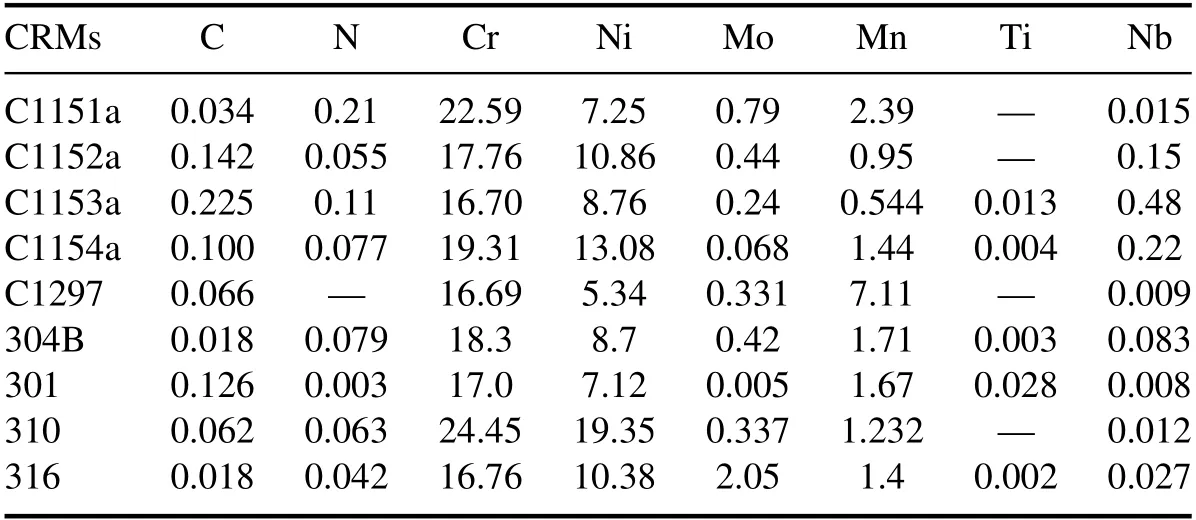
Table 1.Concentration (wt%) of constituent elements of the stainless steel certified reference materials.
2.3.Experimental procedures
The detailed configuration of the LIBS module is shown in figure 2 and the experimental procedures are as follows.A flashlamp-pumped Q-switched Nd:YAG laser (Nano L 90–100,Litron Lasers,UK) at the fundamental wavelength with a repetition rate and pulse energy of 10 Hz and 26 mJ,respectively,was used for ablation of the CRM samples.The laser beam (elevation=430 mm) passed through a lens setup consisting of diverging and focusing lenses whose focal length was 600 mm.The laser beam then entered a galvoscanning mirror (GVS012,Thorlabs,USA) whose maximum scan area was 300×300 mm2.
Each of the CRM samples was analyzed at eight different positions,four different heights (50 mm interval) at the center (scanner angle:0°) and the same four heights at the edge,100 mm away from the center (scanner angle:14°–20° with 2° interval),as shown in figure 2.The height range (20–170 mm) covers roughly from a flat sample to a tall sample collected from a domestic recycling company.Since the average size of the shredded stainless steel scraps was approximately 70 mm,the focus of the incident laser beam was placed at 70 mm above the conveyor surface (position ②).Because the focal length was fixed,the size and shape of the laser ablation crater varied,depending on the position of sample surface,as shown in figure 2.The minimum spot area,calculated by pixel counts using an open-source program (Image J) [20],was 0.193 mm2at position ②and the maximum was 0.254 mm2at position ⑧.
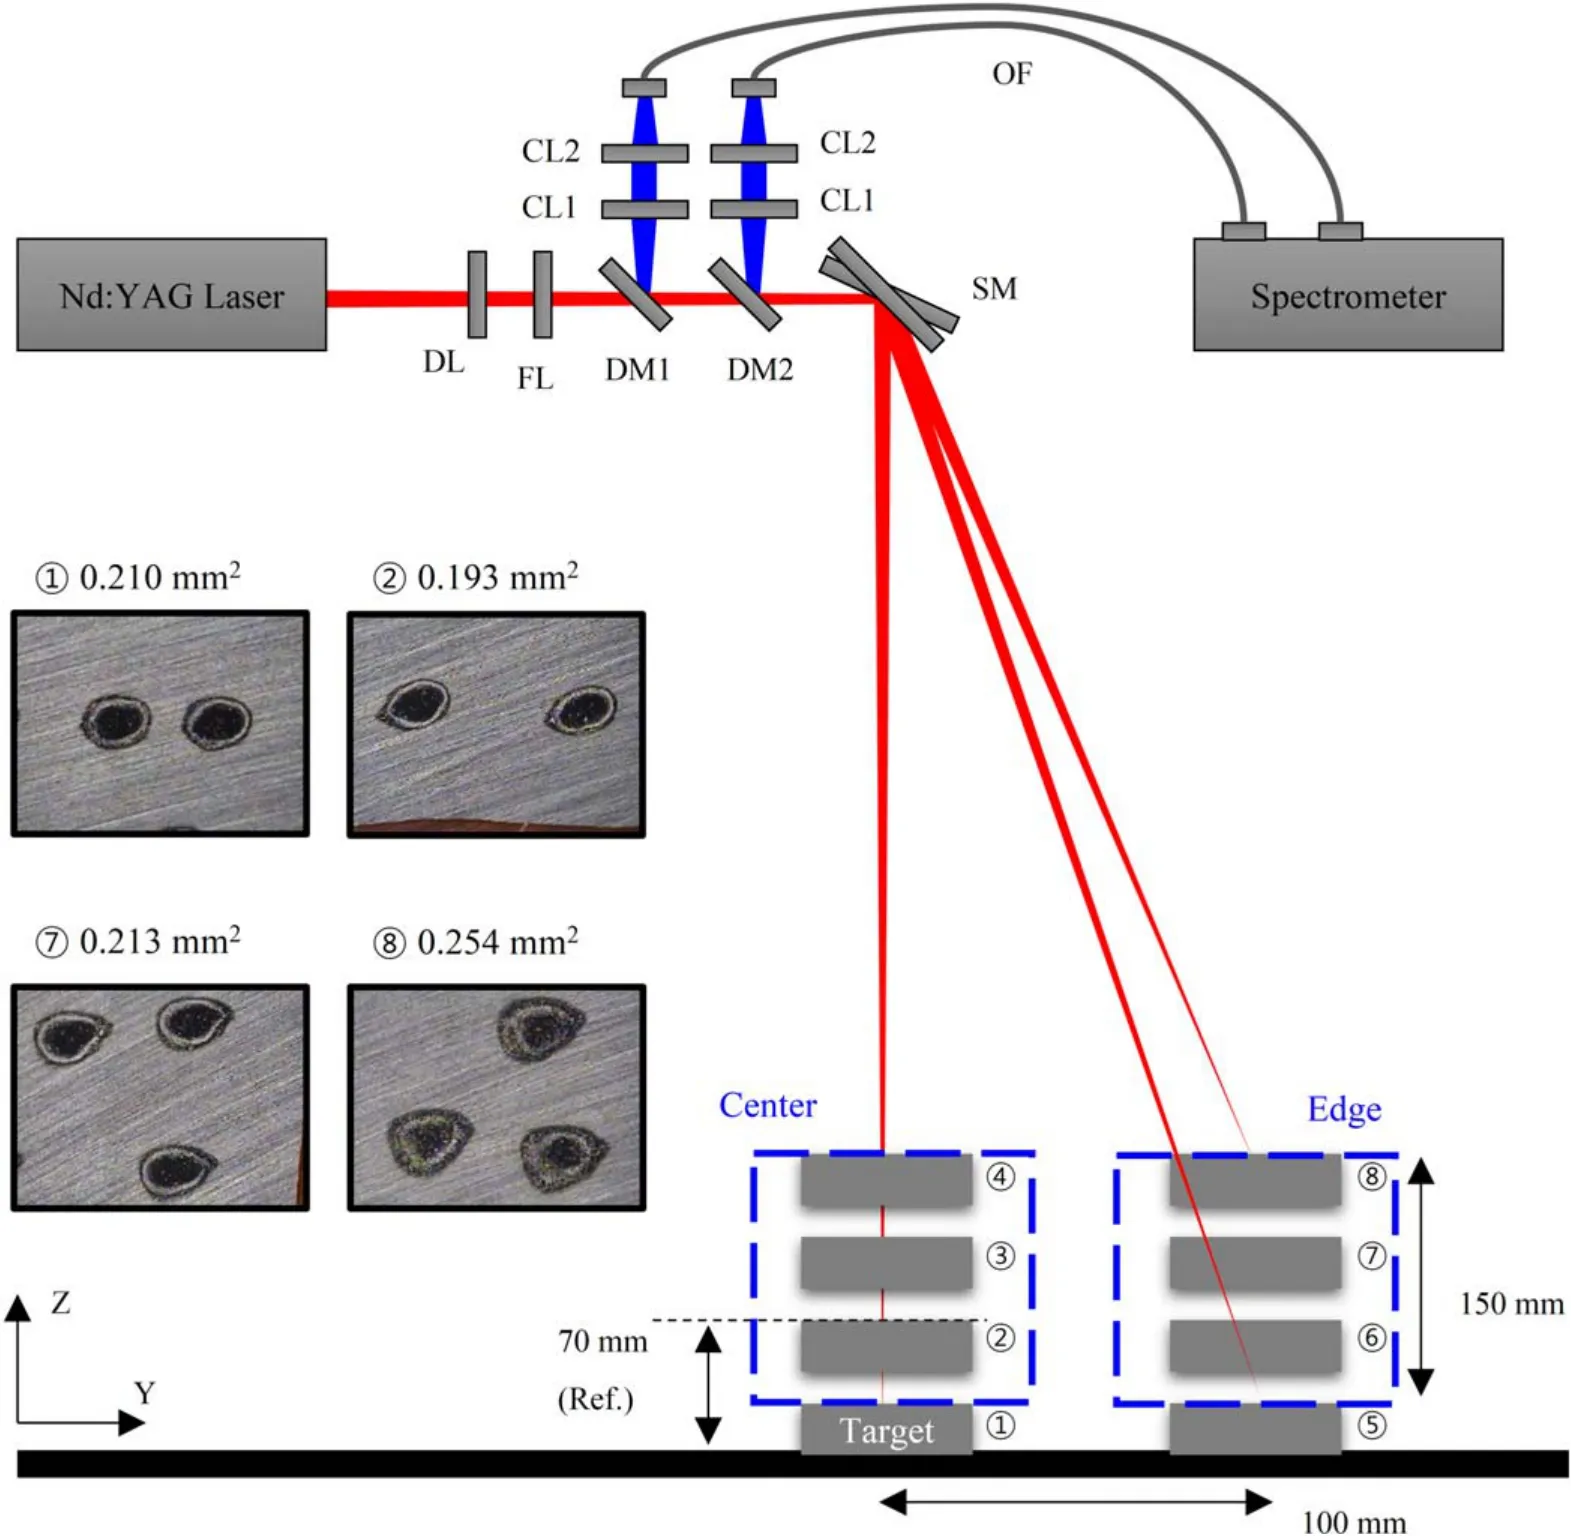
Figure 2.Schematic diagram of the LIBS module and measurement positions (DL:diverging lens,FL:focusing lens,DM:dichroic mirror,CL:collection lens,SM:scanning mirror,OF:optical fibre).
The plasma emission was detected using a dual channel spectrometer (Avaspec-ULS2048-2-USB2,Avantes,Netherlands)of which each channel covered the spectral regimes of 200–430 nm(Ch.1,resolution=0.1 nm)or 415–900 nm(Ch.2,resolution=0.3 nm).The gate width and delay of the CCD spectrometer were fixed at 1 ms and 1.28 μs,respectively.Plasma emission from the sample,antiparallel to the incident laser beam,was partially reflected by the dichroic mirrors (DM1 and DM2) and transmitted to the spectrometers via optical fibres.For each of the eight positions,LIBS spectra were measured at five different spots and each spot was fired by two laser shots.The first shot at each measurement spot was excluded from the analysis in order to avoid possible surface contamination.Accordingly,a total of 40 spectra (=5 spots/position×8 sample positions) per CRM sample were collected and used for classification analysis.
3.Results and discussion
3.1.LIBS spectra
Figure 3 shows the averaged LIBS spectra of the 301 CRM(average of five measurements) obtained from the eight different focusing positions while other measurement conditions were kept the same.The peak intensity changed by over an order of magnitude depending on whether the surface was placed at the focus (h=70 mm,center) or at an off-focus position (h=170 mm,edge).The data show that the effects of scanning angle are not significant for these focusing positions,whereas the effects of focal length appear to be critical.For example,the spectral intensities of 17 clearly detected lines at the center of the focal plane (position ②)were approximately 12% higher in average than those at the edge (position ⑥).However,as the sample height was increased to h=120 mm,the spectral intensity at the center(position ③) was lower than that at the edge (position ⑦)because in this case the surface at the edge was closer to the laser focus.
Note that there was no significant difference in signal-to-background ratio (SBR),which is the ratio of the integrated area of an emission peak to the area of background under the peak,between the center and the edge at the same surface height.For example,at h=70 mm,the SBR values of the Cr (I) 520.6 nm peak at the center and the edge were estimated to be 7.55 and 7.76,respectively,while those of the Fe (I) 438.3 nm peak were 3.05 and 2.87.
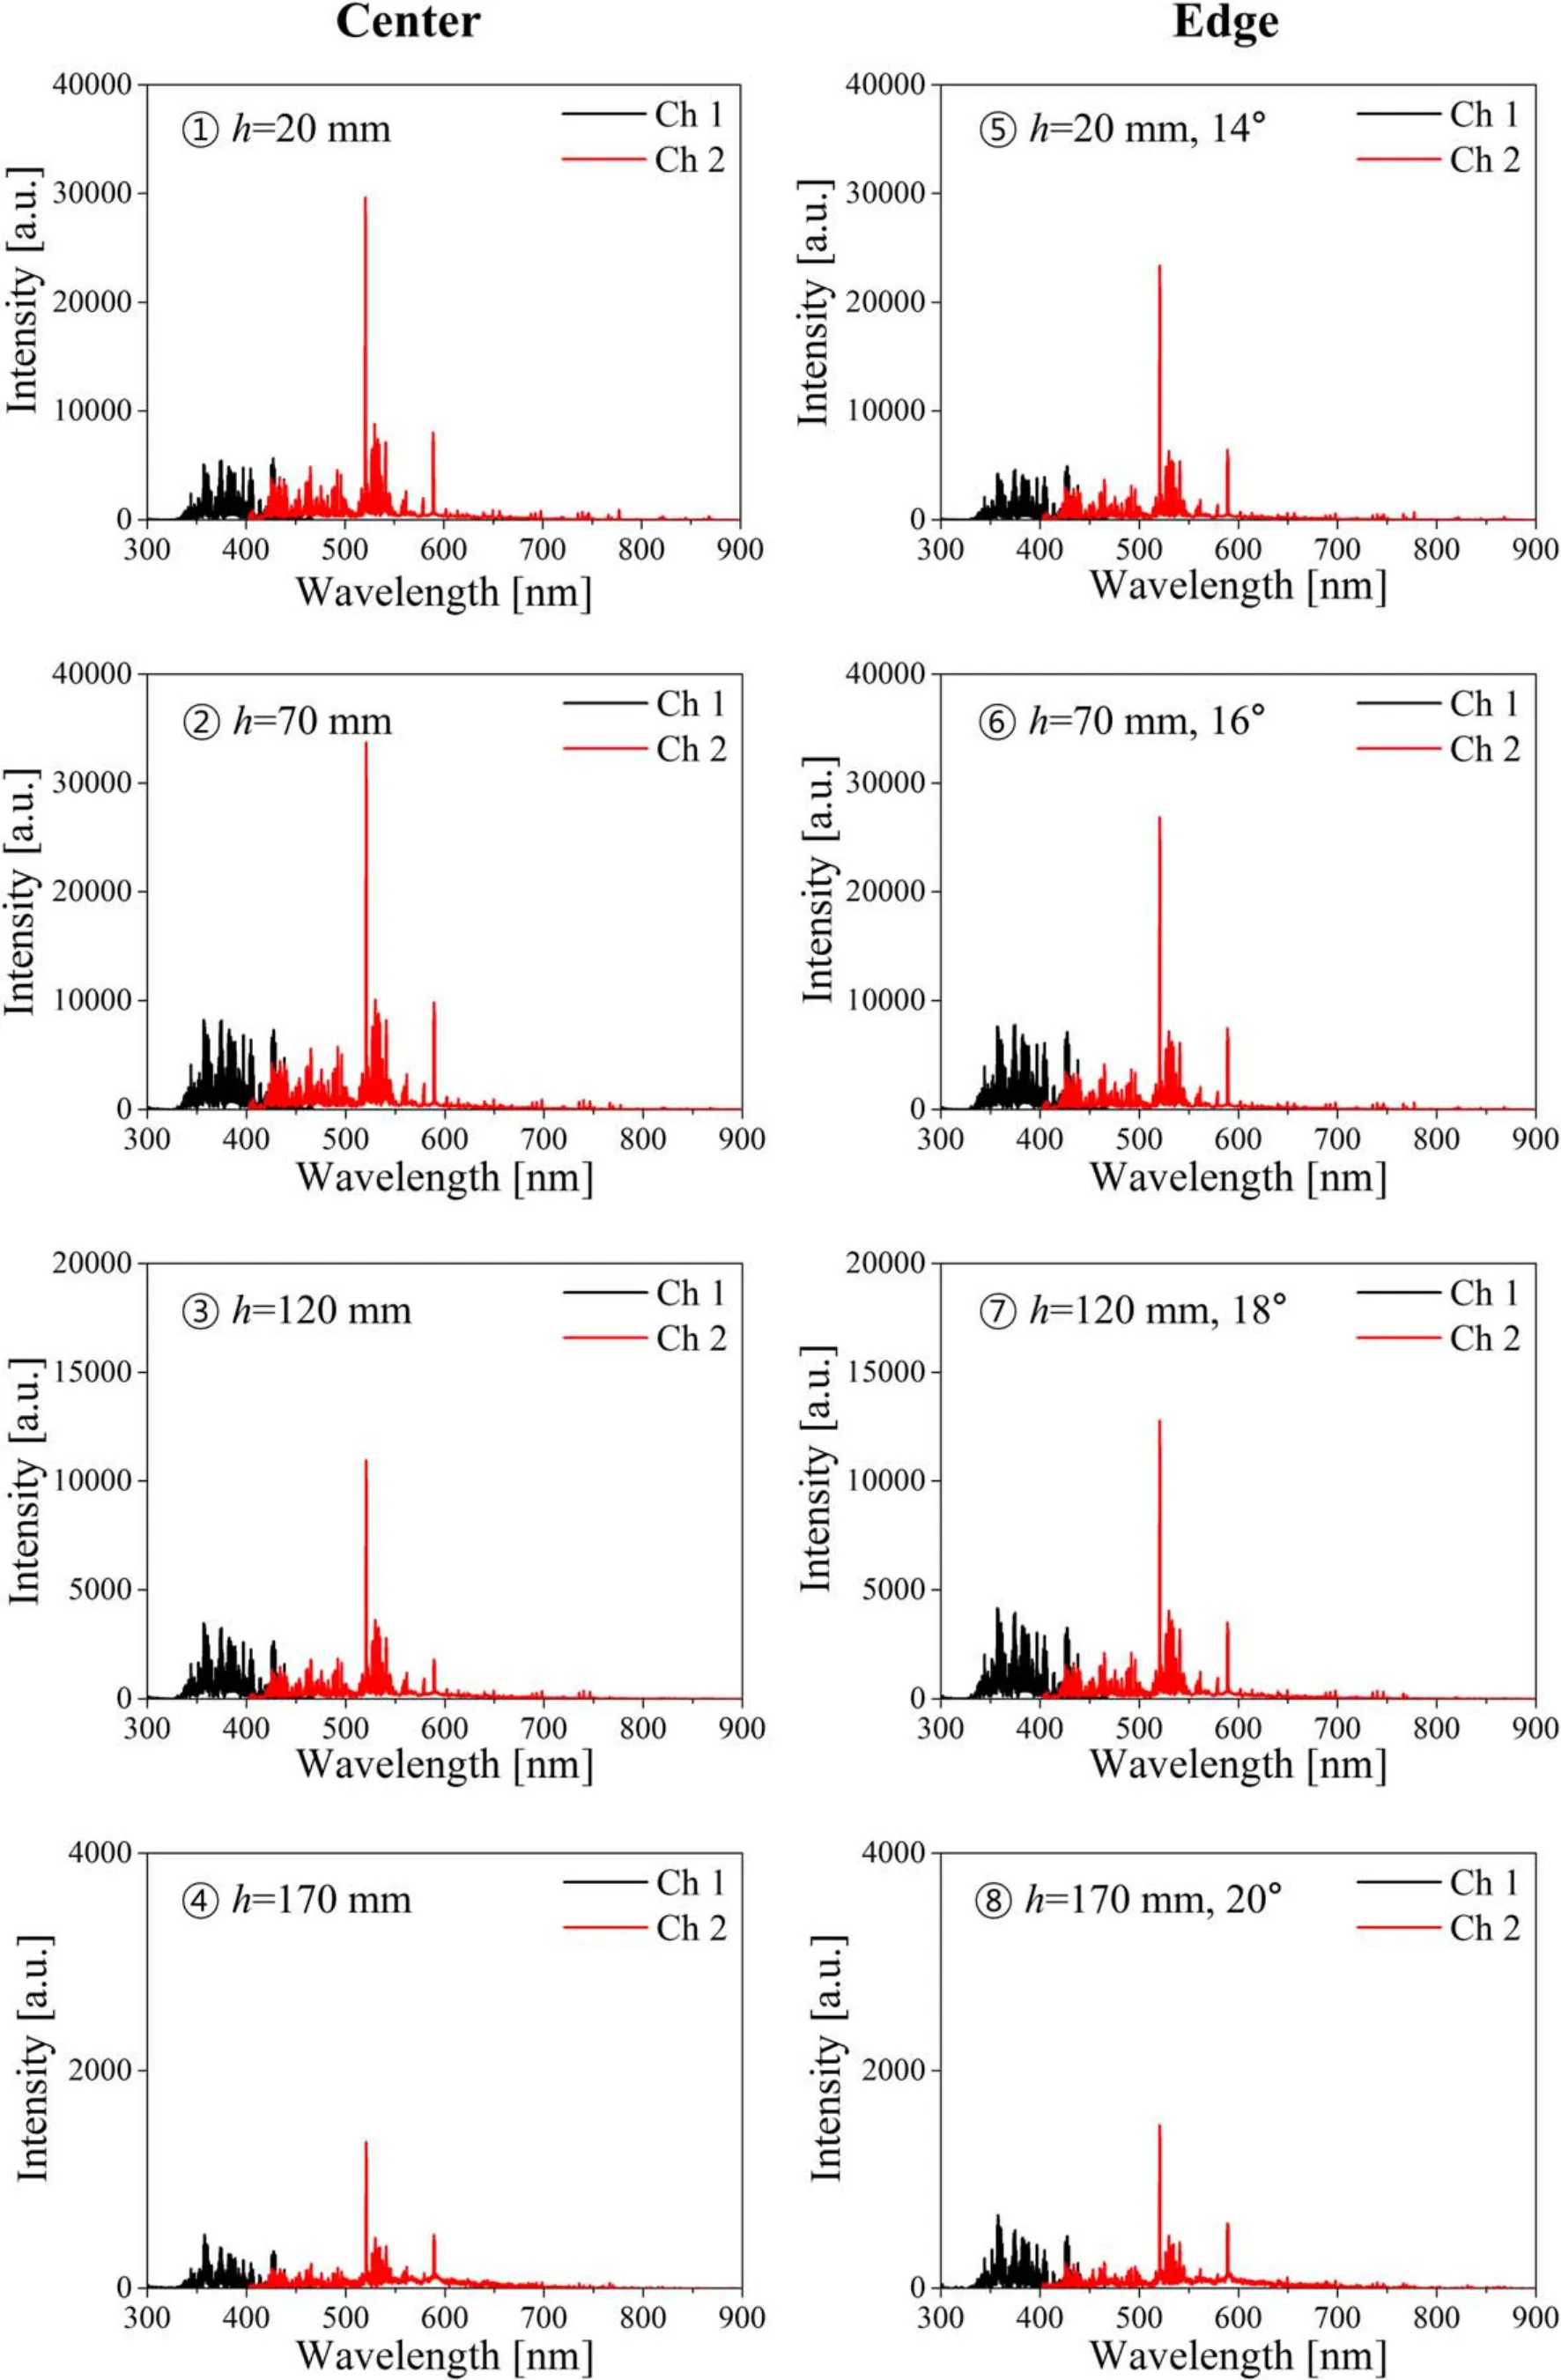
Figure 3.Averaged LIBS spectra of the 301 certified reference materials at eight different positions.
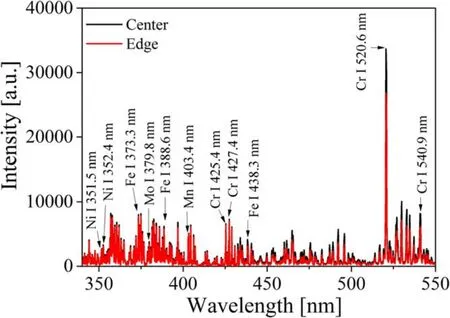
Figure 4.Comparison of LIBS spectra acquired from the center(position ②) and the edge (position ⑥) at the same height(h=70 mm).
As shown in figure 3,most of the emission peaks were detected in the spectral range of roughly 350–600 nm.It is also shown that the LIBS signal intensity was lowest at position ④,which was the worst focusing condition in the experiments.Note that the sharp peak near 600 nm represents the Na(I)at 589.0 and 589.6 nm emission lines.Thus,the spectra in the range 330–550 nm were replotted as shown in figure 4,excluding the Na signal because it is not a constituent element of stainless steel.From figure 4,17 spectral lines clearly detected even at the worst focusing condition were selected for the classification analysis as listed in table 2.
3.2.Analysis of intensity ratio
In figure 3,it was shown that the LIBS signal intensity decreased significantly as the sample surface moved away from the laser beam focus due to decreased irradiance and ablation mass,over an order of magnitude difference between the on-focus position (②) and the off-focus position (④).When the LIBS signal intensity fluctuates too much,degradation of classification accuracy is inevitable.Thus,under the conditions of large fluctuation of signal intensity,the use of intensity ratio rather than intensity is more appropriate for analysis.
The selection of a proper internal standard or spectral line pairs is critical in the intensity-ratio-based analysis.In this study,we applied the following procedures for the selection of spectral line pairs for intensity ratio calculation.First,we selected the elements with higher concentration as the normalizing signal (denominator) of the intensity ratio pairs,which were Fe,Cr,and Ni.Fe is the base metal and the concentrations of Cr and Ni in stainless steel CRMs varyin the ranges 16.69–24.45 and 5.34–19.35,respectively,as shown in table 1.Specifically,there exist seven Fe spectral lines in table 2 which are available as the normalizing signal for intensity ratio calculation.Since there are 10 spectral lines of other elements (six Cr lines,two Ni,one Mn and one Mo),10 intensity ratios can be obtained for each of the Fe lines.By repeating the same procedure for all of the seven Fe lines,a total of 70 intensity ratios (Iother/IFe) were obtained.When the same process was repeated using the Cr lines as the normalizing signal to Ni,Mn,and Mo lines (Fe signals are excluded at this step),a total of 24 intensity ratios were found.Finally,four more intensity ratios were obtained using Ni lines as the normalizing signal.The total number of intensity ratio combinations obtained by this process was 98.
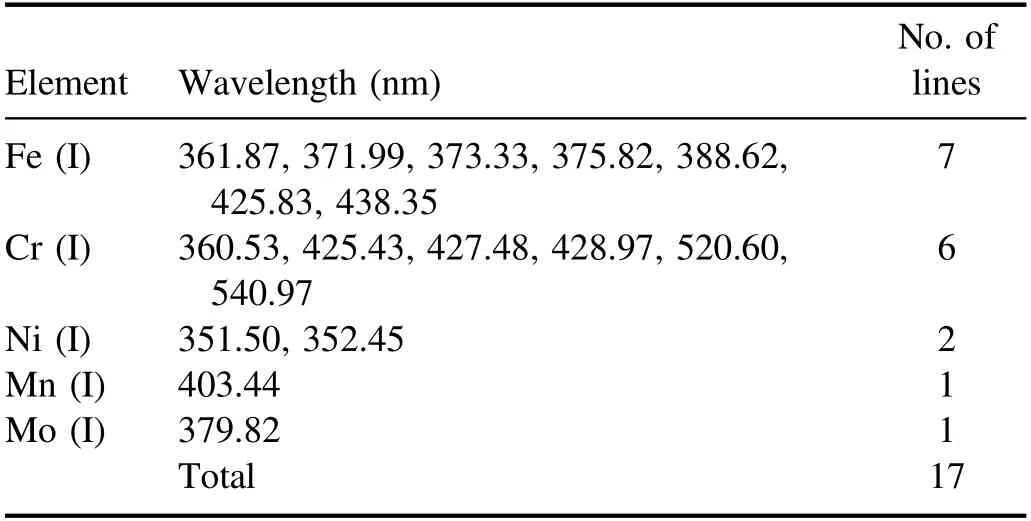
Table 2.Emission lines selected for the classification of stainless steel alloys.
Next,among these 98 possible intensity ratios,we chose 16 to be used for classification analysis as follows.Assuming a homogeneous plasma in local thermodynamic equilibrium,the emission intensity at a specific wavelength can be expressed by Boltzmann’s law.Also,it was previously reported that the intensity ratio of two emission lines can be nearly independent of plasma conditions provided that the upper levels of the selected emission lines are similar [21,22].Thus,from the comparison of upper levels of each intensity ratio combination,intensity ratios were selected in the order that the difference in upper levels (ΔEu) between the emission line pairs was smaller.Then,from the 70 intensity ratios based on Fe as the normalizing element (Iother/IFe),the line pair whose ΔEuis minimum was identified for each of the other 10 lines (six Cr,two Ni,one Mn and one Mo lines).This procedure was repeated for the 24 intensity ratios based on Cr and the four Ni-based intensity ratios.Overall,a total of 16 intensity ratios with minimum ΔEuwere determined as shown in table 3.
The above-described selection procedure allows the inclusion of all the clearly detected LIBS signals(17 emission lines in table 2) and the consideration of spectral characteristics of the detected emission lines (minimum upper level difference) for intensity-ratio-based classification.
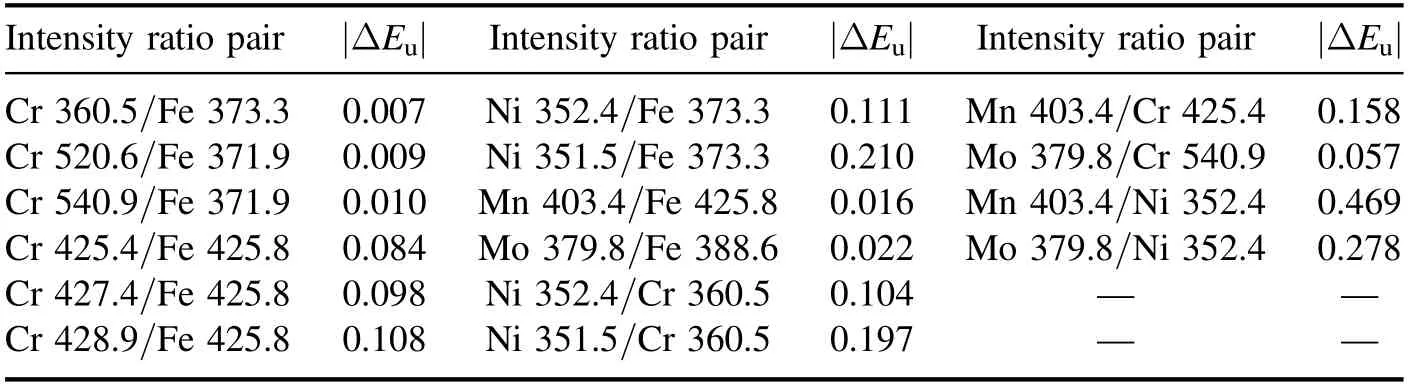
Table 3.Spectral line pairs selected for intensity-ratio-based analysis.
Figure 5 shows the variations of selected intensity ratios with respect to focusing position,one from each of the normalizing elements (Fe,Cr and Ni) with minimum difference in upper levels.Note that the spectral intensity between the best focus position (②) and the worst focus position (④) differs by over an order of magnitude in figure 3.In contrast,the variation of average intensity ratio at different focusing positions with respect to the value at position ②(the focal plane)is below 37%for all the spectral line pairs in table 3.These results confirm the effectiveness of intensity ratio as opposed to intensity for LIBS analysis under fluctuating focus conditions.It should be noted,however,that the relative standard deviation of intensity ratio increases significantly at the severe off-focus positions(④and ⑧),approximately three times,which is likely due to the too low spectral intensities and increased uncertainty at these focusing positions.
3.3.Classification results
The performance of the proposed method for stainless steel classification was evaluated by comparing with the results based on full-spectra principal component analysis(PCA)and on the intensities of the 17 selected lines in table 2.For the performance test,the 360 LIBS spectra (40 spectra/sample×9 samples) obtained from all the stainless steel CRMs were used and 10-fold cross-validation by linear discriminant analysis was carried out [23].
The maximum classification accuracy achieved with full spectra PCA was 75.8% when the number of principal components was increased to 13,beyond which,however,no further improvement was seen.When the intensities of the 17 selected lines were used as the input variables for PCA,the classification accuracy was 73.1%.The performance of the method proposed in this work was evaluated as follows.First,the classification was carried out using only the 10 intensity ratios normalized by Fe intensities(10 IA/IFewhere A is one of the six Cr,two Ni,and the Mn and Mo lines) for which the classification accuracy was a mere 66.7%.Next,when the four intensity ratios normalized by Cr intensities(4 IB/ICrwhere B is one of the two Ni and the Mn and Mo lines) were added,the classification accuracy jumped to 87.5%.Finally,when the two intensity ratios normalized by Ni intensity (2 IC/INiwhere C is the Mn or Mo line) were added,the maximum classification accuracy of 90.6% was achieved.No further improvement of classification accuracy could be achieved even when other intensity ratio pairs were added to the 16 pairs,up to 22 pairs in total.The variation of classification accuracy with the number of intensity ratio pairs is shown in figure 6.
The maximum classification accuracies achievable from the three methods are summarized in table 4.In the proposed method,we considered the concentrations of major elements and the upper level difference between the selected spectral lines for intensity ratio calculation as the main factors for stainless steel classification,and the results demonstrate the significance and effectiveness of these factors.Further improvement of classification accuracy may be possible provided that other characteristics of the 98 intensity ratios besides the upper level difference are identified and included in the analysis.For instance,Zhang et al[24]applied a genetic algorithm for the selection of characteristic lines,and a similar technique may be applied for the 98 intensity ratios to investigate other combinations of emission lines.
4.Conclusion
The use of a fixed-focus optic is advantageous for a LIBS-based scrap metal sorting system because it makes the maintenance easier and lowers the system price.However,since industrial scrap metal comes in a variety of shapes and sizes,even after shredding it is likely that the scrap surface can be out of the focal region during LIBS measurement,which results in a significant fluctuation of signal intensity,as large as an order of magnitude.When intensity fluctuation is large,intensity ratio can provide a better result during LIBS analysis.In this work,we proposed a method to select line pairs for intensity-ratiobased classification of stainless steel alloys having nearly the same constituent elements.For classification analysis,LIBS signals of the elements with higher concentration were utilized as the normalizing signals and,among the possible combinations,the spectral line pairs with least upper level difference were selected as the input parameters.It was demonstrated that the proposed method is superior to full-spectra PCA or intensity-based analysis.It was also shown that the classification accuracy increases as the spectral line pairs from multiple elements of higher concentration are included in the input parameters.The proposed method is considered to be useful for the sorting of industrial scrap metal pieces with wide variations in size and shape.
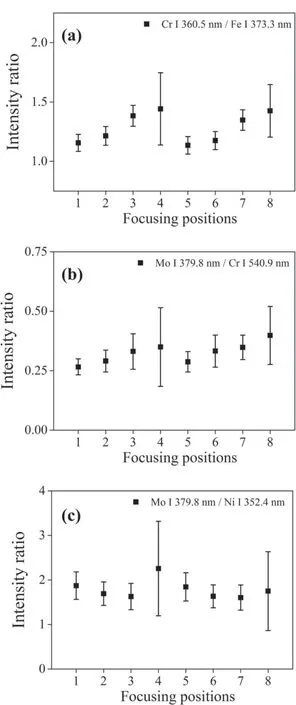
Figure 5.Variation of intensity ratios with respect to focusing position:(a) Cr 360.5 nm/Fe 373.3 nm,(b) Mo 379.8 nm/Cr 540.9 nm,(c) Mo 379.8 nm/Ni 352.4 nm.
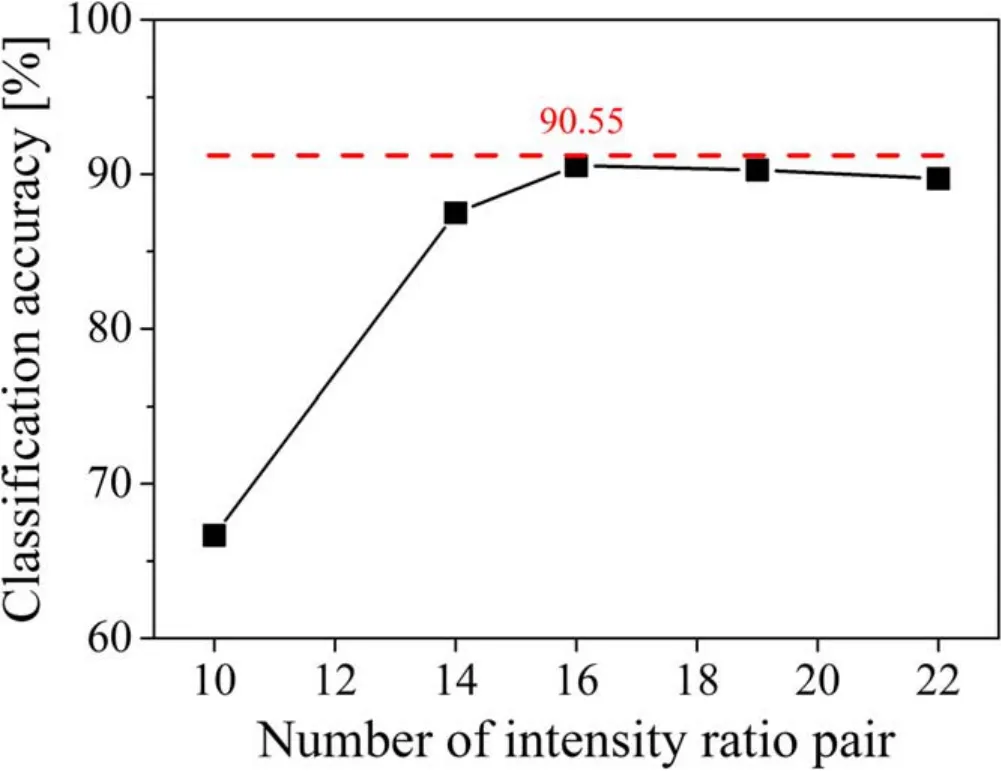
Figure 6.Variation of classification accuracy with respect to the number of intensity ratio pairs.
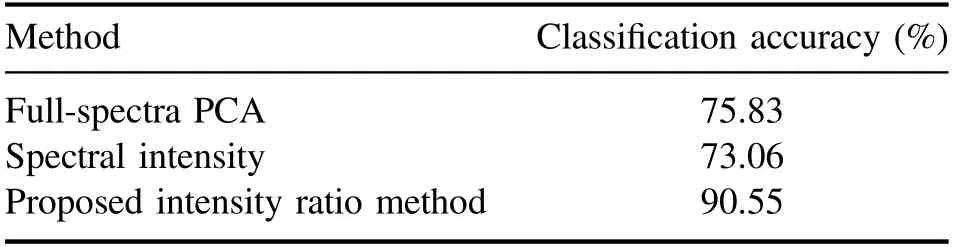
Table 4.Classification results of nine stainless steel CRMs.
Acknowledgments
This study was supported by the R&D Center for Valuable Recycling (Global-Top R&BD Program) of the Ministry of Environment.(Project No.2016002250003) and partially supported by Korea Institute for Advancement of Technology(KIAT) grant funded by the Korea Government (MOTIE)(P0008763,The Competency Development Program for Industry Specialist)
ORCID iDs
 Plasma Science and Technology2020年7期
- Plasma Science and Technology的其它文章
- Influence of target temperature on femtosecond laser-ablated brass plasma spectroscopy
- Spectral characteristics of underwater laserinduced breakdown spectroscopy under high-pressure conditions
- A novel strategy for quantitative analysis of soil pH via laser-induced breakdown spectroscopy coupled with random forest
- Quantitative analysis of the content of nitrogen and sulfur in coal based on laserinduced breakdown spectroscopy:effects of variable selection
- Geographical authenticity evaluation of Mentha haplocalyx by LIBS coupled with multivariate analyzes
- Quantitative analysis of saindha salt using laser induced breakdown spectroscopy and cross-validation with ICP-MS