
Accuracy improvement of quantitative analysis of calorific value of coal by combining support vector machine and partial least square methods in laserinduced breakdown spectroscopy
2020-07-09 04:20XiongweiLI李雄威YangYANG杨阳GengdaLI李庚达BaoweiCHEN陈保卫andWensenHU胡文森
Plasma Science and Technology 2020年7期
关键词:杨阳
Xiongwei LI (李雄威),Yang YANG (杨阳),Gengda LI (李庚达),Baowei CHEN (陈保卫) and Wensen HU (胡文森)
Guodian New Energy Technology Research Institute,Beijing 102209,People’s Republic of China
Abstract
Keywords:accuracy improvement,calorific value,coal,PLS,SVM,LIBS
1.Introduction
Fast or online analysis of coal’s calorific value is critical for power plants in terms of coal pricing or combustion optimizing.The online analysis of coal’s calorific value provides an important reference index for power plants to realize realtime combustion optimization.Besides,the fast measurement of calorific value is helpful to obtain a better representative calorific value for coal pricing due to more samples being measured.Considering the large-scale consumption of coal by power plants every day,the combustion optimization as well as the coal pricing is essentially important for the economical operation of power plants [1].Laser-induced breakdown spectroscopy(LIBS)has a number of advantages,such as fast or online analysis,multiple element simultaneous measurement,and requires no or minimal sample preparation[2–4].It has been extensively studied and developed,and the development of the LIBS technique in Asia has been a rising force for the world-wide development[5,6].LIBS is regarded as a very promising technique for the online measurement of coal properties,and many studies have been performed to analyze the coal’s calorific value by LIBS so far [7–10].For example,the calorific value has been quantitatively determined by the partial least square (PLS) method,whichindicated that the accuracy of measurement could be influenced by matrix effects as well as fluctuations or variations in the parameters of experiments [11–13].To increase the measurement accuracy of calorific value,the support vector machine (SVM),dominant factor-based PLS and hybrid quantification methods have also been proposed [1,7,8].
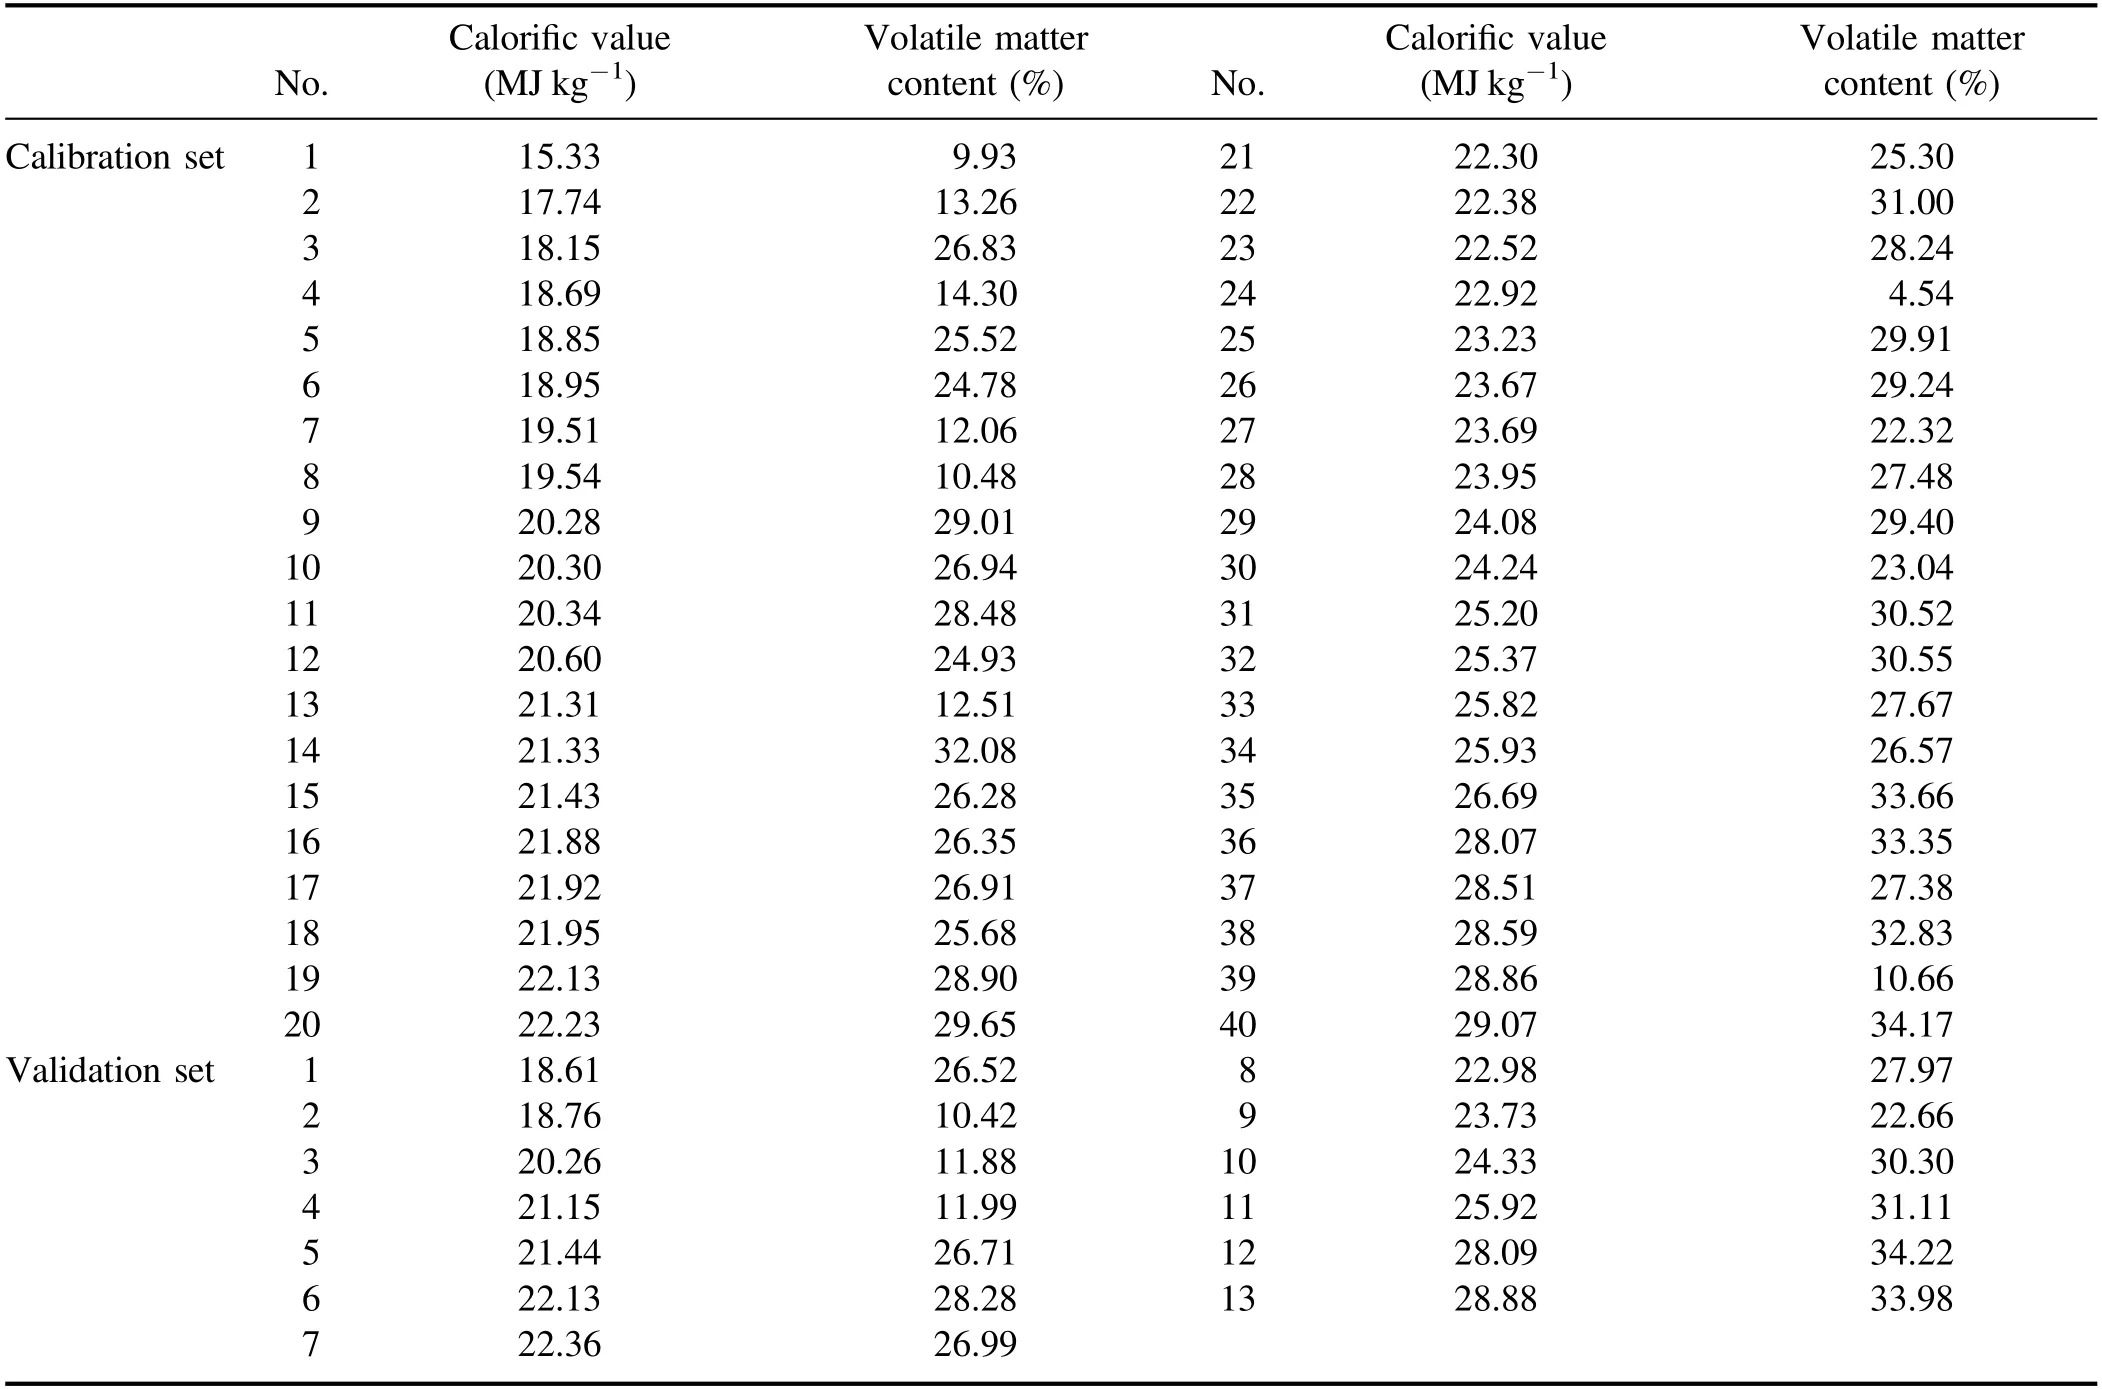
Table 1.The certified calorific values and the certified volatile matter contents of 53 coal samples.
In previous studies,the quantitatively measured carbon content in coal samples showed that the linearity of the carbon content in coal with the atomic carbon spectral intensity was poor,caused by matrix effects [14,15].It has also been shown that the decrease in atomic carbon intensities resulting from matrix effects could be well compensated by the molecular emissions of C2and CN[16].As calorific value has a close relationship with carbon content,the quantitative analysis of calorific value could also be influenced by the matrix effect.In this research,the influence of volatile matter content on the measurement of calorific value was investigated,and a model combining SVM and PLS methods was put forward to increase the measurement accuracy of calorific value.
2.Experiment
The calorific value of coal was analyzed by the LIBS system(Spectrolaser 4000) from XRF Scientific company in Australia.A Q-switched Nd:YAG laser with wavelength of 532 nm was used in the LIBS system,and its pulse duration was 5 ns.The laser pulse energy was set to be 70 mJ,and the spot diameter was set to be 100 μm.The plasma emission was collected by four Czerny-Turner spectrographs and four charge coupled devices (CCD) detectors,which have a spectral coverage from 190 nm to 950 nm.The nominal spectral resolution is about 0.09 nm.The integration time was fixed at 1 ms,and the gate delay time was set to be 1.5 μs.The detailed description of the experiment system can be found in the previous study [14].
The 53 collected coal samples were utilized in the experiment.For the coal samples,the calorific values were analyzed by oxygen bomb calorimeter,and the volatile matter contents were determined by thermogravimetric analysis.The certified calorific values and the volatile matter contents on an air-dried basis are shown in table 1.For each coal sample,coal powder was firstly placed into an aluminum pellet die with a diameter of 3 cm,and then pressed into a coal pellet by 20 tons of pressure for the measurement.In order to build the calibration model as well as evaluate the calibration model performance,40 coal samples were chosen for calibration and the remaining 13 coal samples were chosen for validation.To ensure a wide range and even concentration distribution in both the calibration and validation sets,all of the samples were first arranged by their calorific values,and then one of every four samples was chosen for validation.
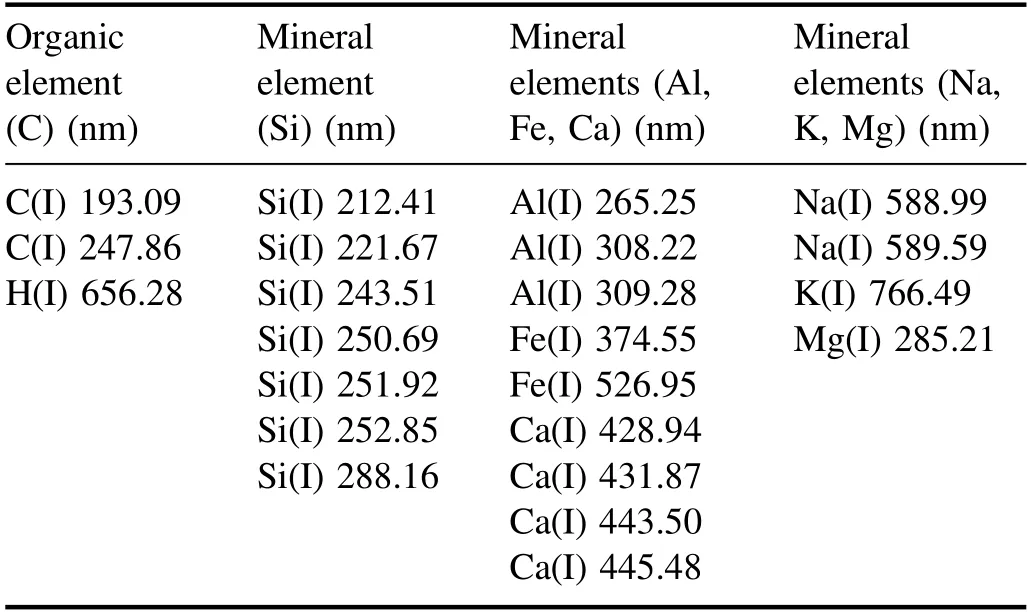
Table 2.The list of characteristic lines of the selected elements for model establishment.
The samples were placed in a sample chamber on an automatic two-dimensional mobile platform.The time for warming up the system was set to be at least half an hour before the measurement to ensure the stability of the laser source.For each sample,36 laser pulses were shot at different positions of the sample surface,and the obtained spectra were averaged to reduce the experimental parameter fluctuations.To reduce the impact of the background continuum,the channel readings of emission lines above the background signal were integrated as the emission line intensities,which were utilized for the following calculation.
3.Model description
The proposed model utilized the SVM method for the classification of coal samples and applied PLS for the quantitative analysis of calorific value.A detailed description of the SVM and PLS methods can be found in the previous literature[17,18].Generally,SVM was originally developed to solve the problems of binary classification through the statistical learning method.As SVM is aimed at minimizing the structural risk,it can obtain a better generalization ability through a better compromise between the accuracy and the learning ability of the algorithm with limited sample information.Compared with other traditional learning algorithms,SVM shows good performance in dealing with a small number of samples,and nonlinear and high-dimensional pattern recognition.PLS is an advanced multivariate regression analysis tools in chemometrics,and it has been shown to be capable of achieving good results for LIBS quantitative analysis.
Two steps are basically involved in establishing the combination model.Firstly,the calibration samples were divided into two groups,which have low or high volatile matter content respectively,and the SVM model was established using the calibration samples.Secondly,two PLS models were built for each of the coal sample groups.For the prediction process,the unknown samples were firstly classified by the SVM model,and then the corresponding PLS model was utilized to quantitatively analyze the calorific value.
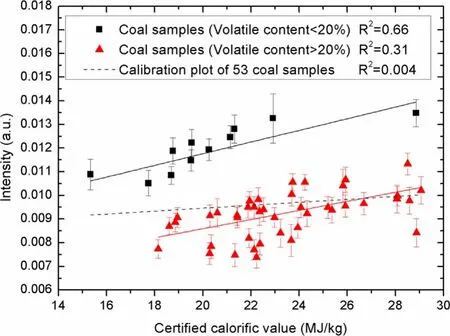
Figure 1.Calibration results of the carbon spectral intensity at 247 nm versus the certified calorific value before and after the classification of coal samples by volatile matter content.
The spectral lines of selected elements that are welldefined and free of overlap were utilized for establishing the proposed model,as shown in table 2.Besides,the emission intensities of molecular C2from 470 nm to 473 nm and the emission intensities of molecular CN from 386 nm to 390 nm were also selected for establishing the calibration model.As shown in a previous study,both C2and CN could be formed not only directly from the laser ablated coal samples,but also from the chemical reaction process in the plasma [19].The previous study showed that as the part of carbon is used to produce the molecular of C2and CN rather than generate the atomic carbon spectral intensity,the molecular emission intensities could be used to compensate well for the reduction of atomic carbon spectral intensity.
4.Results and discussion
The PLS model is chosen as the baseline,and the proposed model performance is evaluated by comparing with the PLS model.The R2of the calibration curve can be used to evaluate the quality of data for building the calibration model.Both of the root mean square error of prediction (RMSEP) and the average relative error (ARE) can be used to assess the prediction accuracy of the calibration model.Therefore,the above three parameters are chosen as the evaluation indexes.
As the calorific value is closely related to the carbon content,there should be a strong correlation between the carbon spectral intensity at 247 nm and the calorific value based on the fact that the carbon content should have a strong relationship with the measured spectral intensity of C(I)247 nm.However,the previous study showed that the calibration between the spectral intensity of C(I) 247 nm and the carbon concentration for the 24 bituminous coals was poor[14].That means the correlation between the carbon spectral intensity at 247 nm and the calorific value should not be good.As shown in figure 1,the calibration results between the carbon spectral intensity at 247 nm and the calorific value forthe 53 coal samples were also very unsatisfying,and the R2value of the calibration plot is only 0.004.The previous study also showed that the calibration between the spectral intensity of C(I) 247 nm and the carbon concentration for the 24 bituminous coals could be greatly improved,if only the coal samples whose volatile content was lower than 23% were chosen for calibration.In this work,different values around 23% were tried for the classification.It was found that the best result for the calibration of the carbon spectral intensity at 247 nm and the calorific value could be achieved when utilizing 20% as the dividing line.If the coal samples that have volatile matter content of lower than 20% are selected for calibration,the R2can be increased to 0.66; if the coal samples that have volatile matter content of higher than 20% are selected,the R2can be increased to 0.31,as shown in figure 1.The results indicate that the measurement of the calorific value of coal could be influenced by the matrix effect related to volatile matter content.Similar results were also found for the carbon content analysis in the previous study [16].
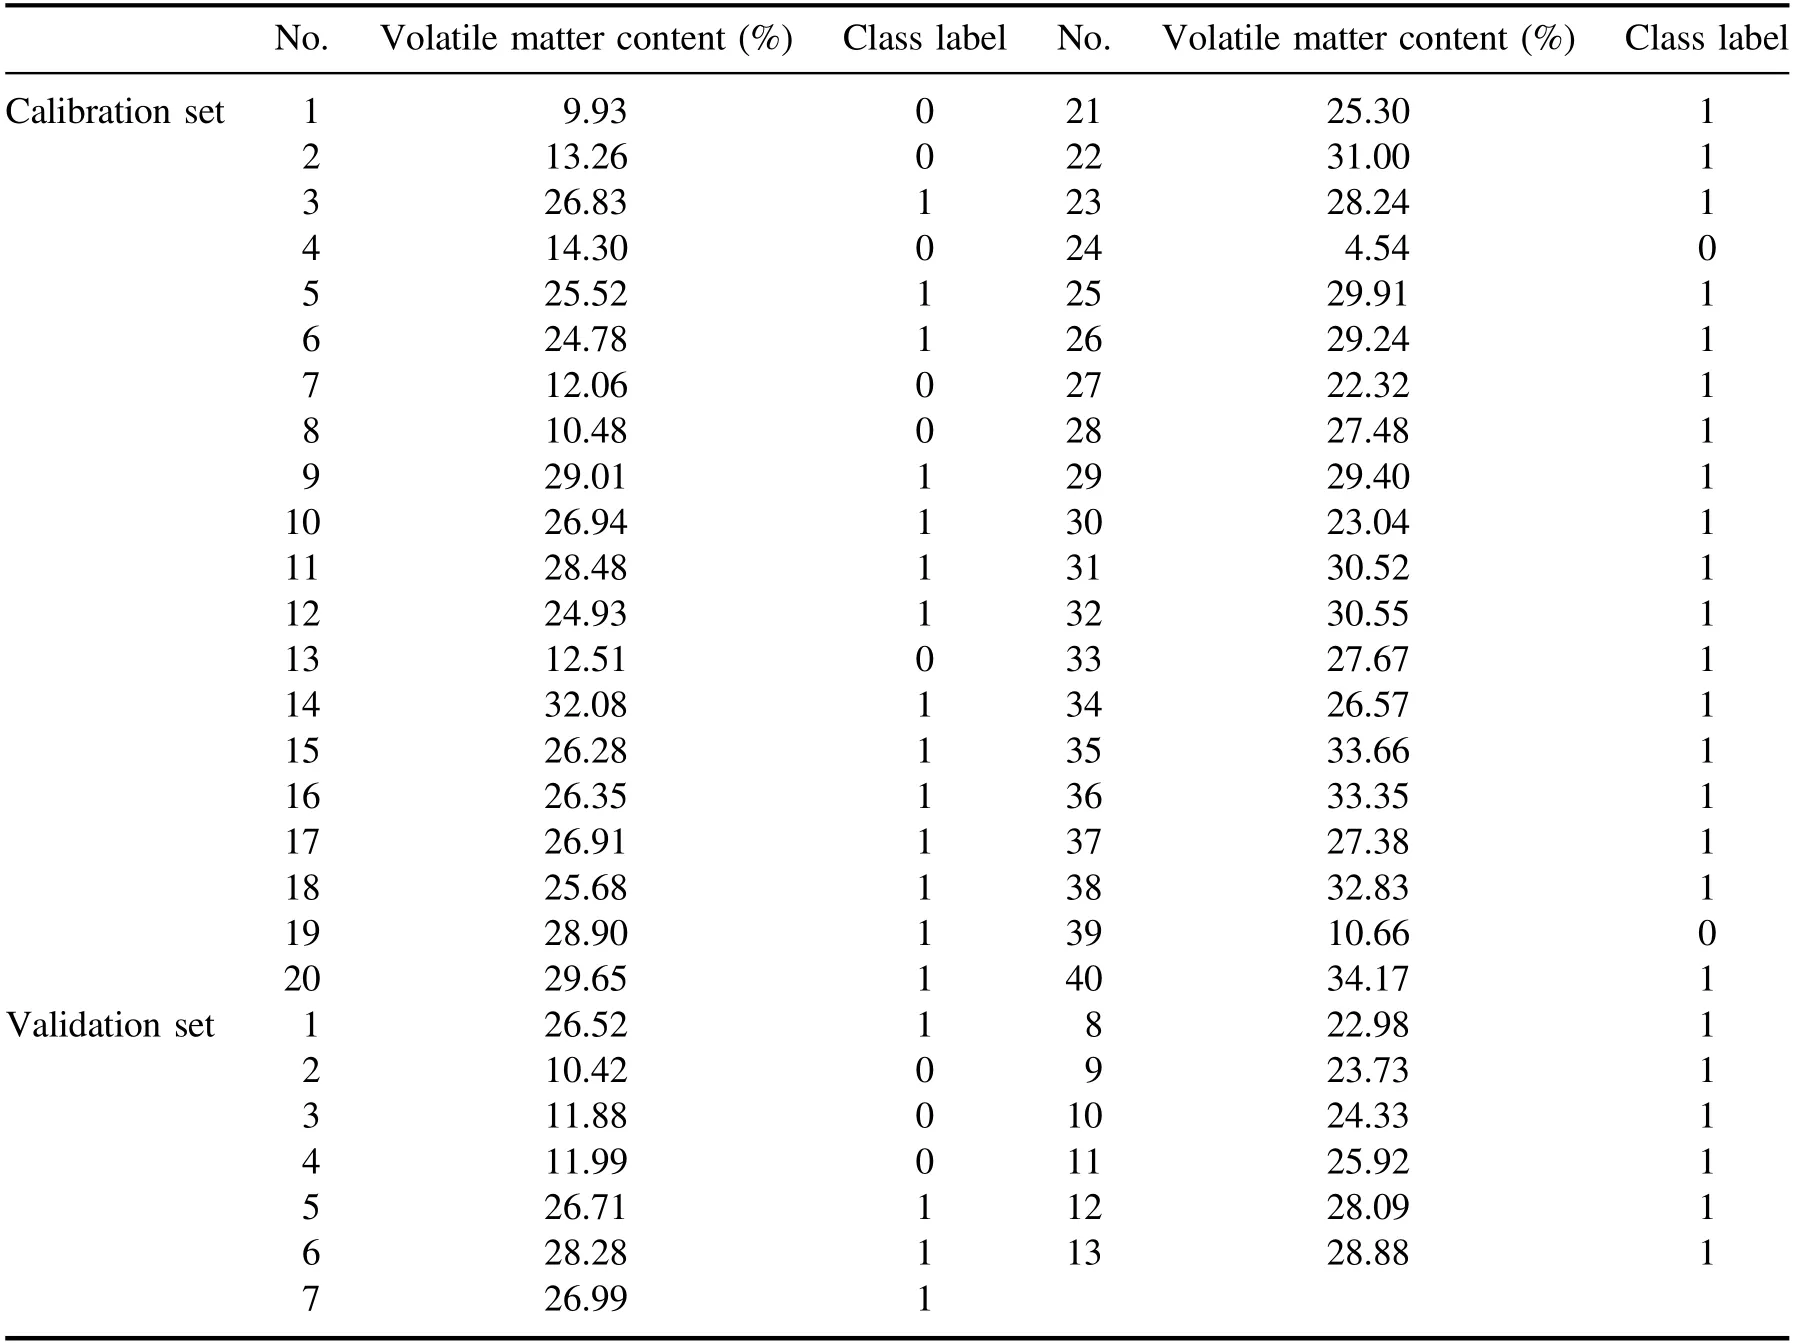
Table 3.The calibration and validation results of the SVM model.
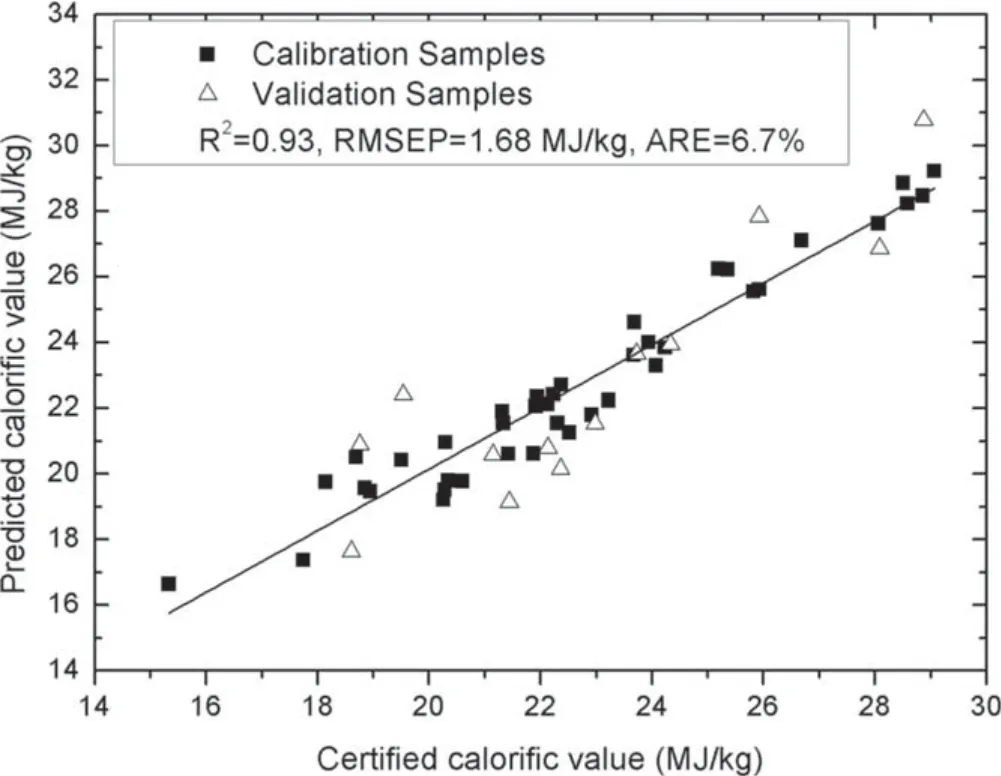
Figure 2.Quantitative analysis results of the traditional PLS model.
To quantitatively analyze the calorific value,the PLS model and the combination model were built,respectively.Both of the two models were built using the spectral line intensities of selected elements and the molecular emissions from C2and CN.To avoid over fitting of noise in the PLS model,the leave-one-out cross validation method was utilized to determine the number of principle components.The quantitative analysis results obtained from the PLS model are shown in figure 2 the R2,RMSEP and ARE are 0.93,1.68 MJ kg−1and 6.7%,respectively,showing that the PLS model is capable of achieving a good quantitative analysis of calorific value.The reason is that PLS is a powerful multivariate regression analysis tool,which can utilize plentiful spectral information to correct for various deviations.However,the main disadvantage in the PLS application in LIBS is that PLS is fundamentally a mathematical statistics method that only focuses on data correlation.If the measured sample matrix is different from the calibration sample matrix,the predictions of the PLS model may be not accurate enough [20].

Figure 3.Quantitative analysis results of the combination model.
The calibration samples were classified into two groups.One group of coal samples have volatile matter contents of lower than 20%,and the other group of coal samples have volatile matter contents of higher than 20%.The calibration sample set was utilized to establish the SVM model.The class label of the group of coal samples with the lower volatile matter contents was set to be 0,and the class label of the other group was set to be 1.The spectral line intensities of selected elements listed in table 2 were utilized as the input variables of SVM.The PLS models were established for the two calibration coal sample groups respectively.The validation sample set was utilized for the validation process.The unknown sample was firstly determined which group it belonged to by SVM model,and then the corresponding PLS model was utilized to calculate its calorific value.Figure 3 shows the quantitative analysis results of the proposed model.As shown in figure 3,R2,RMSEP and ARE of the combination model are 0.97,1.08 MJ kg−1and 3.93%,respectively.Compared with the PLS model,the increase in R2and the decrease in both of RMSEP and ARE show that the prediction accuracy can be increased by reducing the matrix effect,which is realized by explicitly classifying the coal samples according to their volatile matter contents.Besides,as shown in table 3,the correct classification rate is 100%,showing that the SVM is capable of accurately classifying the coal samples according to their volatile matter contents.The excellent classification success rate should be attributed to the fact that there is a large matrix difference between coal samples with high volatile content and the ones with low volatile content.
5.Conclusions
A model combining SVM and PLS methods was proposed for improving the measurement accuracy of the calorific value of coal.Similar to previous results of the carbon content measurement for 24 bituminous coals,the measurement of the calorific values of 53 coal samples was also influenced by the matrix effect related to the volatile matter content.The combination model utilized SVM to classify coal samples according to their volatile matter contents to reduce the matrix effect,and then applied PLS to establish calibration models for each sample group respectively to analyze the calorific value.Compared with the PLS model,the combination model can greatly increase the measurement accuracy of the calorific value.The R2,RMSEP,and ARE for the combination model were 0.97,1.08 MJ kg−1,and 3.93%,respectively,while the corresponding values for the PLS model were 0.93,1.68 MJ kg−1,and 6.7%,respectively,showing an overall improvement.
Acknowledgments
The research was supported by the key R&D program of China Energy Investment Corporation (GJNY-18-27) and National Natural Science Foundation of China (Nos.61675110 and 51906124).
猜你喜欢
阅读(低年级)(2021年6期)2021-08-09
风流一代·青春(2021年4期)2021-04-23
羽毛球(2020年10期)2020-10-20
东方教育(2017年17期)2017-10-31
校园英语·上旬(2017年11期)2017-10-25
大众文艺(2017年1期)2017-03-08
东方少年·快乐文学(2016年8期)2016-09-30
商界·时尚(2016年7期)2016-09-28
三月三(2015年5期)2015-05-05
民间故事选刊·下(2014年9期)2014-09-22
 Plasma Science and Technology2020年7期
- Plasma Science and Technology的其它文章
- Influence of target temperature on femtosecond laser-ablated brass plasma spectroscopy
- Spectral characteristics of underwater laserinduced breakdown spectroscopy under high-pressure conditions
- A novel strategy for quantitative analysis of soil pH via laser-induced breakdown spectroscopy coupled with random forest
- Quantitative analysis of the content of nitrogen and sulfur in coal based on laserinduced breakdown spectroscopy:effects of variable selection
- Geographical authenticity evaluation of Mentha haplocalyx by LIBS coupled with multivariate analyzes
- Quantitative analysis of saindha salt using laser induced breakdown spectroscopy and cross-validation with ICP-MS