
Stable water droplets on composite structures formed by embedded water into fully hydroxylated β-cristobalite silica*
2021-01-21 02:07HanqiGong龚菡琪ChonghaiQi齐崇海JunweiYang杨俊伟JigeChen陈济舸XiaolingLei雷晓玲LiangZhao赵亮andChunleiWang王春雷
Chinese Physics B 2021年1期
Hanqi Gong(龚菡琪), Chonghai Qi(齐崇海), Junwei Yang(杨俊伟), Jige Chen(陈济舸),Xiaoling Lei(雷晓玲), Liang Zhao(赵亮), and Chunlei Wang(王春雷),
1Division of Interfacial Water and Key Laboratory of Interfacial Physics and Technology,Shanghai Institute of Applied Physics,Chinese Academy of Sciences,Shanghai 201800,China
2University of Chinese Academy of Sciences,Beijing 100049,China
3School of Physics,Shandong University,Jinan 250100,China
4School of Arts and Sciences,Shanghai Dianji University,Shanghai 201306,China
5Shanghai Advanced Research Institute,Chinese Academy of Sciences,Shanghai 201210,China
6Department of Physics,East China University of Science and Technology,Shanghai 200237,China
7College of Physical Science and Technology,Yangzhou University,Jiangsu 225009,China
Keywords: lattice strain,surface wettability,embedded water,hydrogen bonds
1. Introduction
The water adsorption on the silica has drawn great interest over the years because of its scientific and technical importance, such as the etching processes[1–4]in manipulating the electro-optical devices and display panels, sensing materials,[5–7]molecule sieving,[8–11]corrosion protection,[12–14]molecule delivery,[15–17]polymer composite,[18–21]and catalysis.[22–24]As known to all, silica contains a great deal of reactive sites to react rapidly with atmospheric water, resulting in the formation of surface silanol Si–OH groups. It is well accepted that almost all properties of water are dominated by hydrogen bonds (H-bonds),[25–29]and the formation of H-bonds within interface water depends on the properties of the solid substrate.[30–36]Experiments have confirmed that the H-bonds are formed between the silica and water molecules.[37]Using density functional method,one water monolayer coverage has been found embedded in the –OH and formed H-bonds network on the cristobalite surface.[38,39]These results seem to indicate that the hydroxylated silica surfaces are expected to be highly hydrophilic due to the strong hydrogen bonds. However, Phan et al. have shown the unexpected phenomenon of the water droplets coexisting with the water monolayer on the (111) surface of βcristobalite hydroxylated silica using the molecular dynamics simulations,[40]similar to our previous studies, namely, “ordered water monolayer that does not completely wet water”at room temperature.[41]So far,the molecular understanding and the physical insights into this system with hydroxylated silica and water are still illusive.[42,43]In addition,water molecules exhibit versatile ordered structures under ambient conditions dependent on the lattice constant, which may impact the surface wetting behavior[44–50]and other properties.[51–55]So far as we know, the relationship between the lattice strain of the hydroxylated silica surface and the interfacial water structure is not fully understood.
Using molecular dynamics (MD) simulations, we have found that a water droplet appears on a composite structure formed by the hydroxyl groups and the embedded water molecules on the fully hydroxylated silica. This phenomenon can be attributed to the strong hydrogen bonds formed between water molecules and OH groups due to the appropriate OH density that can accommodate the water molecules. The composite structure composed of embedded water molecules and the surface hydroxyl (–OH) groups thus reduces the number of hydrogen bonds between the composite structure and the water droplet above the composite structure. A small uniform strain(±3%)applied to the crystal lattice of the hydroxylated silica surface can result in a notable change of the contact angles(>40◦)on the surface.
2. Simulation system and method
We carried out a set of MD simulations to investigate the water molecules on the(111)surface of β-cristobalite hydroxylated silica substrate under various lattice strains. The thickness of the substrate is 1.7 nm and the number density of hydroxyl groups on the surface(also denoted by SiO2surface) is ~4.54 nm-2, consistent with the experimental measurement.[56]The homogeneous biaxial strain was applied along the x and y directions of the substrate, and the lattice strain λ is defined as

where a and a0represent the strained and strained-free lattice constants, respectively. The positive and negative values of λ correspond to the stretched and compressed lattice configurations, respectively. The value of λ is tuned from -5%to +5% by a step of 1%, and the x–y dimension of the substrate changes from 9.62×8.33 nm2to 10.63×9.21 nm2.When the strain was not applied (λ =0), the substrate was 10.13×8.77 nm2in the x–y dimension. The simulation box size in x and y directions was equal to the size of the SiO2substrate and 10 nm high in z direction.
All simulations were performed in the canonical ensemble(NVT)via the GROMACS-4.5.4 package with a time step of 1 fs. Initially,the SiO2surface was completely covered by a water film of 5 ˚A(~3000 water molecules)in thickness for each strain. The silicon and oxygen atoms in the SiO2surface were fixed and the hydrogen atoms were free.[57,58]The temperature was maintained at 300 K by the Berendsen coupling method with a coupling time of 0.1 ps. The CLAYFF force field was used to describe the hydroxylated silica substrate[59]and the water molecules were described by the simple point charge/extended (SPC/E) model. Periodic boundary conditions were applied in all directions. The electrostatic interaction was treated using the particle-mesh Ewald(PME)method with a real-space cutoff of 1.0 nm and 1.0 nm cutoff was applied to the van der Waals interactions. The total simulation time was 20 ns and each simulation system was equilibrated for 10 ns. The data over the last 10 ns were collected per 0.5 ps for further structural analyses.
To characterize the surface wettability,we calculated the contact angle (CA) of the droplet on the surface plotted in Fig. 1(a). The droplet was divided into grids with horizontal and vertical spacing of 0.1 nm. The water density in each grid was calculated to estimate the density distribution. Further, about half the density of the bulk water was selected as the position of the liquid/vapour interface, and used to fit a circle by using the Levenberg–Marquardt least squares fitting method. Finally,the contact angle was measured by tangential cutting at the intersection of the surface with the least squares method,as illustrated by Fig.1(b).
3. Results and discussion
Figure 1 shows the snapshots of configurations and wetting behavior of the hydroxylated silica substrate under various strains. In Fig.1(a),the lattice strain is on the x–y dimension of the substrate, and the lattice constant a refers to the distance between nonbridge oxygen atoms in the SiO2surface.In order to show the wettability of the hydroxylated silica substrate, the contact angle of the water droplet formed on the surface,denoted by θc,was measured. Figure 1(c)shows the θcas a function of the lattice strain λ. For the pristine hydroxylated silica(λ =0),the substrate is hydrophilic and θcis 28.6◦±3.4◦. When it is compressed to a considerable extent of λ =-3%, θcmonotonically increases to 45.8◦±0.5◦, indicating that the surface becomes less hydrophilic. The value of θcincreases and converges to 48.4◦±2.1◦when the surface continues to be compressed to λ =-5%. In contrast,the hydrophilicity of the substrate is enhanced under stretch, as the θcmonotonically decreases to 0◦at λ =+3%,an indication of a complete wetting of the surface. These results show that the wetting behavior of the hydroxylated silica strongly depends on the lattice strain.
Figures 1(d)–1(f)further show the detailed configurations of water molecules on the hydroxylated silica surface under the lattice strain λ =-5%, λ =0, and λ =+5%. Interestingly, we observe that some water molecules near the SiO2surface embed into the hydroxyl matrix for λ = -5% and λ = 0, as shown in Figs. 1(d)–1(e). Almost each embedded water molecule coordinates with three nearest neighboring hydroxyl oxygen atoms by H-bonds. Consequently, the six-membered-ring unit consisting of three embedded water molecules and three hydroxyl groups is formed and the hexagonal two-dimensional(2D)H-bonds network can be observed.For λ =+5%, this composite structure is broken due to the loss of H-bonds between the embedded water molecules and hydroxyl groups. This phenomenon is similar to the previous theoretical[40,60–62]and experimental[63–66]observations of ordered water monolayer that does not completely wet water,where a water droplet coexists with the ordered water monolayer. However, in this case, the hexagonal H-bonds network is formed between the embedded water molecules and the hydroxyl of the silica (see Fig. 1(d)), different from the dense hexagonal water monolayer and H-bonds network in our previous study.

Fig. 1. (a) Top-view of the hydroxylated silica surface. The lattice constant is denoted by a. (b) Side-view snapshot of a water droplet on the hydroxylated silica substrate at the equilibrium state and the illustration of contact angle θc. (c)Contact angle θc as a function of the lattice strain λ from-5%to+5%. Top-and side-view snapshots of embedded water together with the SiO2 surface for(d)λ =-5%,(e)λ =0,and(f)λ =+5%.Spheres in red,grey,green,and white represent oxygen atoms of the hydroxylated silica,silicon,oxygen atoms of the embedded water molecules,and hydrogen,respectively. Water molecules embedded into the SiO2 surface of hydroxylated silica are highlighted in green color.
To quantitatively describe the interfacial water structure under various lattice strains,we analyze the number density of oxygen(O)atoms in water as a function of their vertical distance d to the Si plane of the SiO2surface. Water molecules within and beneath the droplets are mainly considered. These number density functions ρd, plotted in Fig. 2, all show two neighboring peaks with the first and second peaks locating at 0.20 nm and 0.40 nm above the Si plane. This indicates that two water layers are formed on the SiO2surface and their peak distance is just about the size of water molecules.The first water layer and O plane of the SiO2surface hydroxyl group are almost in the same height,indicating that the water molecules in fact embed into the SiO2surface. The second water layer is from water molecules in the droplet. This picture is consistent with the configurations shown in Figs.1(d)–1(f).
The densities and positions of these two water layers show a strong dependence on the lattice strains. With the increase of the lattice strain from -5% to +5%, the peak densities of the two water layers decrease, indicating that the arrangement of water molecules becomes less order. For λ =-5%,the water density can be ~75 nm-3shown by the first peak, more than 2 times of the bulk water number density of ~32 nm-3. For λ =+5%, the water density can be~50 nm-3shown by the first peak, less than 2 times of the bulk water number density. This can also be seen from the snapshot of embedded water molecules on the SiO2surface for λ =-5%(Fig.1(d))and λ =+5%(Fig.1(f)). Moreover,the first peak of O gradually shifts from 0.18 ˚A to 0.22 ˚A when the lattice strain increases from -5% to +5% (Fig. 2), showing the first water layer away from the Si plane with the increase of λ. These indicate that the composite structures composed of the embedded water molecules and the hydroxyl groups under the droplet are reduced,instead,the water molecules prefer distributing on the surface like bulk water at λ ≥+3%.

Fig. 2. Number density functions ρd of water molecules on the hydroxyl silica substrate, with respect to the vertical distance d between the oxygen atoms in water and the surface of the substrate. The dashed line corresponds to O plane of SiO2 surface.
The orientation distribution of the embedded water dipoles further reveals the structure of the embedded water molecules under the droplets. As illustrated by the insets of Fig.3,there are three types of structures in the embedded water:A:water donating two H-bonds to bulk water,B:water donating one H-bond to bulk water and the other H-bond to the surface hydroxyl groups, C: water donating two H-bonds to the surface hydroxyl groups.Figure 3 shows that for λ =+3%and+5%,δ =0◦and 50◦are two major peaks in the probability distribution function P(δ)versus the angle δ between the water dipole and z-axis,corresponding to the A and B configurations,respectively. The interfacial water in A configuration donates almost all H-bonds to bulk water and accepts two Hbonds from the surface hydroxyl groups. Then a disordered interfacial structure can be expected due to a few H-bonds formed in the inner layer. The interfacial water in B configuration donates one H-bond to bulk water and the other one H-bond to the hydroxyl groups modified on the surface, and it also forms two H-bonds with the hydroxyl groups. Thus,we can expect that the corresponding interfacial structure of B configuration is less disordered than that of A configuration. In addition,the interfacial water in C configuration does not donate its H-bonds to bulk water but donates almost all H-bonds to the surface modified hydroxyl groups, indicating that the corresponding interfacial structure of C configuration is quite stable.

Fig. 3. Probability distribution function P(δ) with respect to the angle δ between the dipole of the embedded water and z-axis. Insets:the orientation of water molecules corresponding to the selected P(δ)peaks. Spheres in red,grey,green,and white represent oxygen atoms of the hydroxylated silica, silicon, oxygen atoms of the embedded water molecules,and hydrogen,respectively.
For λ =-3%and-5%,a single preferential orientation at δ =70◦is represented by C configuration (Fig. 3). The top view of C configuration is illustrated in Fig. 1(d), which is characterized by the formation of three H-bonds with the surface hydroxyl (–OH) groups. That is, water donates two H-bonds to two neighboring surface O atoms and accepts a H-bond from a –OH modified on the surface. Moreover, as shown in Fig. 3, the interfacial water molecules on a -5%strained hydroxylated silica surface have a much narrower orientation distribution compared with those on the more tensile surface, showing that more interfacial structures of C configuration are formed at λ =-5%. These results reveal that an ordered monolayer structure is formed by forming H-bonds on the-5%strained hydroxylated silica surface. The probability distribution of water dipoles at λ =-3%is similar to that of λ =-5%,consistent with the observations in Fig.1(d)that a 2D H-bonds network exists on the hydroxylated silica surface at λ =-5%. This is also consistent with the observation in Fig.2,and more narrow peaks indicate a more ordered structure. Interestingly, the peak centered at 70◦becomes broader and lower with increasing lattice strain from -5% to +5%(Fig.3),resulting in the gradual transition from an ordered C to a disordered B configuration. Therefore, when the surface lattice is stretched, the interface structure becomes more disordered. This indicates that the lattice strain can significantly affect the structures of interface water on a hydroxylated silica surface.
We also measured the probability distribution of the angle φ between the x–y plane projection of one water molecule dipole orientation and x-axis direction, as shown in Fig. 4,which further confirms the existence of the hexagonal 2D Hbonds network. When λ ≥+3%, there are three peaks at φ =90◦, 210◦, and 330◦, but with relatively low probability(Fig. 4). As a contrast, when λ ≤0, there is a clear dipole orientation preference of the embedded water with three peaks at φ =90◦, 210◦, and 330◦with relatively high probability(Fig. 4). This is consistent with the observation in Figs. 1(d)and 1(e)that each embedded water molecule coordinates with three nearest neighboring hydroxyl oxygen atoms by H-bonds,namely,the existence of the hexagonal 2D H-bonds network.
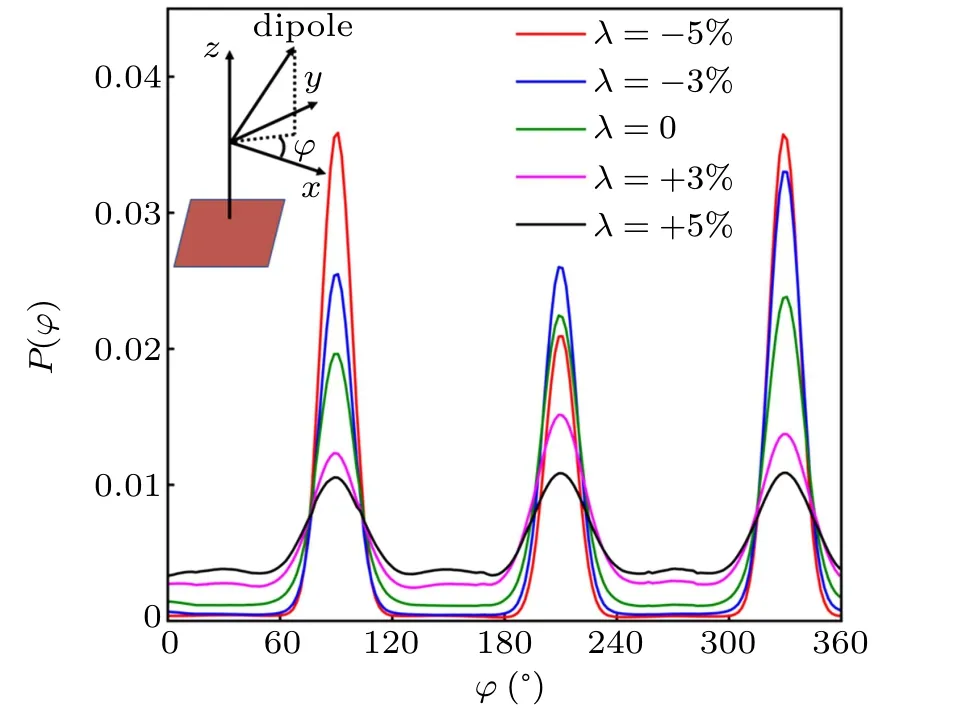
Fig.4. Probability distribution function P(φ)with respect to the angle φ between x–y plane projection of one water molecule dipole orientation and x-axis direction. The water molecule belongs to the droplets and the embedded water molecules under the droplets.
To further clearly show the structures of the interface water,we analyzed the H-bonds network of the interfacial water by calculating the H-bonds number versus lattice strain. Here,the H-bonds within the composite structure are mainly formed between the embedded water molecules and surface hydroxyl groups (denoted as NW-Sin Fig. 5) as average over the embedded water molecules under the droplet, and the H-bonds between the composite structure and water droplets (denoted as NC-Din Fig. 5) consist of two parts: I. the H-bonds between the embedded water molecules and the water droplet on the composite structure (denoted as NW-Din Fig. 5) as average over the embedded water molecules under the droplet;II.the H-bonds between the surface hydroxyl groups and water droplets(denoted as NH-Din Fig.5)as average over the surface hydroxyl groups under the droplet. At λ =-5%, each embedded water molecule forms three H-bonds with adjacent hydroxyl groups,consistent with the C configuration forming three H-bonds with the hydroxyl groups(see Fig.3). This indicates that a perfect 2D H-bonds network is formed with a C3axis along the surface normal at λ =-5%,which is consistent with the observation of Fig.1(d). However,at λ =+5%,each embedded water molecule forms two H-bonds with adjacent hydroxyl groups, consistent with the A and B configurations forming two H-bonds with the hydroxyl groups (see Fig. 3).Interestingly,as λ changes from-5%to+5%,the number of H-bonds between the composite structure and water droplets(NC-D) increases, but the H-bonds number in the composite structure(NW-S)decreases. This result indicates the more hydrophilic of the composite structure when λ increases from-5%to+5%. However,for 3%≥λ ≥-3%,the decrease of NC-Dis rather remarkable from 2.31 to 0.48, indicating that the interfacial water structure is seriously affected by lattice strain λ. We note that this remarkable decrease is consistent with the significant change of CA in Fig.1(c).
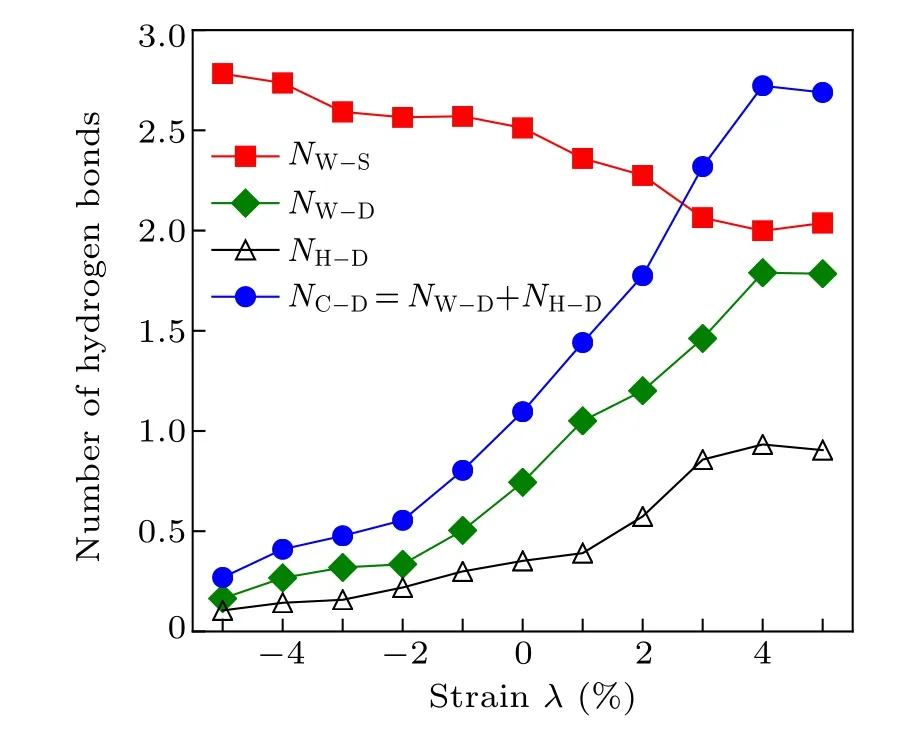
Fig.5. Average number of H-bonds as a function of the lattice strain λ from-5%to+5%. The average number of H-bonds between the embedded water molecules and the surface hydroxyl groups(red squares,denoted by NW-S). The average number of H-bonds between the embedded water and water droplets(green diamonds,denoted by NW-D).The average number of H-bonds between the surface hydroxyl groups and water droplets (black triangles, denoted by NH-D). The average number of H-bonds between the composite structure and water droplets(blue circles,denoted by NC-D). The composite structure composed of embedded water molecules and the surface hydroxyl(–OH)groups.
Why does the lattice strain have such a large influence on the structure of the interfacial water? This is ascribed to that the average H-bonds number NC-Dbetween the composite structure and the water droplet on the composite structure is significantly reduced from 2.68 to 0.29 as λ decreases from+5%to-5%,as shown in Fig.5.Thus,at λ =+5%,the composite structure (including the OH and the embedded water molecules)on the surface forms almost three H-bonds with the water droplet, thus the composite structure strongly interacts with the water droplet. Consequently, the network structure within the water molecules on the surface can be easily disrupted by water molecules in the water droplet,and the property of the interface water structure is more like that of the bulk water and the surface hydrophilicity is enhanced, consistent with the observation in Fig.1(c).On the contrary,the H-bonds number per embedded water molecule in the composite structure increases from ~2 to ~3 with λ changing from +5%to -5%. When λ ≤-3%, one embedded water molecule of the composite structure just forms about 0.5 H-bonds with the water droplet,and the embedded water molecules of the composite structure weakly interact with the water droplet. In this case, the embedded water molecules of the composite structure are arranged and form perfect hexagonal rings with the adjacent hydroxyl groups at λ ≤-3%, which results in surface water droplets due to the obvious difference in the molecular structure of the interfacial water. Therefore,the observed structure rearrangement of interfacial water and the existence of water droplets are mainly dominated by the reduced Hbonds number between the embedded water on the surface and the water droplet on the composite structure.
4. Conclusion and perspectives
Our simulations show a strong relationship between the lattice strain of the hydroxylated silica surface and the water contact angle. As λ decreases from +3% to -3%, the CA sharply increases from 0◦to 45.8◦, while the CA values keep constant with further increasing λ from+3%to+5%or further decreasing λ from-3%to-5%. The large variation of the contact angle is attributed to the formation of a composite structure composed of embedded water molecules and the surface hydroxyl (–OH) groups, which reduces the number of H-bonds between the composite structure and the water droplet above the composite structure. This phenomenon also serves evidence of similar wetting phenomena to the previous theoretical[40,60–62]and experimental[63–66]observations of“ordered water monolayer that does not completely wet water”at room temperature with a water droplet coexisting with the ordered water monolayer. However,in this case,the solid surface with OH forming H-bonds network with the embedded water becomes hydrophobic, different from the hydrophobicity of the ordered water in the previous studies. Moreover,we note that the contact angle of a water droplet on a hydroxylated silica surface is reduced by a large value of 45.8◦when a small lattice strain of±3%is applied. Thus,we expect that control of the wettability of the silica surface can be experimentally achieved by applying a relatively small strain. This study takes a step towards the correlation between the interfacial water structure and the wettability of a real surface,which is promising for the development of silica-based applications,such as water treatment, drug delivery, oil recovery, nanodevices,catalysis,and biological sensors.
Acknowledgment
The MD simulations were performed with the Deepcomp7000 and ScGrid of the Supercomputing Center, the Computer Network Information Center of the Chinese Academy of Sciences,and the Shanghai Supercomputer Center of China.
猜你喜欢
Chinese Physics B(2023年1期)2023-02-20
今日农业(2022年15期)2022-09-20
做人与处世(2022年2期)2022-05-26
思维与智慧·上半月(2022年4期)2022-04-08
十几岁(2021年5期)2021-11-22
学校教育研究(2018年1期)2018-10-21
水动力学研究与进展 B辑(2018年4期)2018-09-28
连环画报(2016年10期)2016-12-16
鸭绿江(2016年5期)2016-04-29
- Chinese Physics B的其它文章
- Two-dimensional finite element mesh generation algorithm for electromagnetic field calculation*
- Surface active agents stabilize nanodroplets and enhance haze formation*
- Synchronization mechanism of clapping rhythms in mutual interacting individuals*
- Theoretical study of the hyperfine interaction constants,Land´e g-factors,and electric quadrupole moments for the low-lying states of the 61Niq+(q=11,12,14,and 15)ions*
- Ultrafast photoionization of ions and molecules by orthogonally polarized intense laser pulses: Effects of the time delay*
- Probing time delay of strong-field resonant above-threshold ionization*